EUR/USD:
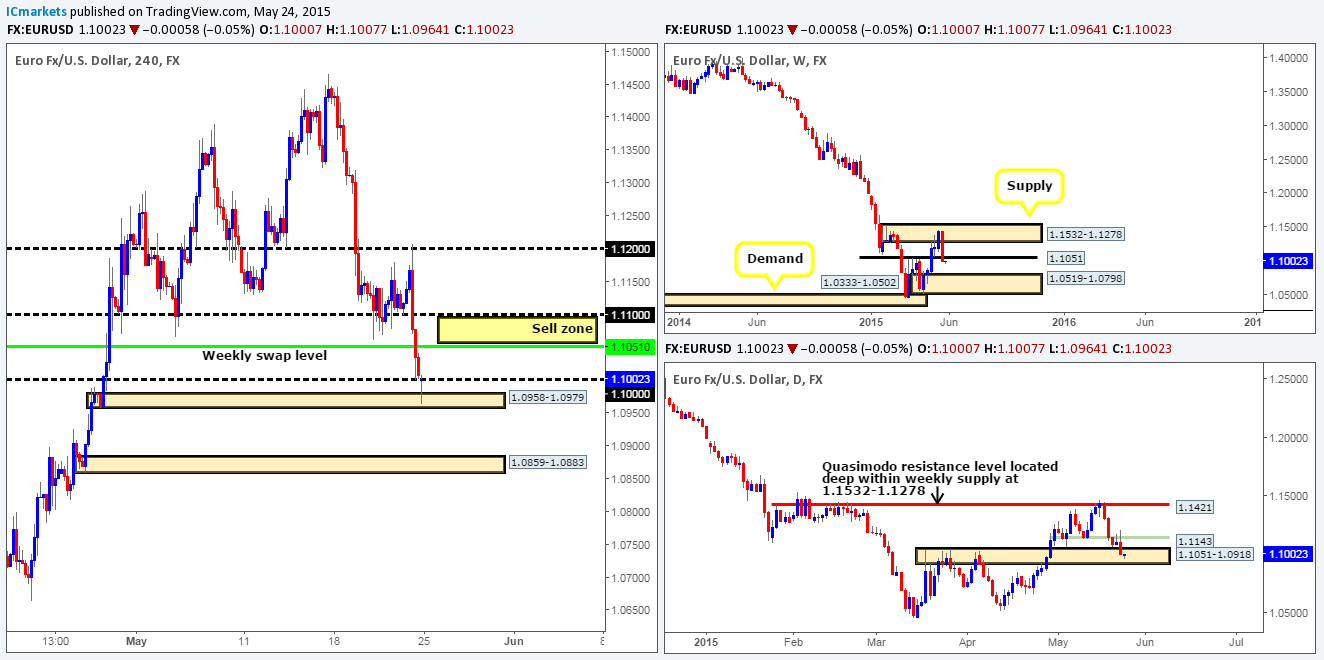
Weekly view: Last week’s trading action shows that the Euro sold off from a weekly supply area coming in at 1.1532-1.1278, resulting in price taking out a weekly swap level seen at 1.1051, and closing on its lows at 1.1008. Provided that the sellers can hold the market below 1.1051 this week, we may see a further push south down towards the weekly demand zone positioned at 1.0519-1.0798.
Daily view: The 1.1143 daily swap level was, as you can see, clearly enough to hold the market lower towards the end of week. As a result, price was forced relatively deep into a daily swap area seen at 1.1051-1.0918. Granted, at this point in time, this daily swap zone does look weak and may eventually give way. Nevertheless, it is still a little too early to completely discount it since there could very well be unfilled buy orders still remaining deep within this zone.
4hr view: From this angle, we can see that once the London session got in to full swing on Friday, price aggressively sold off from the 1.1200 handle. This continued into the U.S session, resulting in price taking out both the 1.1100 level, and as already mentioned above, the weekly swap level 1.1051 as well.
Today’s opening price – an even 1.1000, saw the Euro drive below the 1.1000 number, and test the 4hr demand area seen at 1.0958-1.0979. Considering that this 4hr demand zone is located within a daily demand area at 1.1051-1.0918, there’s a chance we may see price bounce from here. For anyone considering taking a long position from this area, however, you may want to take into consideration that potential resistance is sitting just above (our sell zone in yellow) between the aforementioned weekly swap level and the round number 1.1100 – a beautiful place to exit any intraday longs you may have and begin looking for confirmed lower timeframe shorts. Should price reach our sell zone today, and successfully hold the market lower, we could potentially see a potentially aggressive sell off from here.
As a final point, Europe, London and the U.S all have Bank holidays today, so with most of the major players taking a break, the market is going to be less liquid; this can either lead to both abnormally low and abnormally high volatility. Be careful out there today!
Levels to watch/live orders:
- Buys: Flat (Predicative stop-loss orders seen at: N/A).
- Sells: 1.1051/1.1100 [Tentative – confirmation required] (Predicative stop-loss orders seen at: dependent on where one confirms this area).
GBP/USD:
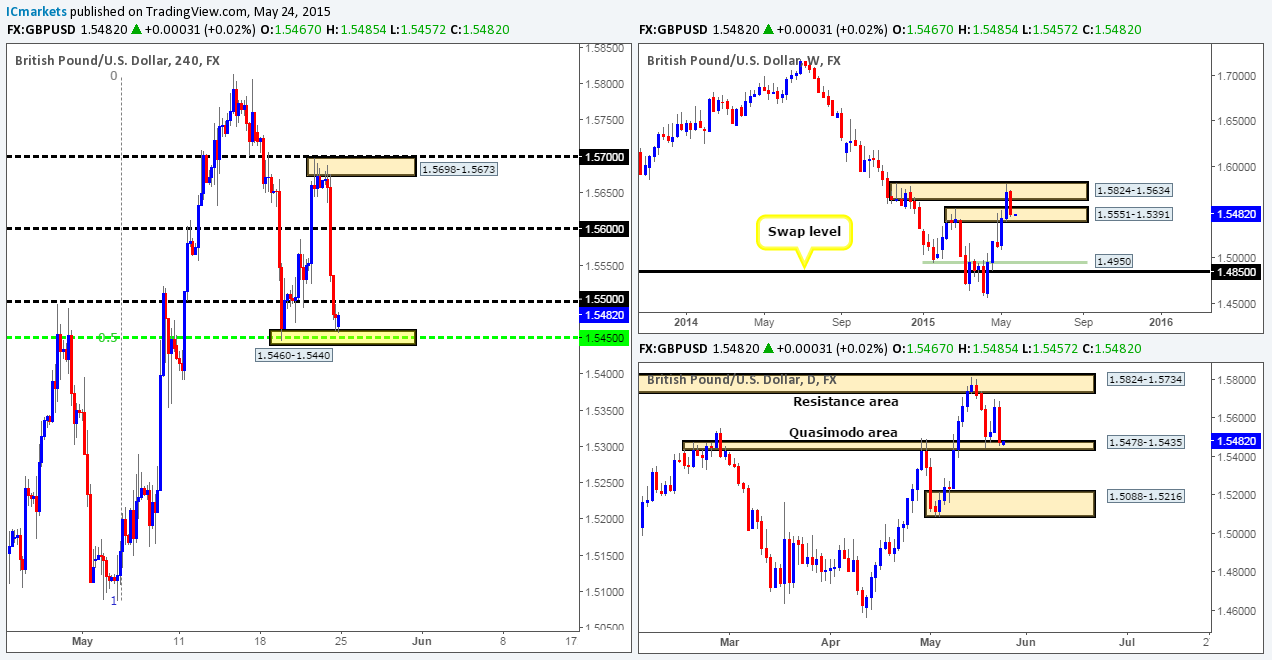
Weekly view: The weekly timeframe shows that last week’s trading saw the GBP sell off from deep within a weekly supply area coming in at 1.5824-1.5634. This, as you can see, not only forced price to close (1.5478) deep within a weekly swap area seen just below it at 1.5551-1.5391, but also formed a bearish inside candle pattern.
Daily view: From the daily timeframe, we can see that the market was held higher last week by an ignored daily Quasimodo area seen at 1.5478-1.5435. Despite this though, Friday’s sell off into this zone saw little to no buying interest being seen into the close. Should this zone give way this week, a continuation move south down towards daily demand at 1.5088-1.5216 could take place.
4hr view: Very similar to the Euro pair, the GBP dropped like a rock during the London session from just below the 1.5700 number on Friday. This saw price take out not only 1.5600, but also 1.5500 as well – over a 200-pip move. For those who read our last report on this pair, you may recall that we shorted this market at 1.5658 with our stop set at 1.5686. We got stopped out within two pips – TWO PIPS, before price aggressively sold off!
Considering the market’s overall position on the higher timeframes at the moment (see above), our prime focus for today will be the 1.5460-1.5440 4hr support area, which has so far been supportive since the market opened lower at 1.5467.
This 4hr zone not only boasts support from both the mid-level number 1.5450 and the 0.50 Fibonacci retracement level, it’s also located deep within weekly and daily timeframe supportive structures (see above). However, buying the GBP from this 4hr area is not really something our team would be comfortable with, especially with potential resistance looming just above at 1.5500. As far as we can see, waiting for price to break above and retest 1.5500 would not only be a far more conservative approach, but also give you a more favorable risk/reward ratio (if you target 1.5600). Furthermore, let’s not forget that most of the major players are on vacation today (Europe/London/U.S); therefore entering long here even with lower timeframe confirmation could be a very, very frustrating task with today’s potentially slow-moving market.
Levels to watch/ live orders:
- Buys: Flat (Predicative stop-loss orders seen at: N/A).
- Sells: Flat (Predicative stop-loss orders seen at: N/A).
AUD/USD:
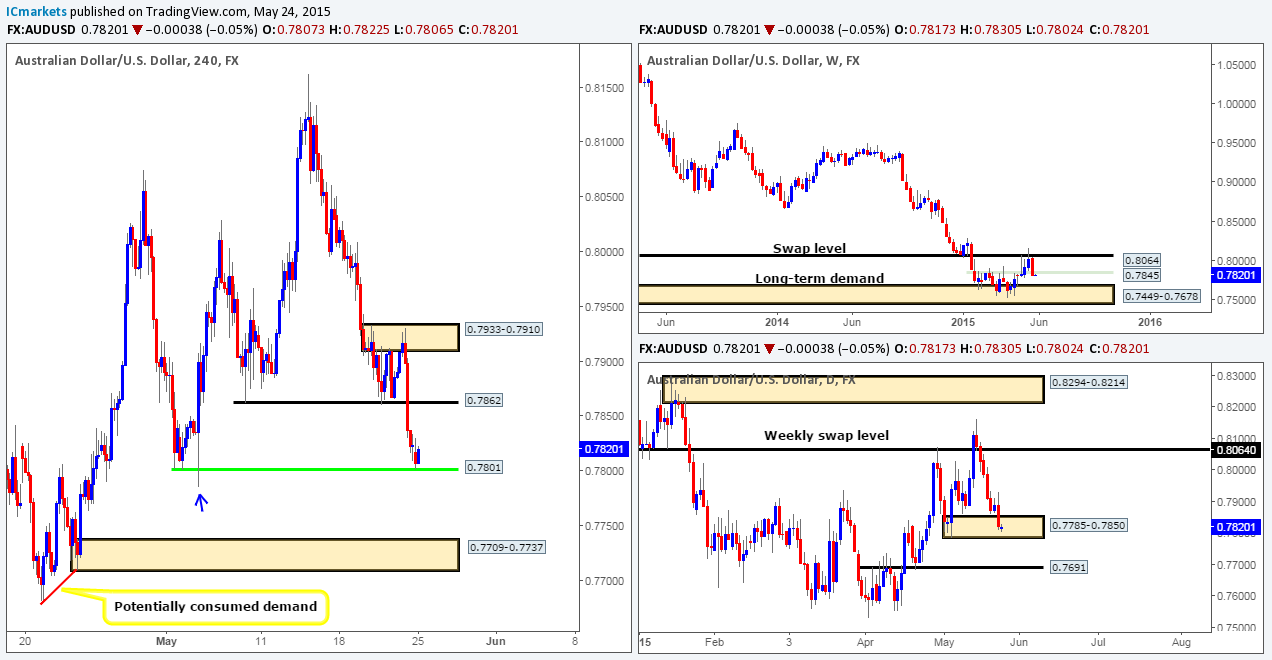
Weekly view: The week ended with the Aussie pair closing (0.7823) below a weekly swap level seen at 0.7845. As long as the sellers can hold the market below this level this week, it is very possible we may see price shake hands with the long-term weekly demand area coming in at 0.7449-0.7678.
Daily view: The daily timeframe on the other hand, reveals that price is now trading relatively deep within a daily demand area at 0.7785-0.7850. Therefore, in order for further selling to be seen on the weekly timeframe, this daily demand zone will need to be taken out.
4hr view: Friday’s sessions saw the Aussie pair violently sell off from the 4hr supply area seen at 0.7933-0.7910. This move took out 0.7862, and closed for the week just above a 4hr Quasimodo support level seen at 0.7801. The open 0.7817, however, saw price immediately continue to sell off, forcing price to punch into the aforementioned 4hr Quasimodo support level.
With this 4hr Quasimodo level sitting nicely within daily demand at 0.7785-0.7850, one would naturally think to enter long. However, from where we’re standing, by entering long here you would be effectively buying into near-term weekly resistance at 0.7845. Therefore, even with confirming lower timeframe price action, we believe a long from here will only be good for a short bounce at best. That being the case, we are going to keep a close eye on how price behaves around this 4hr Quasimodo level today. In the event price closes below, which we think is highly likely, the river south should be ‘ripple free’ down to 4hr demand coming in at 0.7709-0.7737 (surrounds the aforementioned daily swap level). Despite this though, for us to be given the ‘Ok’ to short following a close lower, we would need to see the following take place:
- A break below the low seen marked with a blue arrow at 0.7785.
- A strong retest of 0.7801 as resistance.
- Supporting lower timeframe confirming price action alongside the retest.
Levels to watch/ live orders:
- Buys: Flat (Predicative stop-loss orders seen at: N/A).
- Sells: Flat (Predicative stop-loss orders seen at: N/A).
USD/JPY:
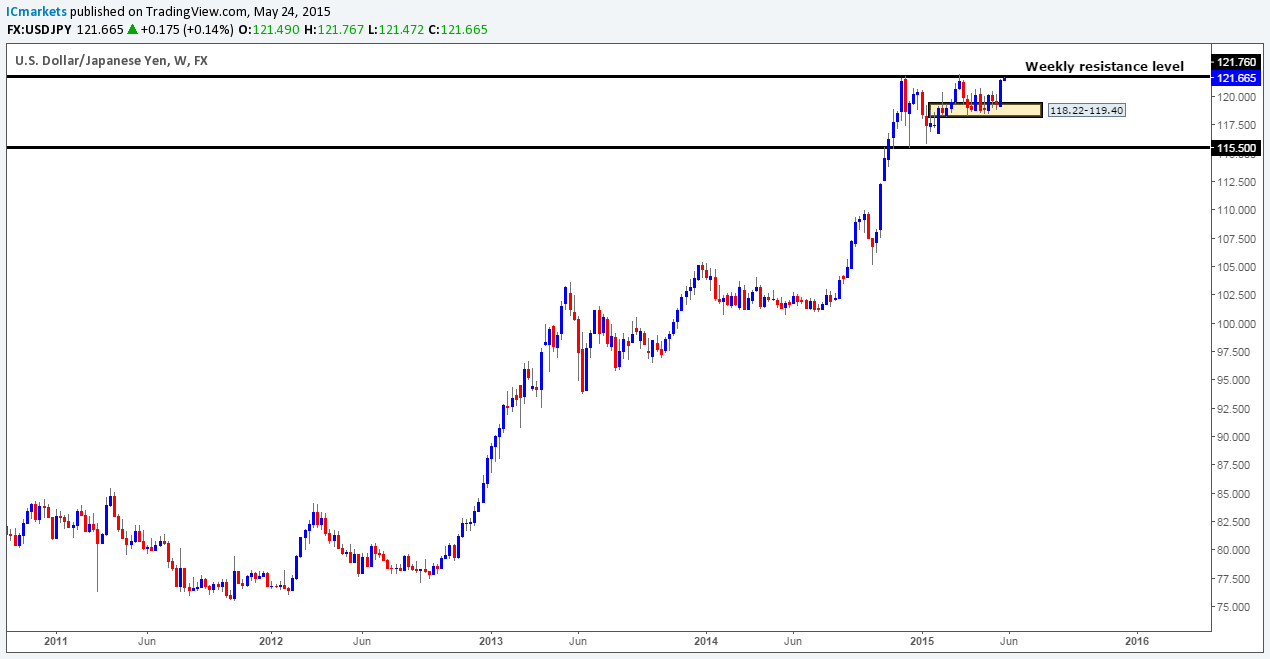
Weekly view: After two months of tedious ranging action within weekly demand seen at 118.22-119.40, this market seems to have finally woken up! The buyers were really on form last week, rallying this pair a cool 224 pips up to just below a long-term weekly resistance level set at 121.76.
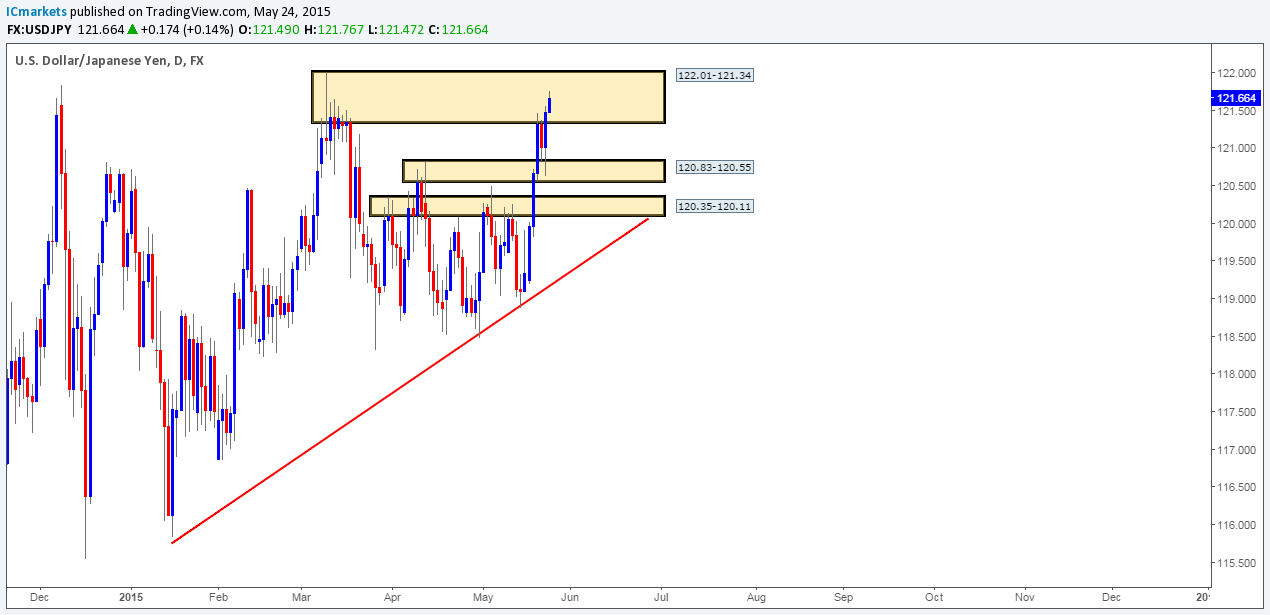
Daily view: During last week’s buying onslaught, price crashed into a daily supply area seen at 122.01-121.34 (surrounds the aforementioned weekly resistance level), which saw price rebound going into Thursday’s close. The sell off from this daily supply zone was relatively short-lived – active buyers came into the market from within a daily swap area positioned just below at 120.83-120.55, resulting in price forming a bullish engulfing candle pattern into the weekly close.
USD/CAD:
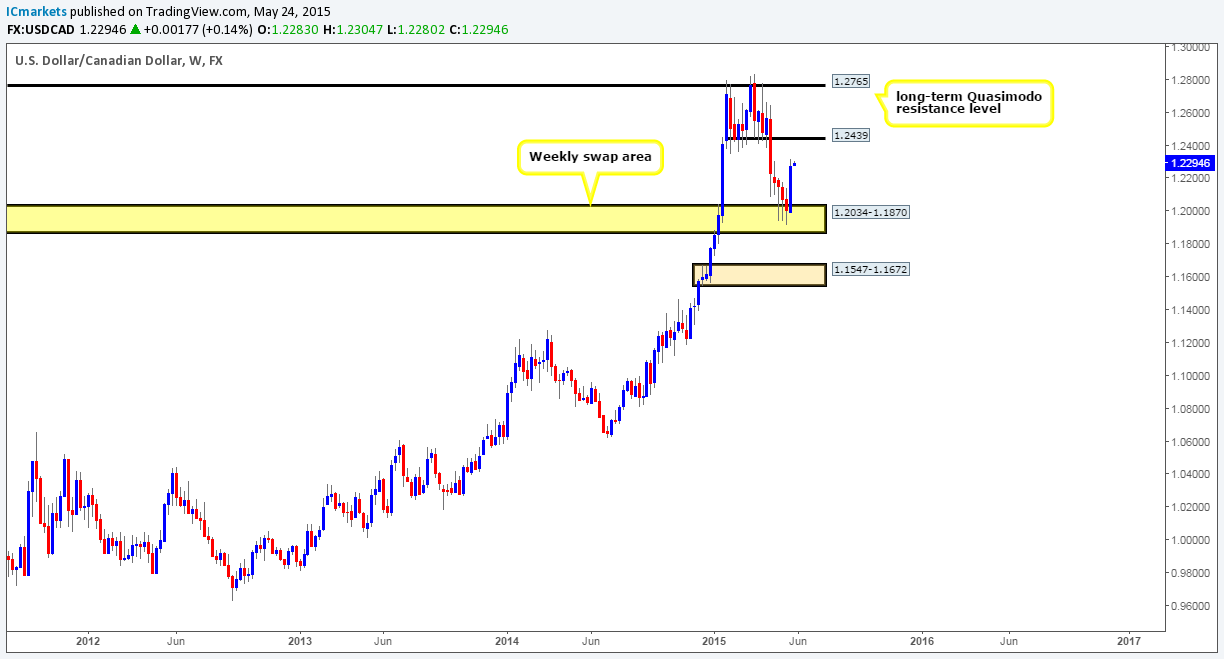
Weekly view: Last week’s movement saw the USD/CAD pair rocket north from a weekly swap area set at 1.2034-1.1870, taking back any losses seen during the previous month. In the event that the buyers can continue with this tempo, we’ll likely see price attack the weekly swap level seen above at 1.2439 sometime this week.
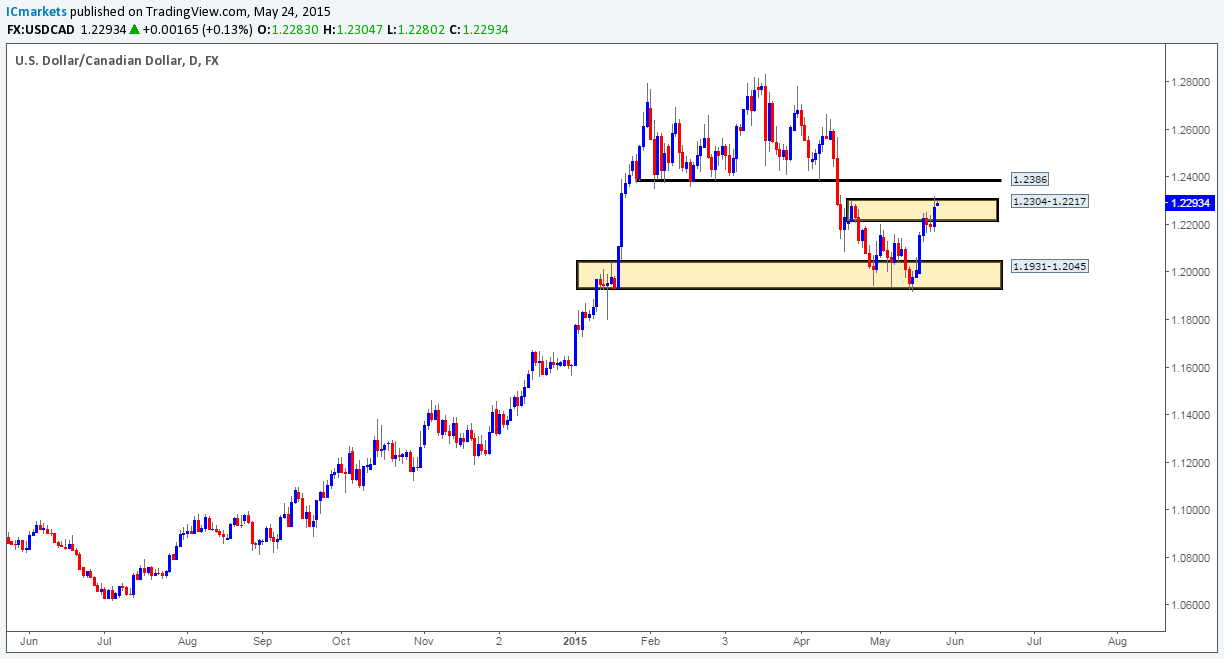
Daily view: Following Wednesday and Thursday’s pathetic attempt to sell off from the daily supply area seen at 1.2304-1.2217, Friday’s sessions responded with an advance. This move, as you can see, broke the upper limits of the aforementioned daily supply zone, which very likely triggered a ton of buy stops and potentially opened the gates for the market to challenge the very obvious daily swap level coming in at 1.2386.
USD/CHF:
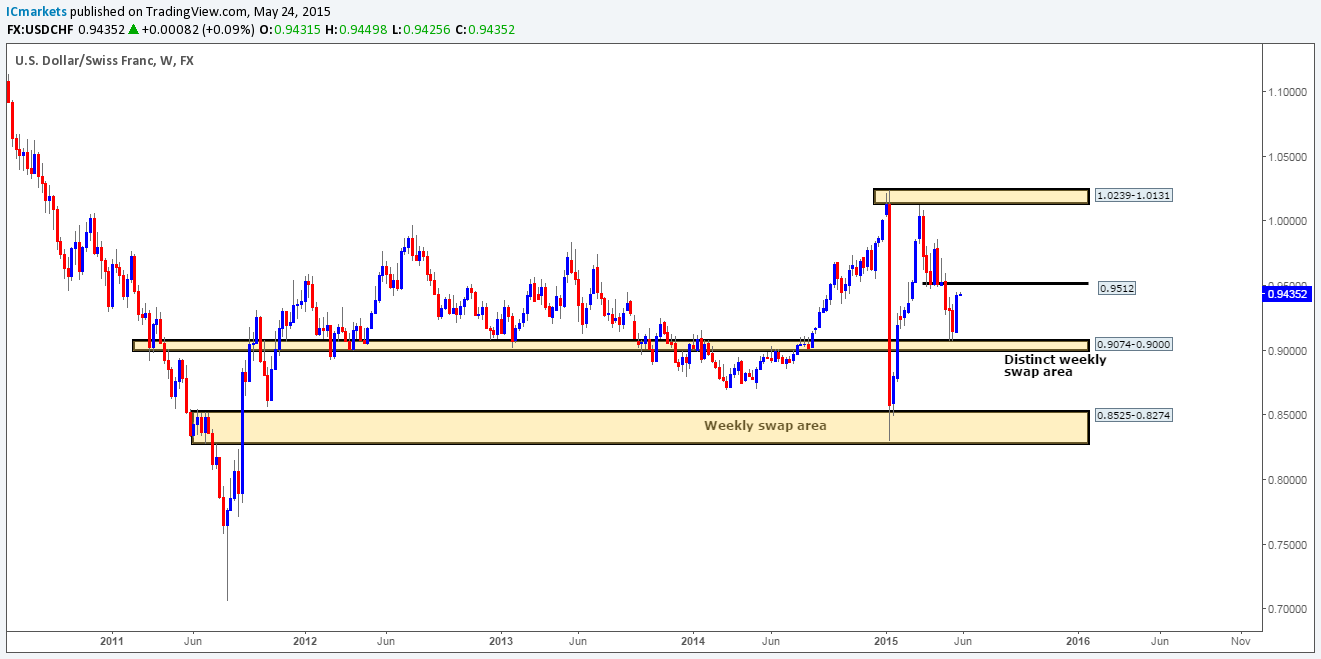
Weekly view: Following the rebound seen from the weekly swap area 0.9074-0.9000, price extended higher last week resulting in the market closing the week out at 0.9427 – only 85 pips below the weekly swap level 0.9512.
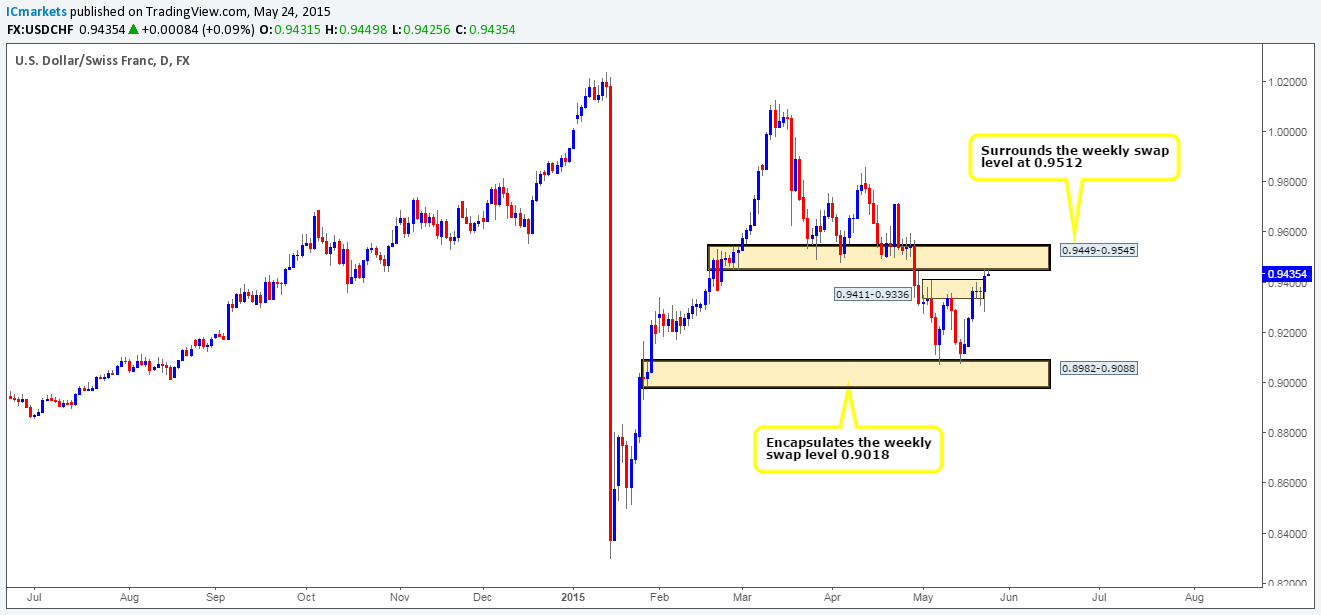
Daily view: The daily timeframe shows that the daily supply area at 0.9411-0.9336 eventually gave way on Friday, resulting in price crossing swords with a daily swap area seen just above it at 0.9449-0.9545 (encapsulates the weekly swap level at 0.9512). This may cause the market to sell off this week.
US 30:
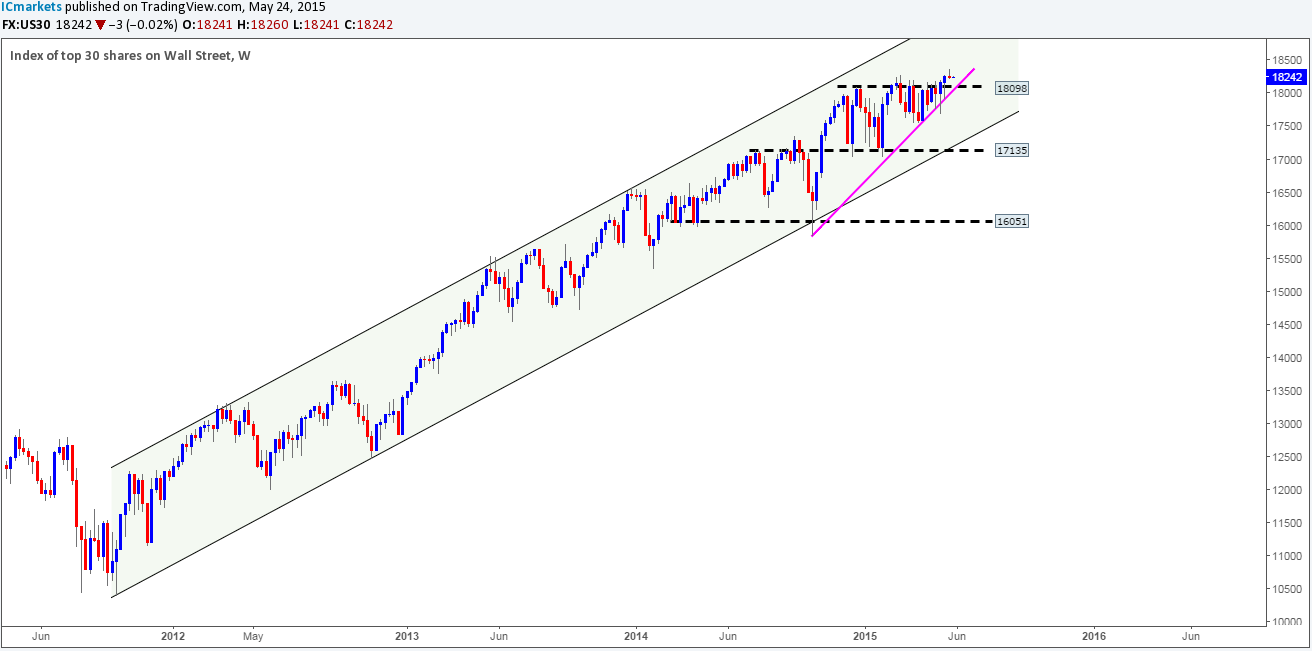
Weekly view: Last week’s candle formed a very tidy bearish pin-bar candle going into the close 18245. Granted, this may send the market lower this week – the most we see this market falling to however is the recently broken weekly resistance level 18098, which, as you can see, converges just beautifully with a weekly trendline extended from the low 15849.
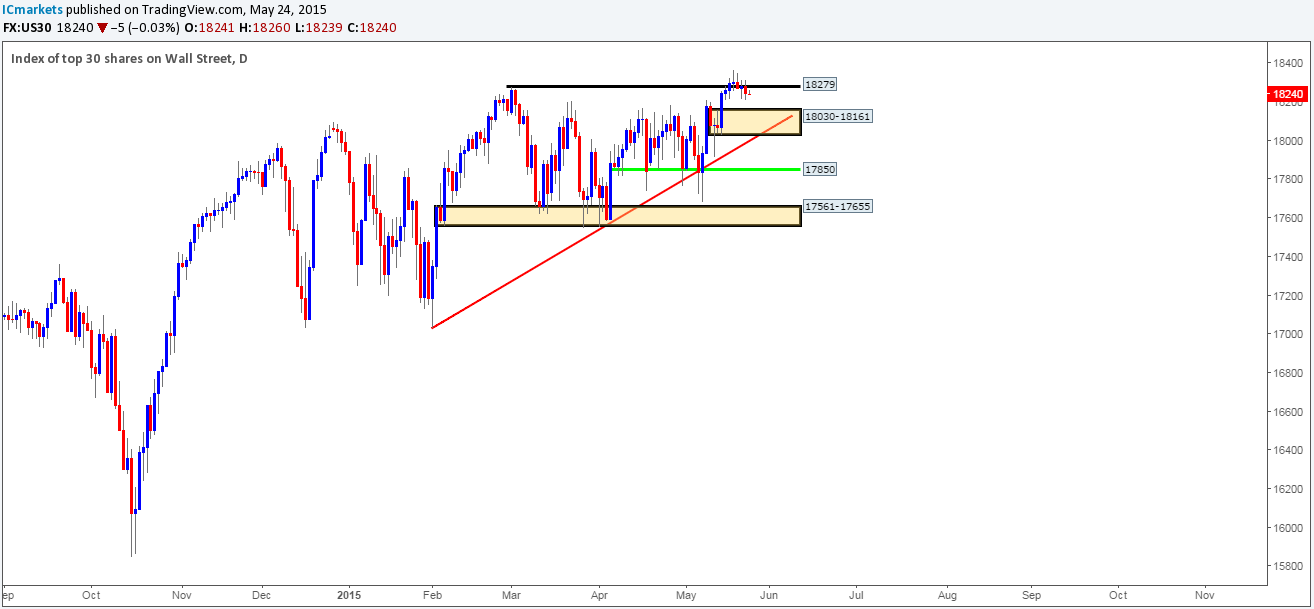
Daily view: From the daily timeframe, we can see that the buyers failed to hold the market above the recently broken high 18279. This likely suggests that the DOW will sell off this week down to at least the daily demand area coming in at 18030-18161, that boasts additional support from a daily trendline taken from the low 17033.
XAU/USD (Gold)
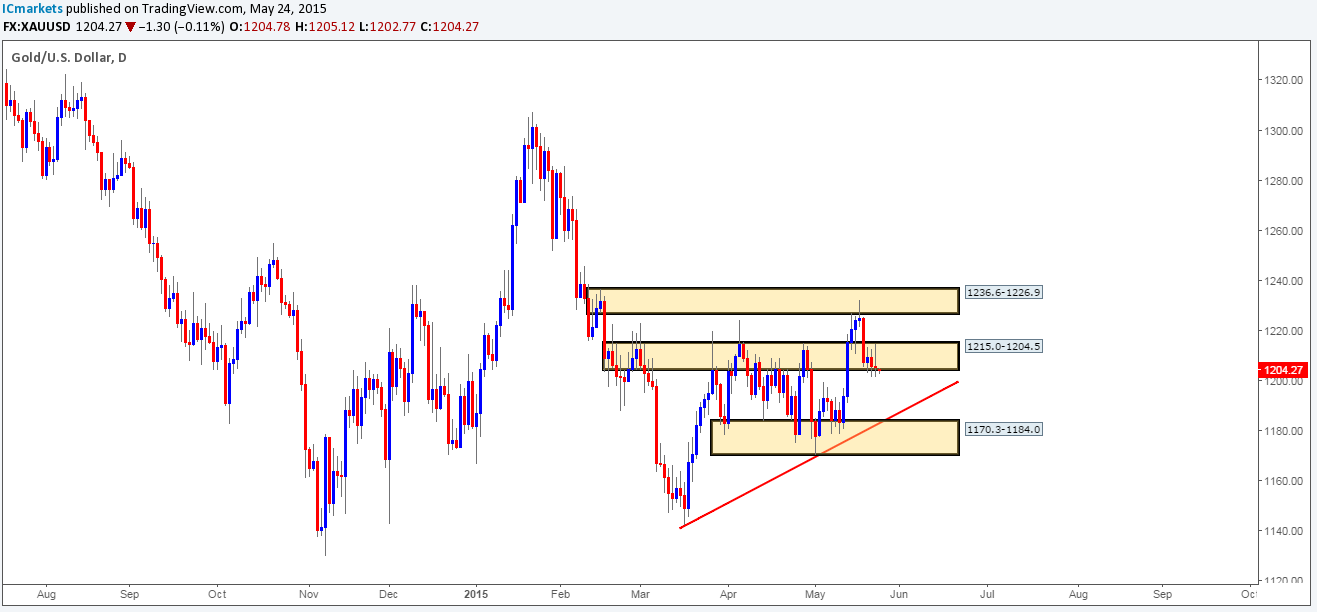
Weekly view: Following the break above the weekly supply at 1223.1-1202.6 last week, the gold market sold off taking back 50% of the prior week’s gains and closing at 1205.5. Assuming that the sellers remain strong going into this week, we may see price challenge the swing low 1170.3, or even the weekly demand area seen just below it at 1130.1-1168.6.
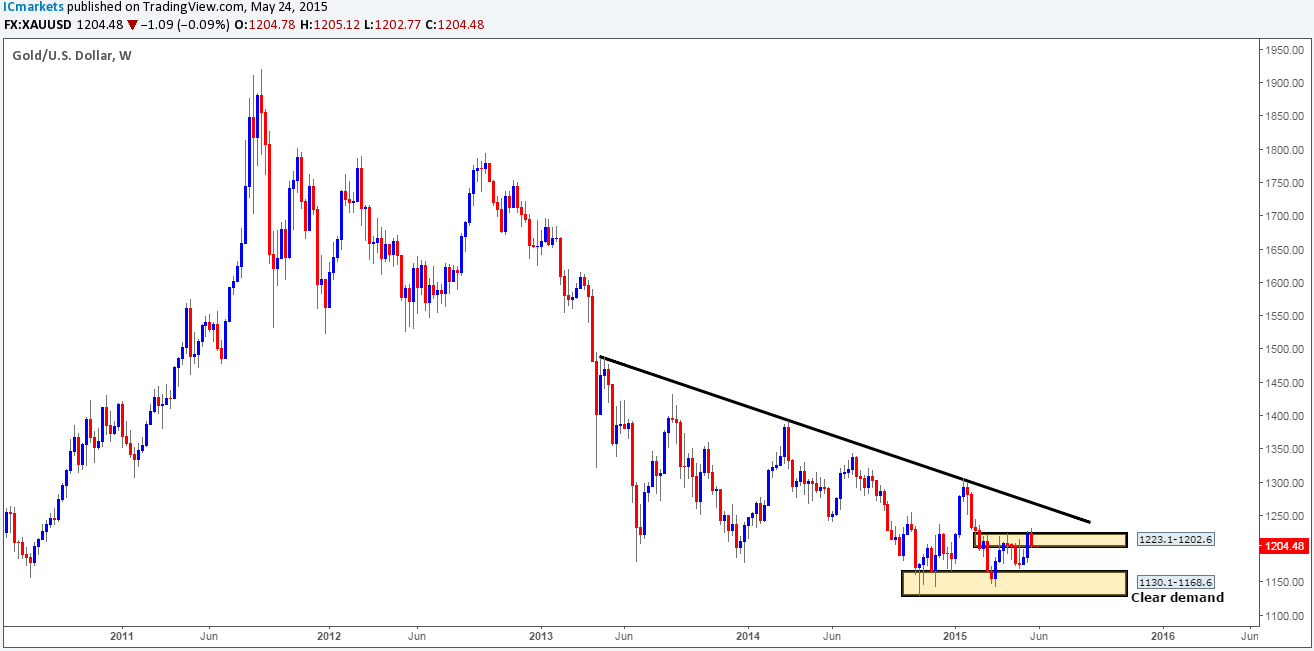
Daily view: Wednesday through to Friday saw the buyers struggling to maintain a position within the daily swap area seen at 1215.0-1204.5. Should we see this area engulfed this week, this could set the stage for a continuation move south down towards a daily buy zone (1170.3-1184.0), that boasts trendline confluence from the low 1142.5.