
A note on lower timeframe confirming price action…
Waiting for lower timeframe confirmation is our main tool to confirm strength within higher timeframe zones, and has really been the key to our trading success. It takes a little time to understand the subtle nuances, however, as each trade is never the same, but once you master the rhythm so to speak, you will be saved from countless unnecessary losing trades. The following is a list of what we look for:
- A break/retest of supply or demand dependent on which way you’re trading.
- A trendline break/retest.
- Buying/selling tails/wicks – essentially we look for a cluster of very obvious spikes off of lower timeframe support and resistance levels within the higher timeframe zone.
- Candlestick patterns. We tend to only stick with pin bars and engulfing bars as these have proven to be the most effective.
We search for lower timeframe confirmation between the M15 the H1 timeframes, since most of our higher-timeframe areas begin with the H4. Stops are usually placed 5-10 pips beyond confirming structures.
EUR/USD:
Weekly gain/loss: – 56 pips
Weekly closing price: 1.0972
Weekly opening price: 1.0970
Weekly view: From this angle, the shared currency now appears to heading in the direction of a long-term weekly support level coming in at 1.0819. This line has, at least in our opinion, certainly stood the test of time and could play a significant role in the near future, should the bears continue to dominate.
Daily view: Since price retested the daily resistance area seen at 1.1224-1.1104, the pair has been slowly grinding lower. Apart from the referendum low seen at 1.0911, there’s little support stopping price from reaching the aforementioned weekly support level.
H4 view: A quick recap of Friday’s trading shows that price only really became active following the US open, pushing the EUR below a H4 Quasimodo line at 1.0984 (now acting resistance) and colliding with a H4 channel support extended from the high1.1124 by the close.
With little change seen at this morning’s open, our team has noted the following going into the new week:
- On the whole, this market is likely headed lower. We say this simply because it seems the weekly bears seem intent on driving south to test the above said weekly support. Not only this, there is, as we explained above, also little support seen on the daily timeframe aside from the referendum low seen at 1.0911.
- As for today, however, downside momentum may struggle according to H4 structure. Not only is price flirting with a respectable H4 channel support, but directly below this line sits a H4 Quasimodo line at 1.0940, backed by a deep H4 88.6% Fib retracement level at 1.0945 and a H4 mid-way support at 1.0950. What’s more, it was here the unit found support during the ‘Brexit’ fallout, thus signifying strength in our opinion.
Our suggestions: Although we feel the overall direction of this market is south, a bounce from the above said H4 Quasimodo will likely take place. By taking this trade, we would effectively be trading against higher timeframe flow, so adhering to strict trade management rules is a MUST. Being cautious and waiting for a lower timeframe signal (see the top of this report) is also recommend, and technically speaking, the most we see this market bouncing to is the 1.10 handle. Therefore, this would be our final take-profit target, so a relatively tight stop loss is required to ensure risk/reward remains in our favor.
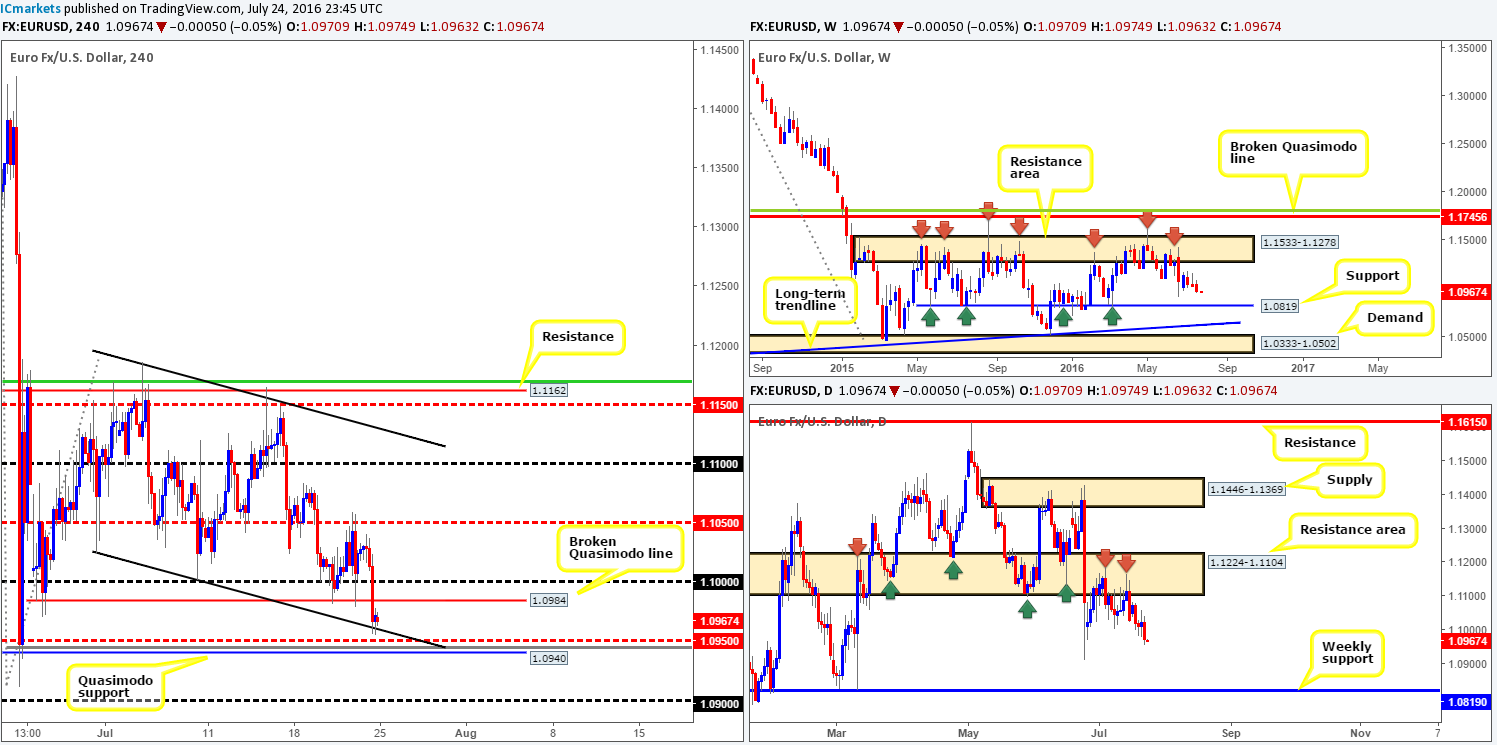
Levels to watch/live orders:
- Buys: 1.0940/1.0950 [Tentative – confirmation required] (Stop loss: dependent on where one confirms this area).
- Sells: Flat (Stop loss: N/A).
GBP/USD:
Weekly gain/loss: – 64 pips
Weekly closing price: 1.3108
Weekly opening price: 1.3144
Weekly view: In comparison to the last few weeks, the pair ranged a mediocre 250 pips last week, consequently forming what most candle enthusiasts would label an ‘inside candle formation’. Directly above current price, there’s a weekly resistance area at 1.3501-1.3804, while to the downside we see little support to the left of current price until the market reaches the 1.20 region (we had revisit 1986 to find this).
Daily view: The story on the daily chart, however, shows that candle action is currently capped between a daily supply drawn from 1.3533-1.3426 and a daily demand barrier coming in at 1.2789-1.2928. The supply, as you can probably see, is glued to the underside of the above said weekly resistance area, while the demand has little connection to the left of price as far as we can tell.
H4 view: Analyzing Friday’s sessions on the H4 chart shows that the bid-side of this market came under serious pressure going into London trading, following a lower than expected flash services PMI. As a result of this, the 1.32 handle was engulfed and price went on to cross swords with a H4 demand base carved from 1.3064-1.3109. Despite sterling opening on a strong footing this morning from here (36-pip gap), the most we expect from this barrier is the 1.32 hurdle.
The area that really catches our eye, nevertheless, is the 1.2868/1.2929 region (green) which is effectively a H4 harmonic Gartley reversal zone. Reinforcing this area, we see there is a 1.29 handle, a H4 Quasimodo support line at 1.2864 and the aforementioned daily demand base. Although there is a strong possibility that the GBP is heading much lower (see the weekly section), we feel that this H4 harmonic zone will produce a decent-sized bounce given its merging structures!
Our suggestions: Our team is very confident in the H4 harmonic zone mentioned above, so a pending buy order has been placed at 1.2940. Now, in regard to stops we see two possibilities here: an aggressive stop below the H4 Quasimodo low marked with a black arrow at 1.2847 or the more conventional stop below the X point of the H4 harmonic pattern at 1.2777. In that the bounce could be short lived here, we have opted for the more aggressive stop loss in this case.
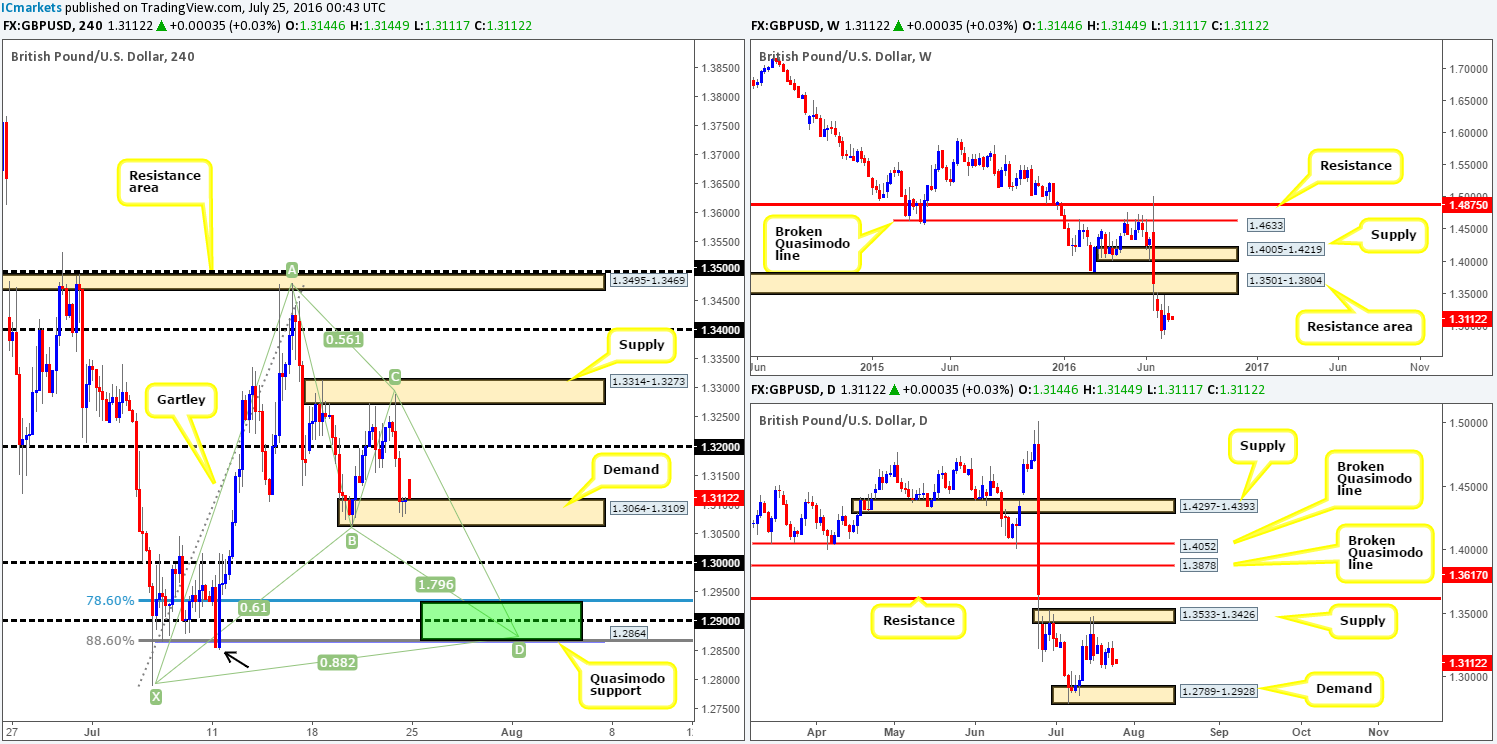
Levels to watch/live orders:
- Buys: 1.2940 [Pending order] (Stop loss: 1.2847).
- Sells: Flat (Stop loss: N/A).
AUD/USD:
Weekly gain/loss: – 121 pips
Weekly closing price: 0.7454
Weekly opening price: 0.7460
Weekly view: Weekly resistance at 0.7604 once again played a big part in last week’s trading. The commodity-linked currency sold off beautifully from this line and came within four pips of connecting with the top-side of a weekly support area registered at 0.7438-0.7315. This zone is rather large so there’s a chance that price may dive a little lower before we see the bulls make an appearance.
Daily view: As things stand on the daily chart, however, the major ended the week closing below a daily channel support line extended from the low 0.7148, but was able to remain within the daily support area coming in at 0.7517-0.7451. Therefore, until price either closes below the aforementioned daily support area or closes back within the above said daily channel, we have little direction coming in from this timeframe.
H4 view: Looking at Friday’s action, we can see that the Aussie sold off from the underside of 0.75 and reached the H4 mid-way support level 0.7450 by the US open. Given that this number merges with a mid-range H4 Quasimodo support at 0.7446 and a H4 61.8% Fib support at 0.7444, it is no surprise to see price holding above this area.
Direction for the week: Ultimately, there’s a good chance that price will likely rally sometime this week given the weekly support area. However, as we mentioned above, this depends on where the next daily candle closes.
Direction for today: North. In view of the confluence seen around the H4 mid-way support 0.7450, a rally up to at least the 0.75 handle is likely on the cards today.
Our suggestions: Until we see a decisive daily close, there will be no trades taken on this pair. We need the daily close to judge direction and without it we feel we’re doing nothing more than gambling.
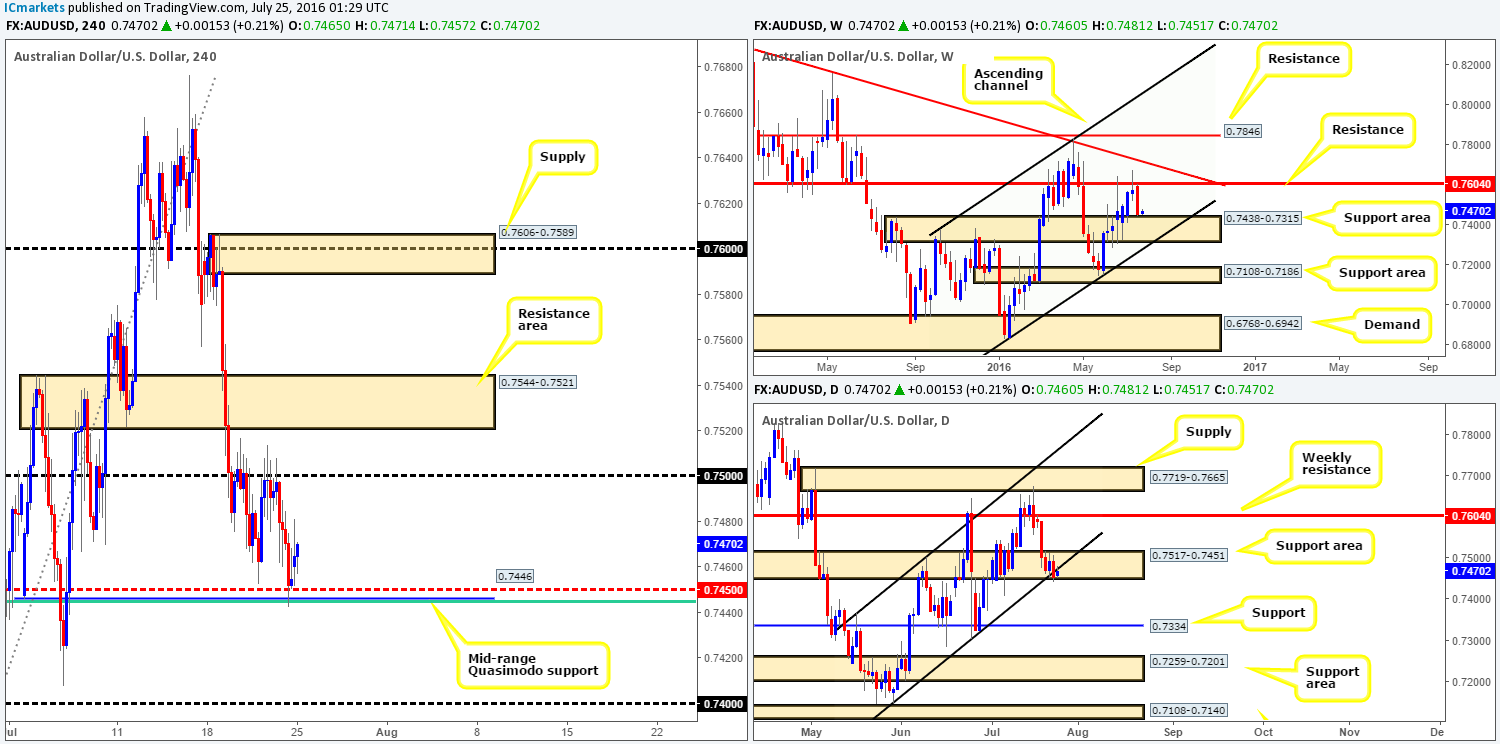
Levels to watch/live orders:
- Buys: Flat (Stop loss: N/A).
- Sells: Flat (Stop loss: N/A).
USDJPY:
Weekly gain/loss: + 121 pips
Weekly closing price: 106.01
Weekly opening price: 106.11
Weekly view: Following a rather aggressive move higher two weeks ago, the USD/JPY formed a weekly bearish selling wick last week within the confines of a weekly resistance area at 105.19-107.54. Should the bears follow-through this week, we may see price plug into weekly support at 103.22. A break above the current weekly resistance zone, however, may open the gates for price to challenge weekly supply penciled in at 113.80-111.59.
Daily view: In conjunction with weekly price, the daily chart also shows that the safe-haven pair remains trading around a daily resistance area penciled in at 106.81-106.22. Providing that offers hold firm here, we feel this week’s movement may check in with the daily support area seen below at 103.50-103.89 (sits thirty or so pips above the aforementioned weekly support level).
H4 view: A brief look at recent trading on the H4 chart shows that price bottomed out around the 105.70 area on Friday and attacked a H4 resistance area at 106.25-106.00 going into the close. Shortly after the markets opened this morning, however, the bulls dug in deep and marched higher, consequently swallowing the above said H4 resistance zone (now acting support) and reaching highs of 106.72 so far.
Direction for the week: As far as higher timeframe structure is concerned, there is a good chance that this market may chalk up a bearish close this week, potentially pushing prices down to the above said daily support area.
Direction for today: is likely south. Although the bulls started the week strongly, the H4 supply seen above at 107.26-106.86 which envelopes around the 107 handle will likely suppress buying should it be tagged today. If price fails to reach this area, nevertheless, a close beyond the current H4 support area could be something to keep an eye out for. The H4 tail at 105.77 marked with a black arrow represents what we believe to be demand consumption. Therefore, the path beyond the current H4 support appears free down to 105.04 – a mid-range H4 Quasimodo support.
Our suggestions: To trade the H4 supply one could potentially try for a market short here with their stops above the H4 supply. As upper edge of this H4 supply is located a reasonable distance above the 107 handle, any fakeout seen through this round number will not likely trigger your stop.
Should price close beyond the current H4 support area, we would, however, want to see a subsequent retest followed by a lower timeframe sell signal (see the top of this report), before we could look to enter short from here. The reason being is the 106.25-106.00 H4 area, although it has been stable, it has been breached on a number of occasions.
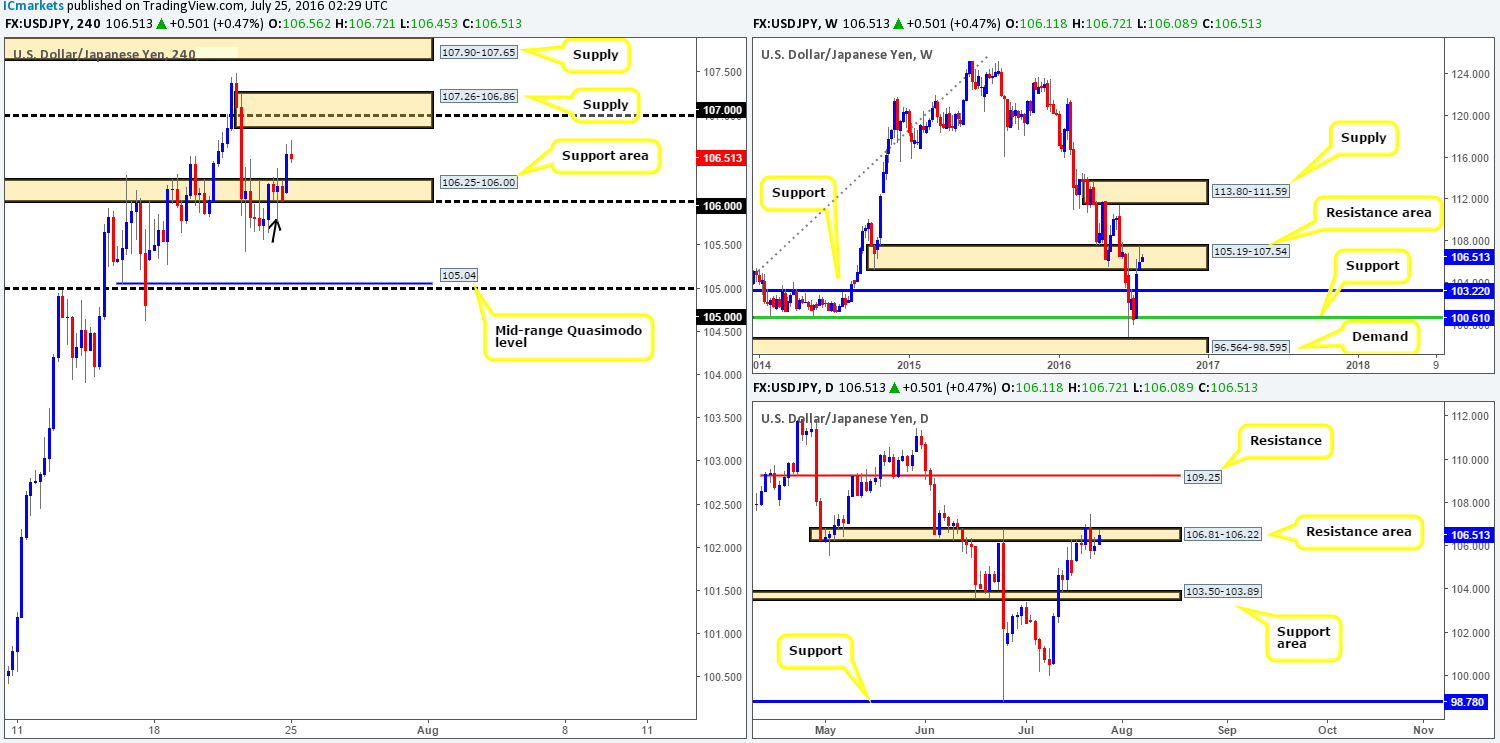
Levels to watch/live orders:
- Buys: Flat (Stop loss: N/A).
- Sells: 107.26-106.86 [Tentative – confirmation required] (Stop loss: dependent on where one confirms this area). Watch for price to close below the H4 support area at 106.25-106.00 and look to trade any retest seen thereafter (lower timeframe confirmation required).
USD/CAD:
Weekly gain/loss: + 161 pips
Weekly closing price: 1.3122
Weekly opening price: 1.3122
Weekly view: For the past five weeks, the USD/CAD pair has been seen clinging to the underside of a weekly supply base drawn from 1.3295-1.3017. It was only last week did we see the pair close higher within this area! While this is not a good sign for sellers at this supply zone, the buyers still have their work cut out for them if they wish to push this pair higher this week! In the event that the bears do stage a comeback, the next downside target can be seen at a weekly trendline support extended from the high 1.1278, which coincides with a weekly 38.2% Fib support at 1.2661 (taken from the low 0.9406). Meanwhile, directly above the current supply a weekly resistance line at 1.3381 is seen.
Daily view: With weekly action firmly lodged within supply at the moment, daily price is also seen trading within supply drawn from 1.3218-1.3086 (lodged within the current weekly supply base). This supply has certainly stood the test of time, capping upside in this market since May. In addition to this, Friday’s candle struck a minor daily channel resistance line extended from the high 1.3098, which, as you can see, has so far held firm. The next downside target from here is the daily channel support taken from the low 1.2831 (fuses nicely with two daily trendlines drawn in from the low 1.2460).
H4 view: For those who read our previous report on the USD/CAD pair you may recall us mentioning that we would have considered (dependent on the time of day) shorting the H4 Quasimodo resistance line at 1.3173 given its position in the higher timeframe picture. Unfortunately we missed this move entirely, so well done to any of our readers who managed to jump aboard this one!
Direction for the week: according to the higher timeframes (see above), is likely to be south. Therefore, for those who are considering entering long, it might be worth noting this down.
Direction for today: is also likely to be south given the reaction seen off of the aforementioned H4 Quasimodo resistance line. Be that as it may, we would not suggest entering short until the 1.31 handle has been consumed. Beyond this number, the H4 tail marked with a black arrow at 1.3055 represents what we believe to be demand consumption, potentially leaving the runway free down to H4 demand at 1.3013-1.3029, followed closely by the key figure 1.30.
Our suggestions: We would not recommend selling the breakout below 1.31 until price has retested this number as resistance and held firm. It would, in light of the higher timeframe structure, likely be sufficient enough to sell this market at that point. However, if you want a bit of extra confirmation, one could wait for a lower timeframe sell signal following the retest (see the top of this report for a list of lower timeframe entry techniques).
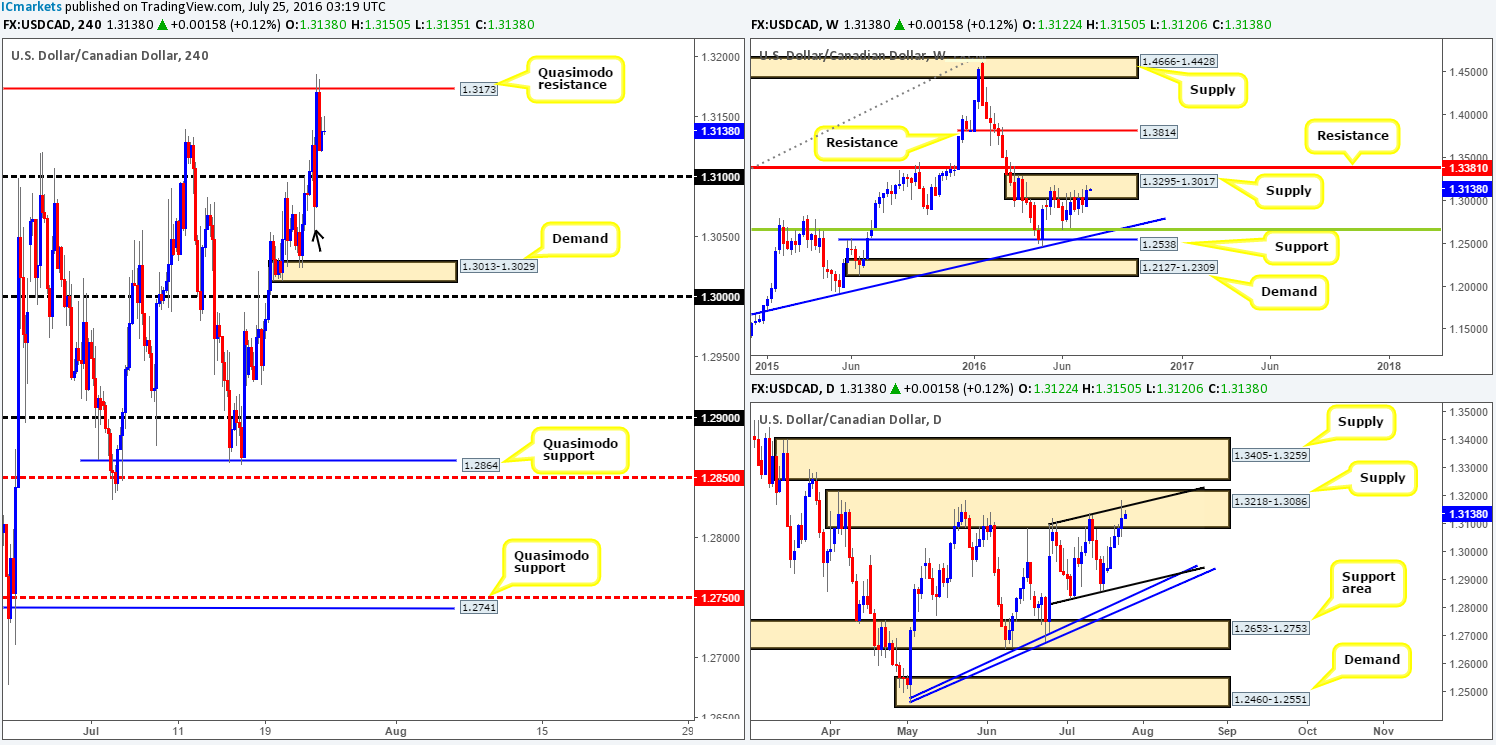
Levels to watch/live orders:
- Buys: Flat (Stop loss: N/A).
- Sells: Watch for price to close below the 1.31 handle and look to trade any retest seen thereafter (lower timeframe confirmation required).


