
Key risk events today:
ECB President Lagarde Speaks.
(Previous analysis as well as outside sources – italics).
EUR/USD:
Weekly gain/loss: +0.79%
Weekly close: 1.2170
Weekly perspective:
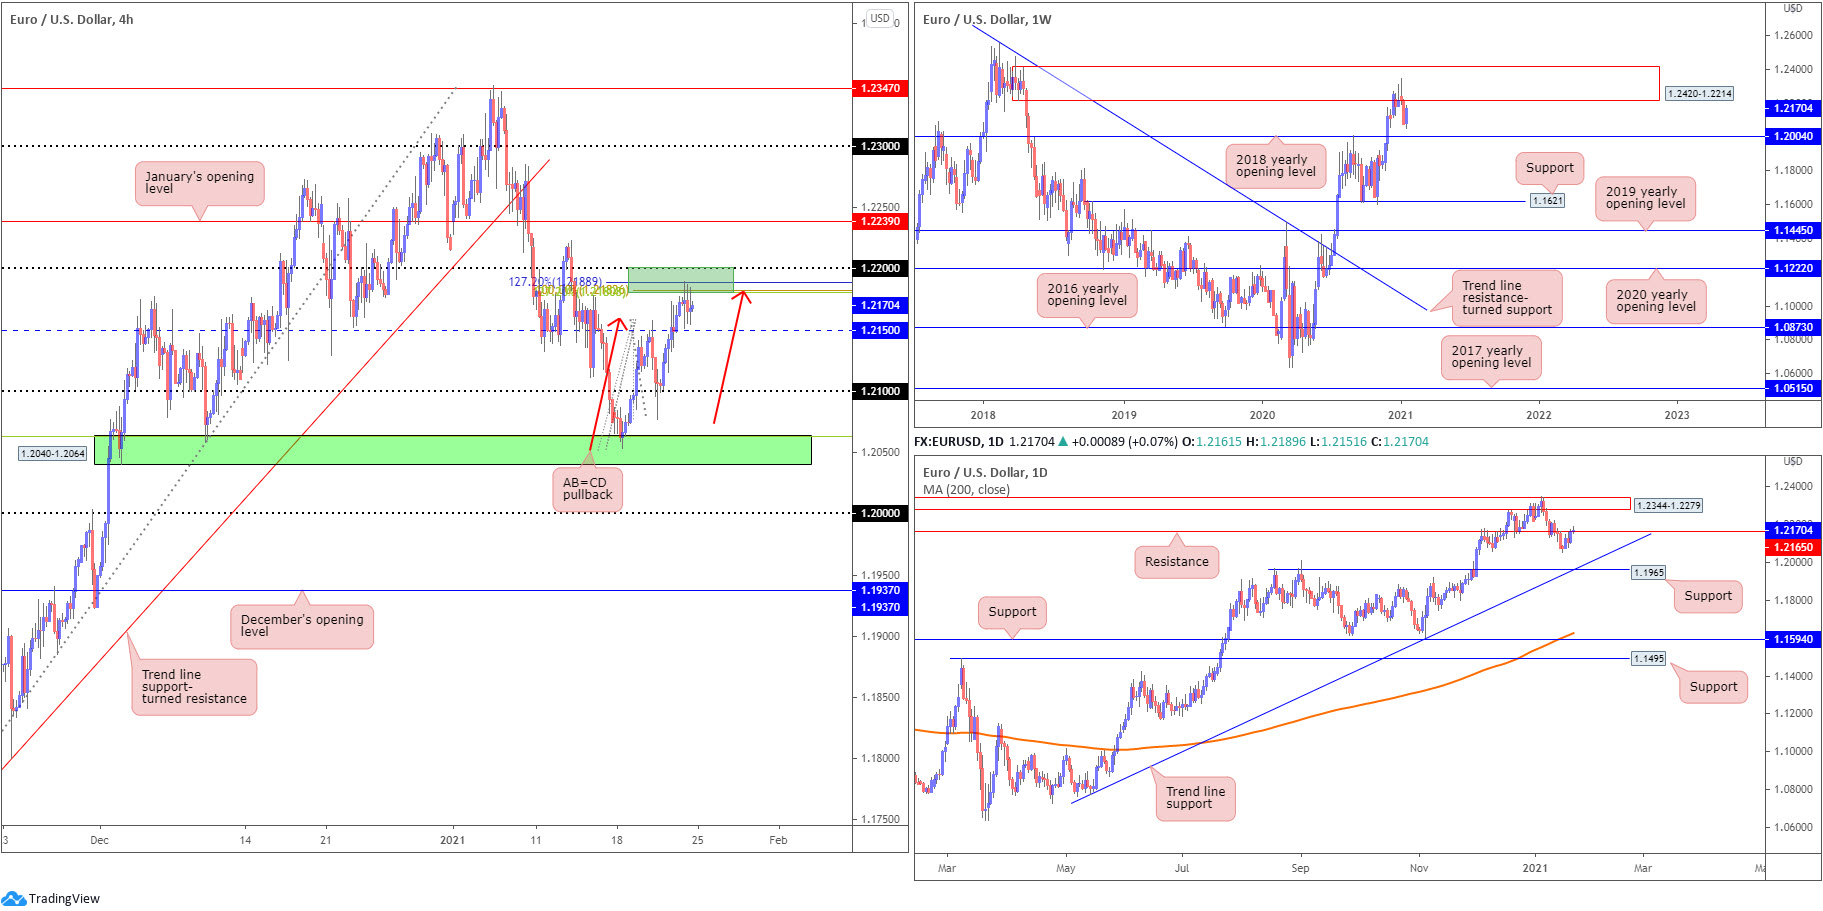
Supply at 1.2420-1.2214 remains in focus. This, as you can probably see, is an area boasting healthy downside momentum out of its base.
The 2018 yearly opening value at 1.2004 is in the crosshairs as potential support, should sellers make an appearance this week.
In terms of trend, upside has remained favoured since price bottomed at 1.0637 in March 2020 and overthrew trend line resistance, extended from the high 1.2555. For that reason, long-term dip-buyers could surface from 1.2004 if tested.
Daily perspective:
Buying somewhat stalled last week after shaking hands with resistance at 1.2165—an active S/R level since June 2010. Should this level give way this week, supply drawn from 1.2344-1.2279 (nestled within the walls of weekly supply mentioned above at 1.2420-1.2214) could work its way back into the spotlight
Lower on the curve, however, trend line support, taken from the low 1.0774, is seen—plotted just north of support at 1.1965, a previous Quasimodo resistance level.
H4 perspective:
In terms of risk events Friday, the less-than-stellar French flash prelim services PMI print was countered by less contraction in Germany. Out of the US, flash manufacturing and services PMIs released better-than-expected figures.
On the technical front, resistance at 1.2150 surrendered and permitted a test of an interesting resistance zone between 1.22 and 1.2180 (composed of the 1.22 figure, a collection of Fibonacci ratios and an AB=CD bearish formation [red arrows]). Technically speaking, 1.22/1.2180 emphasises confluence, suggesting a break back beneath 1.2150 could be on the cards this week, consequently positioning 1.21 in the line of fire.
Areas of consideration:
- While H4 resistance at 1.22/1.2180 could be sufficient to overpower buying and take the currency pair under 1.2150, the 1.22 figure may also call for a test, having seen the level situated just south of weekly supply at 2420-1.2214. Therefore, 1.2214/1.22 is also an area to be watchful of this week.
- Should H4 close sub 1.2150, a short-term bearish scenario could take shape, targeting at least 1.21.
GBP/USD:
Weekly gain/loss: +0.71%
Weekly close: 1.3672
Weekly perspective:
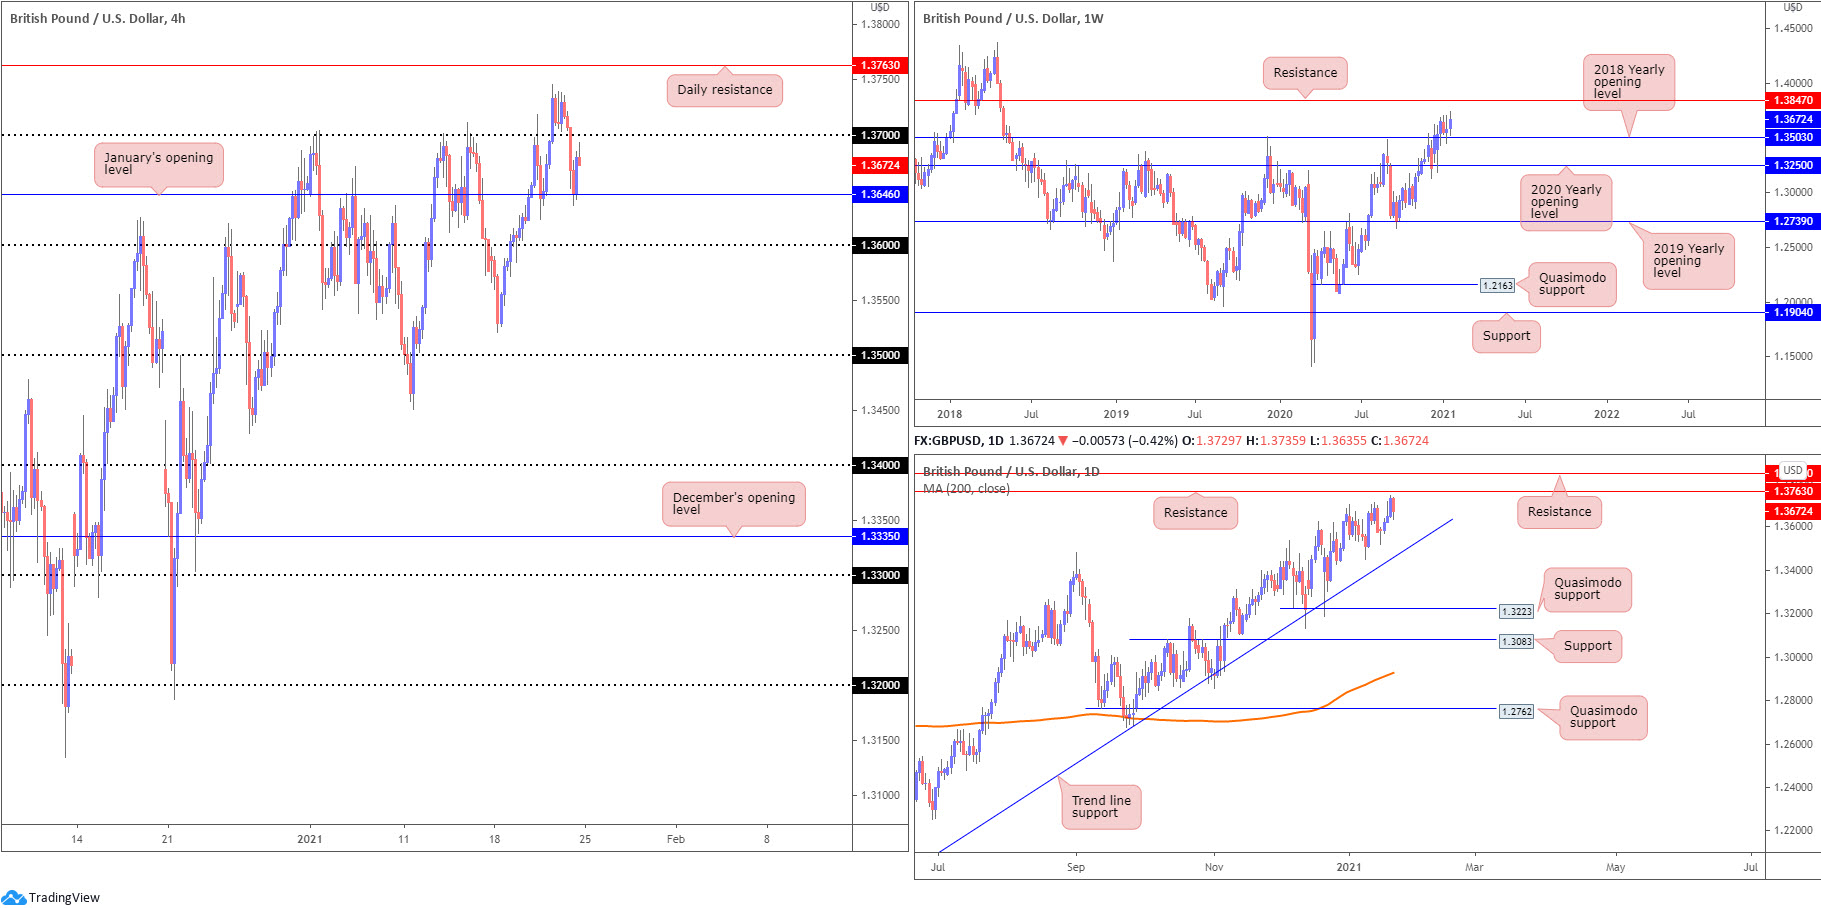
Clocking a fresh 33-month peak at 1.3745, GBP/USD bulls went on the offensive last week and registered a solid position north of 1.3503—the 2018 yearly opening value. In a market trending higher since early 2020, this lands long-term buyers in a favourable position, targeting resistance at 1.3847.
As highlighted in previous weekly reports, of technical interest is the recent engulf of 1.3514 (December 9 [2019] high), helping to confirm the current uptrend.
Daily perspective:
Buyers and sellers ended the week battling for position just south of a resistance level at 1.3763, a previous Quasimodo support level.
Trend line support, taken from the low 1.1409, is a visible downside target; breaking 1.3763, on the other hand, directs attention to resistance at 1.3845, another previous Quasimodo support-turned resistance.
H4 perspective:
Lower-than-expected UK retail sales data (0.3% vs. expected 1.4%) guided GBP/USD lower in early hours Friday. Despite a mild pullback, sellers took the reins once again after a more acute-than-anticipated fall in flash UK services PMI (38.8 against 45.2 consensus).
The day concluded off session lows, aided by January’s opening value at 1.3646 and in line with the DXY fading session highs at 90.30.
1.37 is seen overhead, with a break likely to attempt to refresh 2021 tops and reach daily resistance mentioned above at 1.3763.
Areas of consideration:
- Weekly support at 1.3503 holding (2018 yearly opening value) and price recently registering fresh 2021 peaks, in a market clearly trending higher, places long-term buyers in a favourable position this week. With reference to resistance, the daily timeframe shows price may have trouble at 1.3763, though a break signals weekly resistance at 1.3847 is likely on the radar, located close by daily resistance at 1.3845.
- The above may trigger intraday breakout buying north of 1.37 early week, targeting daily resistance at 1.3763. Conservative players (H4) are likely to seek at least a retest at 1.37 before pulling the trigger.
AUD/USD:
Weekly gain/loss: +0.13%
Weekly close: 0.7711
Weekly perspective:
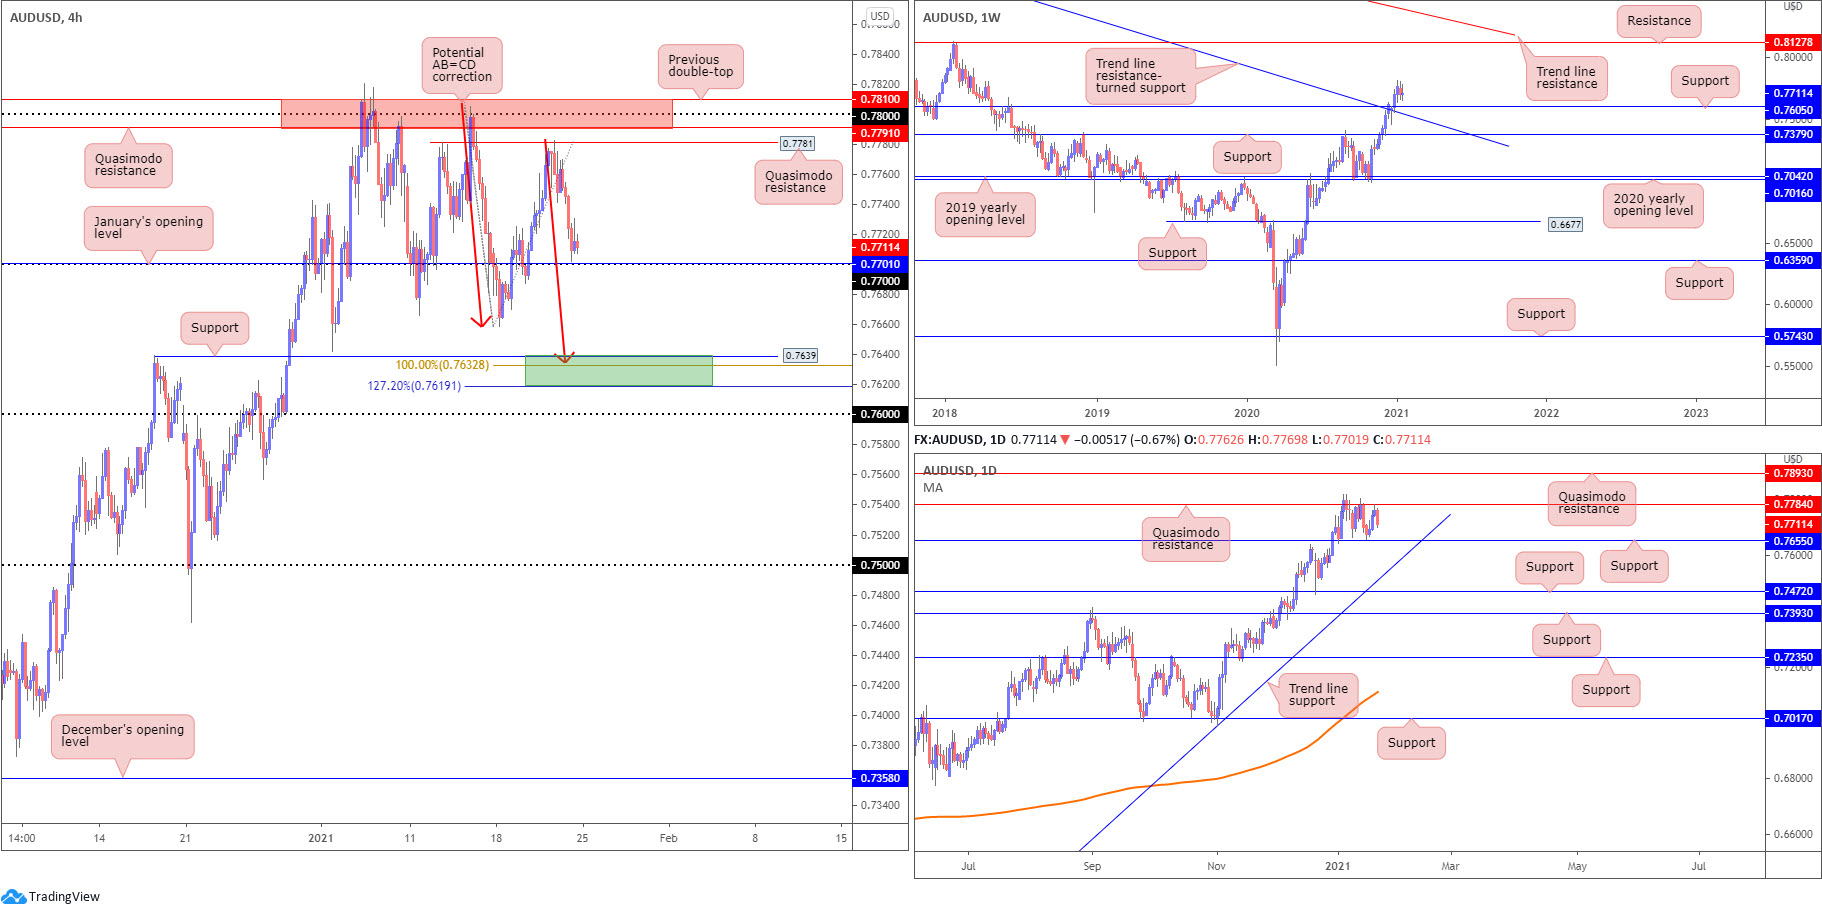
Following the break of Quasimodo resistance at 0.7605 (now serving as support), and trend line resistance, taken from the high 1.1080, volatility has diminished throughout January.
The lack of volatility could simply be the market taking a breather before extending the current uptrend towards resistance at 0.8127. However, a retest at 0.7605 may form prior to buyers making an appearance.
Daily perspective
One of the technical factors behind the lack of volatility is price ranging between Quasimodo resistance forged at 0.7784 and support coming in at 0.7655. Another level worth noting is trend line support, etched from the low 0.5506.
Should buyers eventually strengthen their grip and take on 0.7784, another Quasimodo resistance is registered at 0.7893.
H4 perspective:
Snapping a three-day winning streak, buyers stepped aside on Friday amid a turnaround in risk sentiment. This extended the retracement slide south of Quasimodo resistance at 0.7781 (plotted beneath H4 resistance between 0.7810 and 0.7791), and landed candle action within touching distance of the 0.77 figure and January’s opening value at 0.7701.
Below 0.77 elbows support at 0.7619-0.7639 into view, made up of two Fibonacci ratios and a support level (green area). In addition, this area contains an AB=CD termination point (red arrows) and also boasts a reasonably close connection with daily support at 0.7655.
Just beneath 0.7619-0.7639, traders also have the 0.76 figure to work with—merges with weekly support at 0.7605.
Areas of consideration:
- The trend has remained firmly higher since early 2020. Additionally, the weekly timeframe shows price has room to reach as far north as resistance at 0.8127 (and the daily timeframe, beyond Quasimodo resistance at 0.7784, to around 0.7893 [another Quasimodo resistance]).
- Aside from January’s opening value at 0.7701, the 0.77 figure on the H4 has limited technical confluence, therefore could be fragile.
- H4 support at 0.7619-0.7639 might interest buyers this week, having seen daily support positioned just north of the base at 0.7655.
- 76 is also a featured level on the H4 this week, owing to weekly support at 0.7605.
USD/JPY:
Weekly gain/loss: -0.11%
Weekly close: 103.70
Weekly perspective:
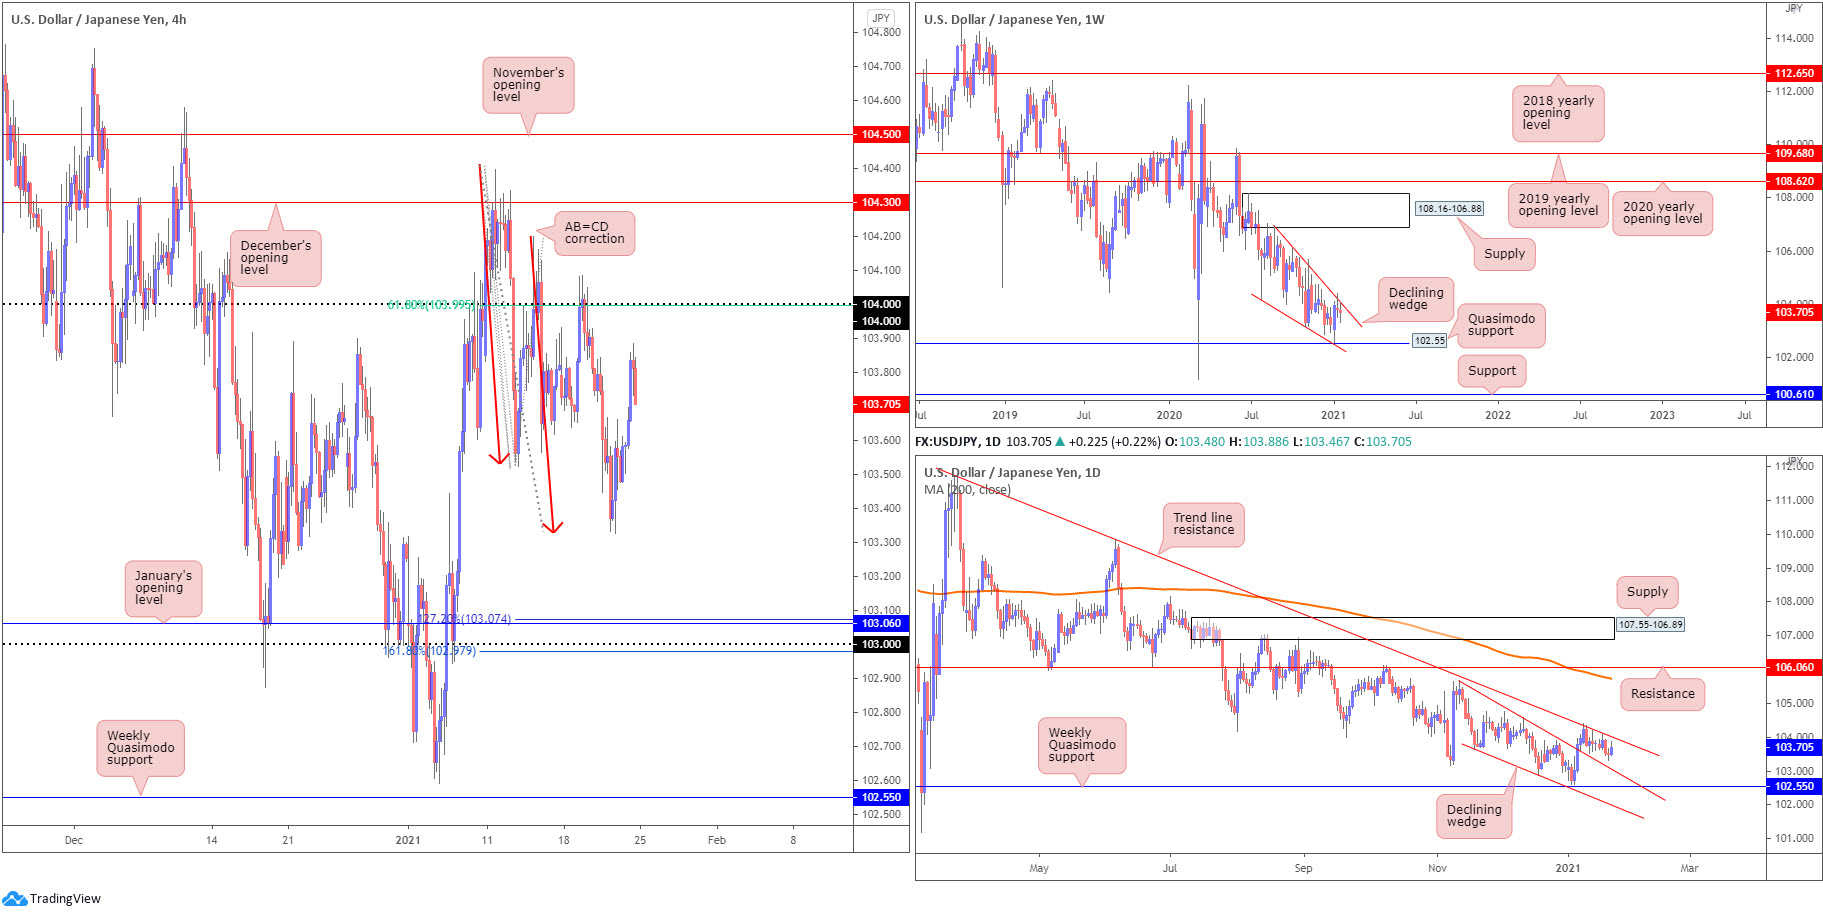
Since connecting with the underside of supply at 108.16-106.88 in August (2020), price has gradually shifted lower and developed a declining wedge (106.94/104.18).
Price recently shook hands with the upper edge of the declining wedge pattern and formed two consecutive indecision candles. A breakout higher, according to the pattern’s location, would be interpreted as a bullish breakout signal.
Be that as it may, Quasimodo support at 102.55 could re-enter the fight should sellers make their presence felt. Beneath 102.55, support calls at 100.61, a level in play since 2013.
Daily perspective:
Action out of the daily timeframe, since mid-January, has been testing the grip of trend line resistance, extended from the high 111.71. Breaking higher shines the spotlight on the 200-day SMA (orange-105.73), followed by resistance at 106.06.
Traders may also acknowledge the aforementioned trend line converges with the upper edge of the weekly declining wedge.
Downside support resides around the upper boundary of a recently penetrated declining wedge, taken from the high 105.67.
H4 perspective:
Underpinned by a USD bid Friday, USD/JPY gained traction and threw 104 back in the mix as possible resistance this week (merging with a 61.8% Fibonacci retracement ratio). This followed Thursday’s recovery from AB=CD support at 103.32 (red arrows). Below this level, an area that may be worth monitoring is between 102.97-103.07 (January’s opening value at 103.06, the 103 figure, a 127.2% Fibonacci extension point at 103.07 and a 161.8% Fibonacci projection point at 102.97), a base also converging with the upper edge of the declining wedge on the daily timeframe.
Areas of consideration:
- The upper edge of the weekly declining wedge (106.94/104.18)—fuses with daily trend line resistance, extended from the high 111.71. A breakout beyond these two barriers could be meaningful.
- 104 is likely to be on the watchlists for sellers early week, particularly as the level merges with a 61.8% Fibonacci retracement ratio.
- The upper boundary of the penetrated declining wedge on the daily timeframe, along with January’s opening value at 103.06 and the 103 figure (H4), is an area to be mindful of this week (together with nearby Fibonacci studies).
USD/CAD:
Weekly gain/loss: -0.05%
Weekly close: 1.2730
Weekly perspective:
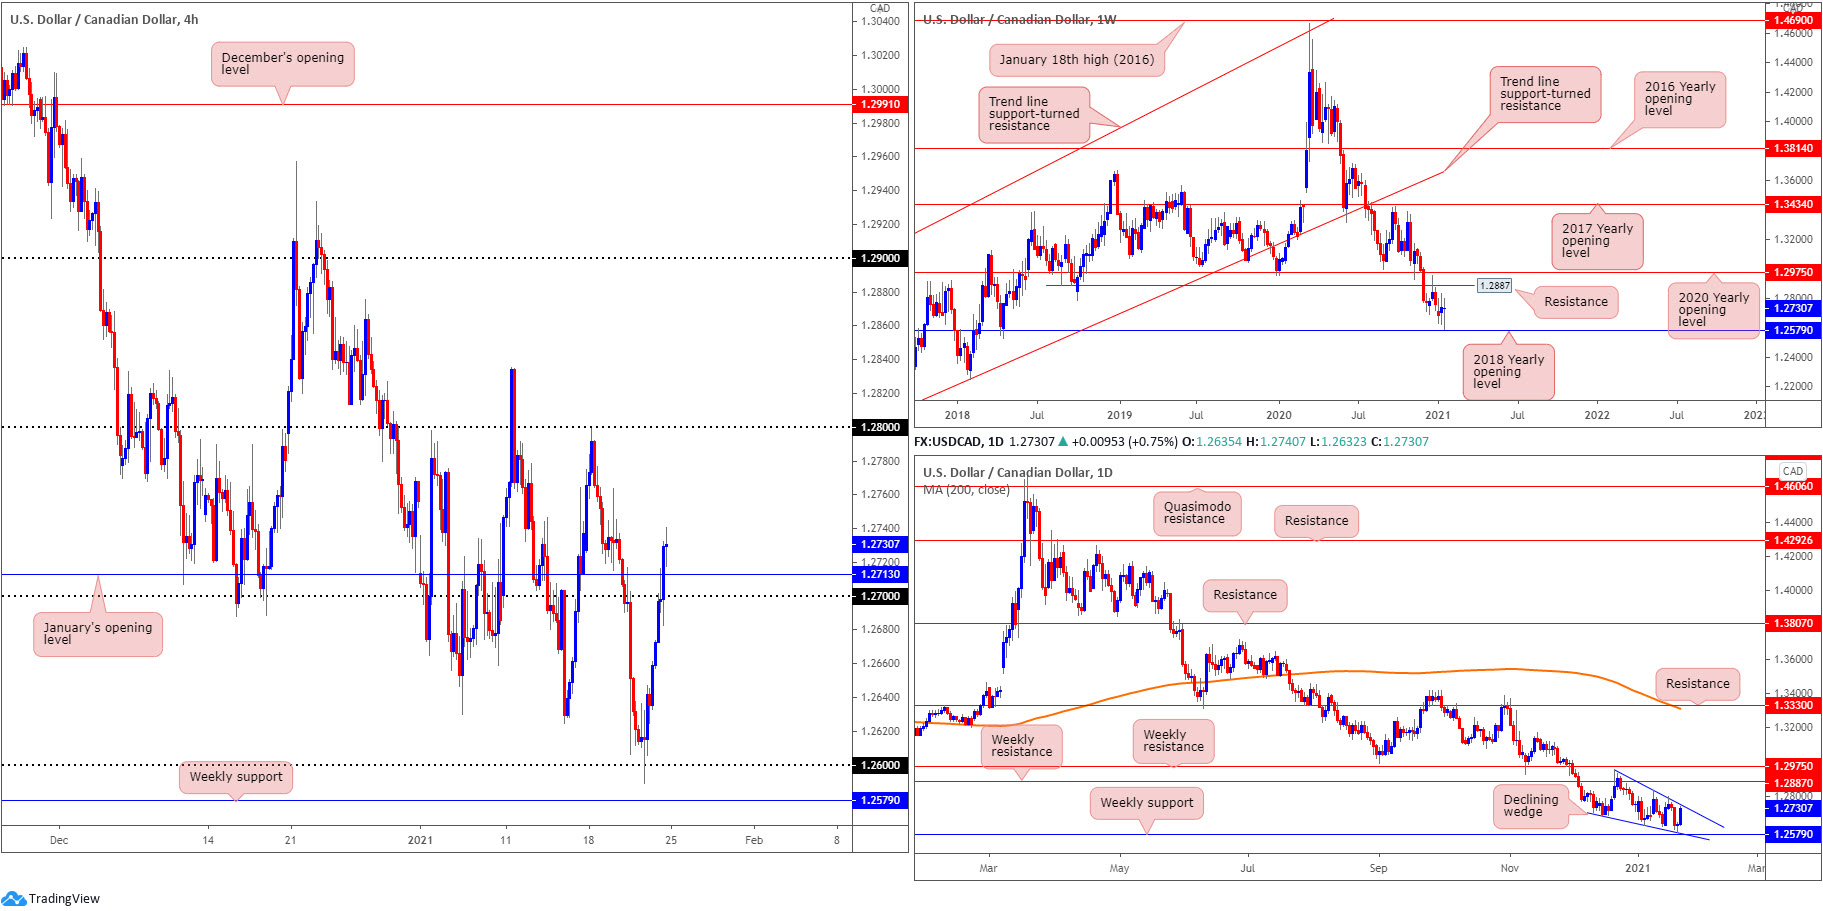
In the shape of three back-to-back long-legged doji candles, price is seen hovering just north of the 2018 yearly opening value at 1.2579, following the retest of resistance at 1.2887 in late December, a previous Quasimodo support level.
It is important to note long-term flow (trend) has been pointing lower since topping in March (2020).
Daily perspective:
Aside from the declining wedge forming on the daily timeframe (1.2957/1.2688), technical structure pretty much resembles that of the weekly timeframe: weekly resistance at 1.2887 and weekly support at 1.2579.
H4 perspective:
WTI prices clocking lows at $51.46 a barrel, along with the DXY posting gains, led USD/CAD strongly higher on Friday.
Extending Thursday’s 1.26 recovery, H4 brushed aside the 1.27 figure and January’s opening value from 1.2713. Likely considered a bullish indicator for short-term flow, the 1.28 figure is seen overhead this week as potential resistance.
However, to reach 1.28, a break of the daily timeframe’s declining wedge must be seen.
Areas of consideration:
- In a market trending lower since March 2020, the 2018 yearly opening value at 1.2579 is a weekly support level that may enter the fray this week.
- On the daily timeframe, the declining wedge is a pattern worth monitoring, forming in between the weekly support and resistance levels mentioned above. A breakout to the upside is considered a reversal signal, given its formation within a downtrend.
- 27 and January’s opening value at 1.2713 offer possible support for dip-buyers to work with in early trading this week, targeting the upper edge of the daily timeframe’s declining wedge, followed by the 1.28 figure on the H4.
USD/CHF:
Weekly gain/loss: -0.70%
Weekly close: 0.8849
Weekly perspective:
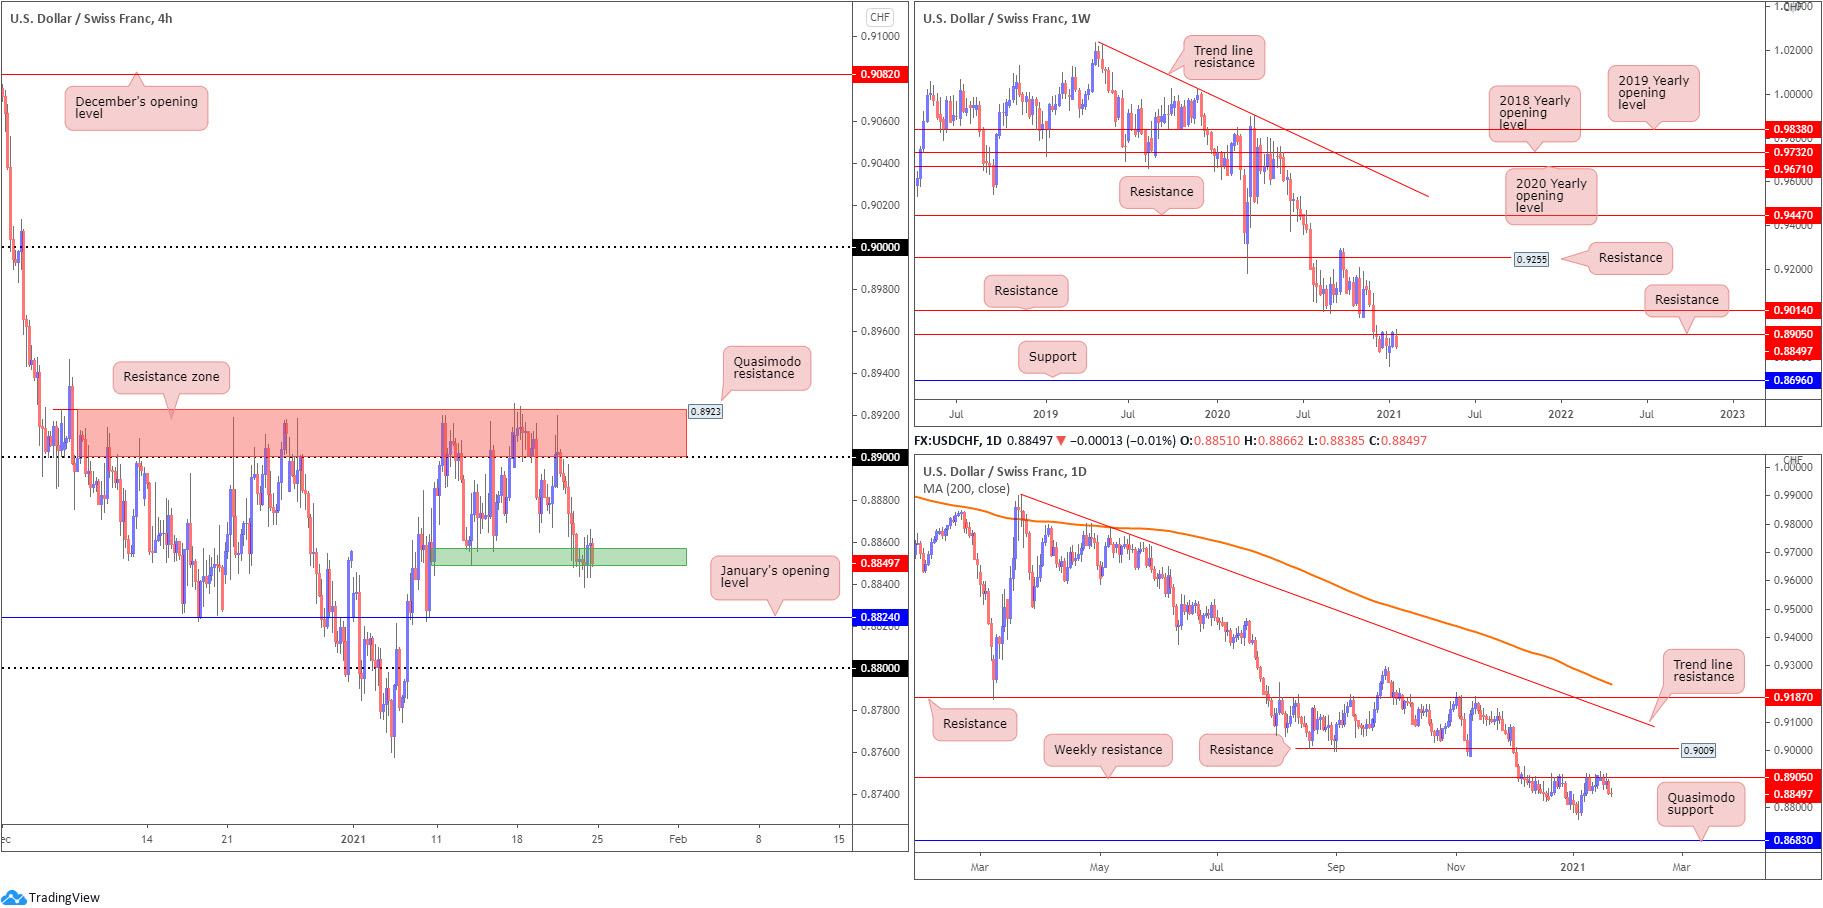
The weekly timeframe shows not only has USD/CHF been entrenched within a downtrend since May 2019, the pair also remains loitering at the underside of resistance drawn from 0.8905.
Because of this, sellers could maintain control in the coming weeks.
Support on the weekly timeframe is not expected to make an appearance until 0.8696.
Daily perspective:
Similar to the weekly scale, the daily timeframe reveals weekly resistance at 0.8905 as a prominent base.
However, Quasimodo support at 0.8683 serves as the next downside target on the daily timeframe, situated a touch beneath weekly support at 0.8696.
H4 perspective:
Resistance marked between 0.8923 (Quasimodo resistance) and the 0.89 figure (red zone), as you can see, has capped upside since early December. Heading into the second half of last week, price movement retreated from 0.8923/0.89 and invaded the 0.8850 region (green), consequently shining some light on January’s opening value from 0.8824 and the 0.88 figure.
Areas of consideration:
- H4 resistance at 0.8923-0.89 remains prominent. Notably, this area is also connected with weekly resistance at 0.8905. This—coupled with a clear downtrend since April 2019—emphasises a technically bearish vibe. Downside targets this week on the H4 are seen at the 0.8850ish range (green), which is currently in play, closely followed by January’s opening value at 0.8824 and 0.88.
- Bearish scenarios may form should H4 close south of 0.8850. Although short-term downside targets rest between 0.8824 and 0.88, longer-term targets to be aware of are the multi-month troughs around 0.8757 (formed early January), with further selling to possibly take aim at weekly support drawn from 0.8696 and daily Quasimodo support at 0.8683.
Dow Jones Industrial Average:
Weekly gain/loss: +0.84%
Weekly close: 31,004
Weekly perspective:
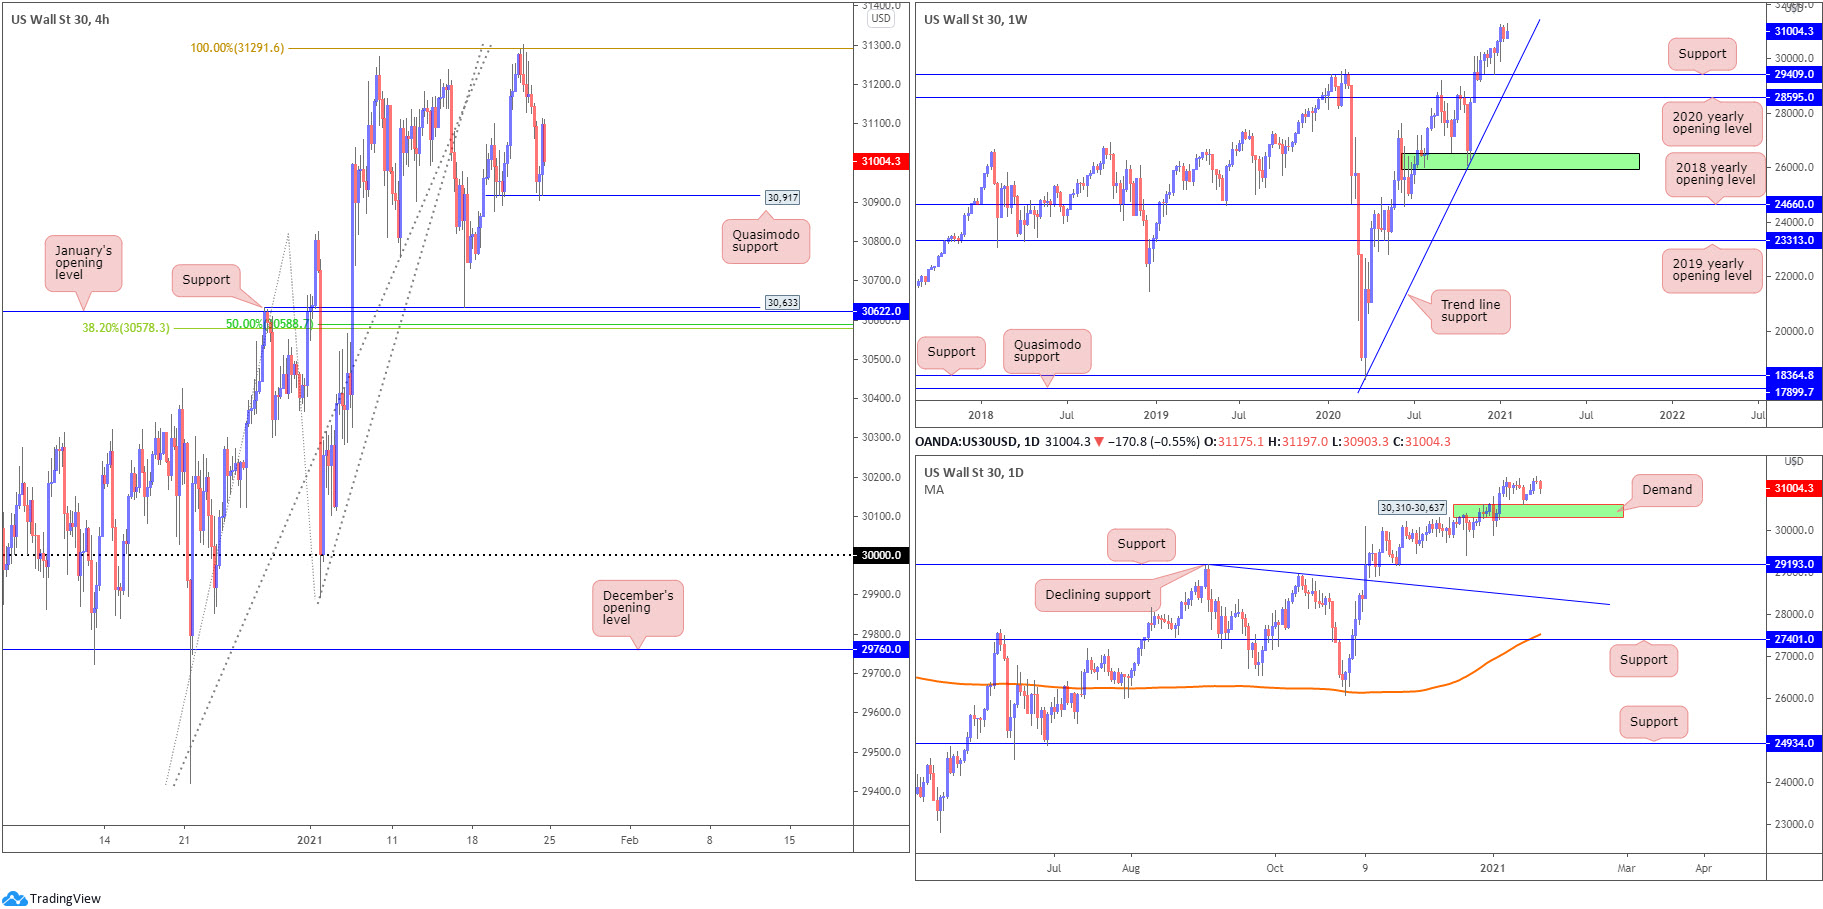
Price maintained a bullish tone last week and refreshed all-time peaks at 31,301.
As noted in previous analysis, the research team sees limited floor in sight until trend line support, extended from the low 18,213. Another nearby support to be aware of is 29,409, a previous Quasimodo resistance.
Note that steep trend lines tend to be fragile.
Daily perspective:
Demand at 30,310-30,637 has proven an effective range, sponsoring last week’s bullish assault.
Having seen Friday rotate lower, the aforementioned demand area could come under attack this week, shedding light on support at 29,193.
H4 perspective:
Despite US equities spinning lower Friday, major US equity benchmarks finished the week on strong footing. The Dow Jones Industrial Average fell 179.03 points Friday, or 0.57%; the S&P 500 dropped 11.60 points, or 0.30% while the Nasdaq rallied 12.15 points, or 0.09%
Quasimodo support at 30,917 made an appearance on Friday, following Thursday’s rejection off the 100% Fibonacci extension at 31,291. Renewed downside could see the technical pendulum swing in favour of testing support at 30,633, a previous Quasimodo resistance level, closely shadowed by January’s opening value at 30,622 and a 38.2% Fibonacci retracement ratio at 30,578 (and a 50.0% retracement ratio at 30,588).
Areas of consideration:
- Price action forged fresh all-time peaks at 31,301 last week, in a market trending decisively higher since the beginning of 2020.
- The weekly timeframe’s trend line support, extended from the low 18,213, is worth noting, though do be aware support at 29,409 could also enter the fight.
- Daily demand at 30,310-30,637 remains in the frame this week. Note this area also encases the H4 support area between 30,578 and 30,633.
- H4 Quasimodo support at 30,917 lacks local and higher timeframe confluence, therefore echoes a feeble tone.
- A H4 breakout above 31,291 may fuel a bullish breakout theme to refresh all-time peaks.
XAU/USD (GOLD):
Weekly gain/loss: +1.49%
Weekly close: $1,855
Weekly perspective:
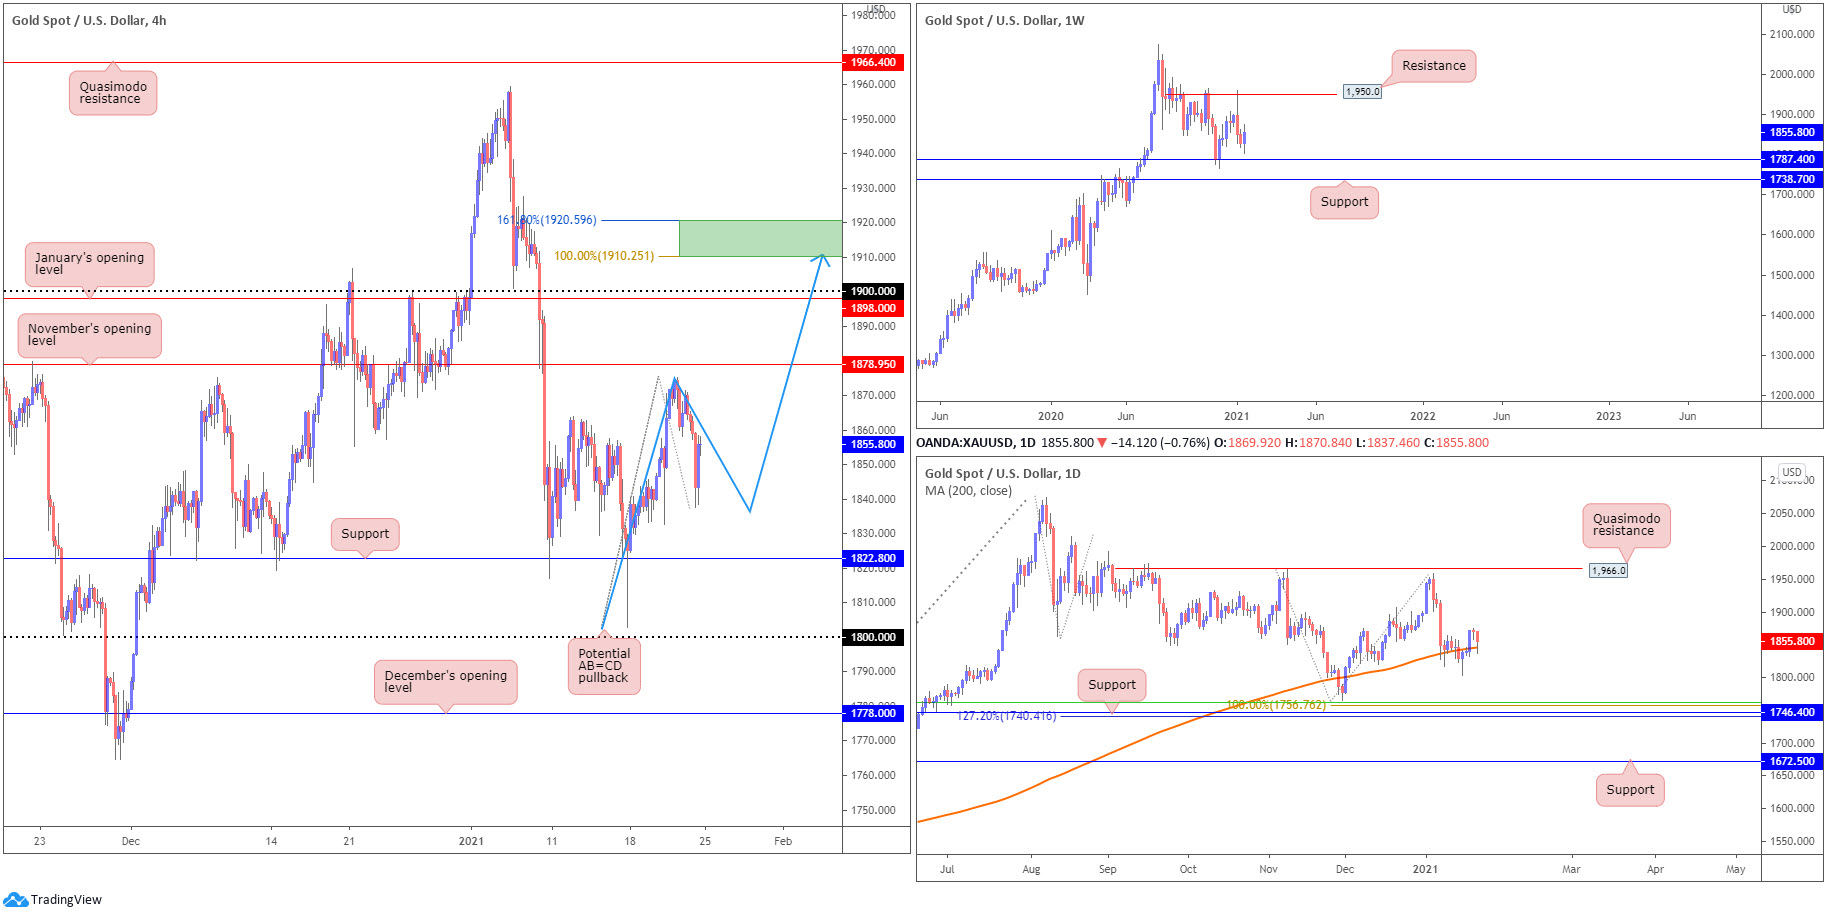
Snapping a two-week bearish phase, last week pencilled in a bullish outside reversal candle ahead of support at $1,787, set just north of another support at $1,738.
The next upside target is fixed at $1,950 resistance.
It is also important to note that in terms of trend we’ve been actively trending higher since early 2016.
Daily perspective:
In conjunction with the weekly timeframe’s bullish outside reversal candle, price action on the daily timeframe retested the upper edge of the 200-day SMA (orange – $1,845) last week. Besides the $1,959 high formed in early January, buyers could zero in on Quasimodo resistance taken from $1,966.
Beyond the noted SMA, support is arranged around $1,746, sited south of a 100% Fibonacci extension point at $1,756, a 50.0% retracement ratio at $1,762 and above a 127.2% Fibonacci extension point at $1,740.
H4 perspective:
Friday, as you can see, pencilled in a session low at $1,837 and put forward the possibility of an AB=CD pullback forming this week (blue arrows), terminating around $1,920/$1,910 (green—a 161.8% Fibonacci projection point and a 100% Fibonacci extension value). To reach this far north, however, buyers must overrun November’s opening value at $1,878, January’s opening value at $1,898 and the $1,900 figure.
Failure to sustain higher levels this week places support at $1,822 on the hit list, with a break underscoring $1,800.
Areas of consideration:
- The weekly timeframe, thanks to the bullish outside reversal candle, could see additional buyers enter the frame this week, aided by daily buyers off the 200-day SMA.
- Based on higher timeframe flow, H4 buyers may approach November’s opening value at $1,878 early week, though a dip to support at $1,822 is certainly not out of the question to collect fresh buyers.
- The H4 AB=CD pullback around $1,920 and $1,910 is an area sellers may watch this week. Although considered a high-probability pattern, higher timeframes pointing higher may limit selling pressure from the zone.
The accuracy, completeness and timeliness of the information contained on this site cannot be guaranteed. IC Markets does not warranty, guarantee or make any representations, or assume any liability regarding financial results based on the use of the information in the site.
News, views, opinions, recommendations and other information obtained from sources outside of www.icmarkets.com.au, used in this site are believed to be reliable, but we cannot guarantee their accuracy or completeness. All such information is subject to change at any time without notice. IC Markets assumes no responsibility for the content of any linked site.
The fact that such links may exist does not indicate approval or endorsement of any material contained on any linked site. IC Markets is not liable for any harm caused by the transmission, through accessing the services or information on this site, of a computer virus, or other computer code or programming device that might be used to access, delete, damage, disable, disrupt or otherwise impede in any manner, the operation of the site or of any user’s software, hardware, data or property.


