
EUR/USD:
Weekly gain/loss: +0.35%
Weekly close: 1.1330
Weekly perspective:
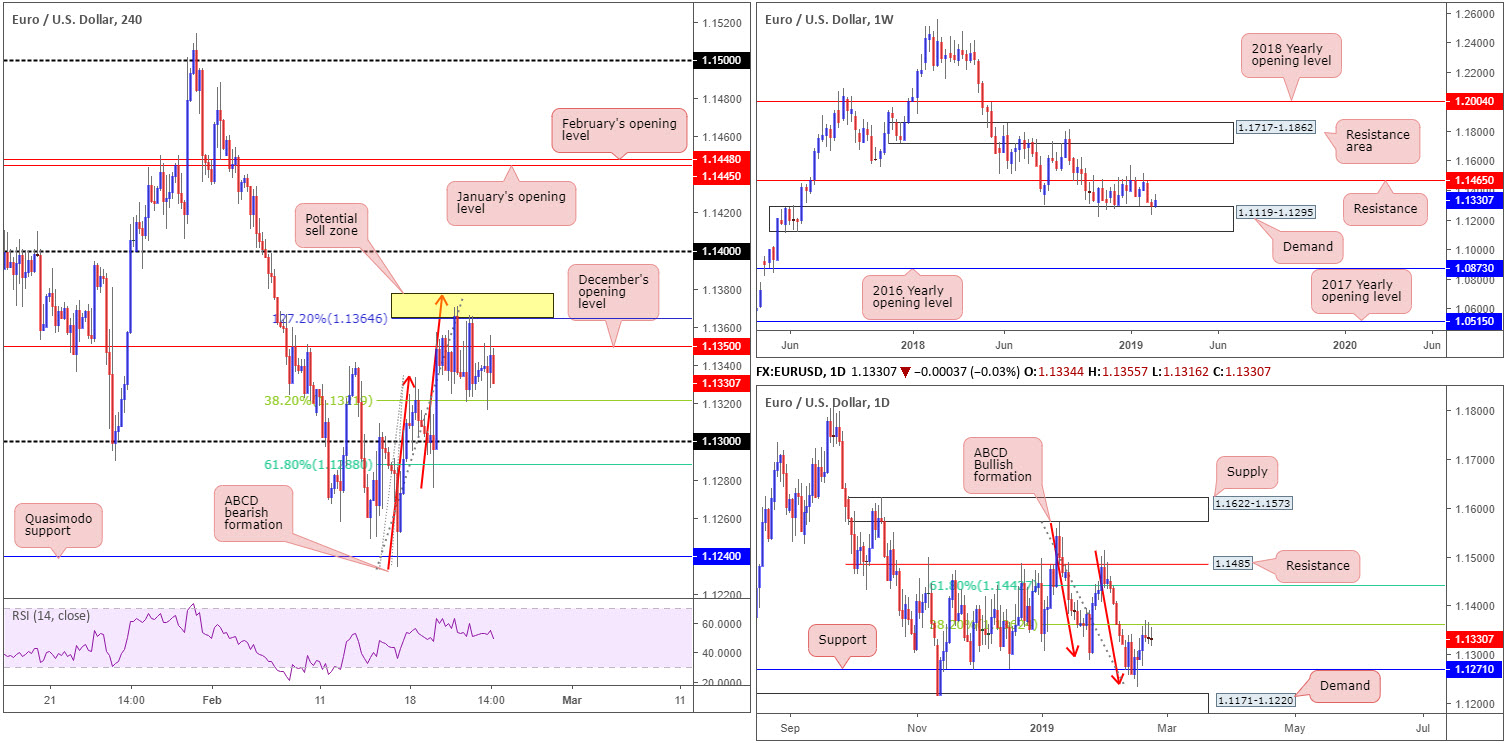
Since October 2018, the buyers and sellers have been battling for position between a long-standing support/resistance at 1.1465 and a notable demand area coming in at 1.1119-1.1295. As is evident from the chart, the week concluded responding from the lower edge of this consolidation; therefore further buying may take shape this week. Outside of these areas, zones on the radar fall in at a resistance area drawn from 1.1717-1.1862 and a 2016 yearly opening level at 1.0873.
Daily perspective:
Mid-week witnessed the pair enter a phase of indecision (albeit with a minor bias to the downside) off the underside of a 38.2% Fibonacci resistance value at 1.1362. This level, as highlighted in previous reports, is the first take-profit target for many traders long the daily ABCD bullish completion point (red arrows) around 1.1240.
Any sustained move above 1.1362 this week places the 61.8% Fibonacci resistance value at 1.1442 in the spotlight – considered the second take-profit target for traders long the aforementioned ABCD completion. A move lower, nonetheless, has support at 1.1271 in sight.
H4 perspective:
Worries in the German business world continued to grow Friday, following the ifo Business Climate Index falling from 99.3 points (seasonally adjusted) in January to 98.5 points in February. This is the lowest level since December 2014. Technically speaking, the H4 candles faded December’s opening level at 1.1350 after the said report, though staged a reasonably strong recovery into US hours from 1.1316.
By and large, though, H4 action remains capped by the yellow zone marked at 1.1377/1.1364: a H4 127.2% ABCD (red arrows) pattern and a 38.2% Fibonacci support value at 1.1322: measured as the first take-profit target for harmonic traders. Well done to any of our readers who managed to remain short this area throughout last week’s volatility, as 1.1377/1.1364 was a noted zone to watch in Wednesday’s piece for potential shorting opportunities.
Areas of consideration:
In a nutshell, the structure of this market can be boiled down to the following:
- Weekly flow shaking hands with demand at 1.1119-1.1295 – possible buying this week.
- Daily price resisting its first upside target at 1.1362 (converges with the 1.1377/1.1364 ABCD sell zone on H4) – possible selling this week.
- H4 action contained between an ABCD bearish completion at 1.1377/1.1364 and its first take-profit target (38.2% Fibonacci support) at 1.1322 – direction unclear.
Overall, the research team is marginally biased to the upside this week. The combination of weekly price striking demand and daily action showing room above 1.1362 towards its second take-profit target (from its ABCD support) at 1.1442.
Despite a possible rally emerging this week, buying based on H4 structure is challenging. Not only do we have 1.1377/1.1364 in play, we also have nearby 1.14 resistance to consider as well.
Today’s data points: FOMC Member Clarida Speaks.
GBP/USD:
Weekly gain/loss: +1.31%
Weekly close: 1.3053
Weekly perspective:
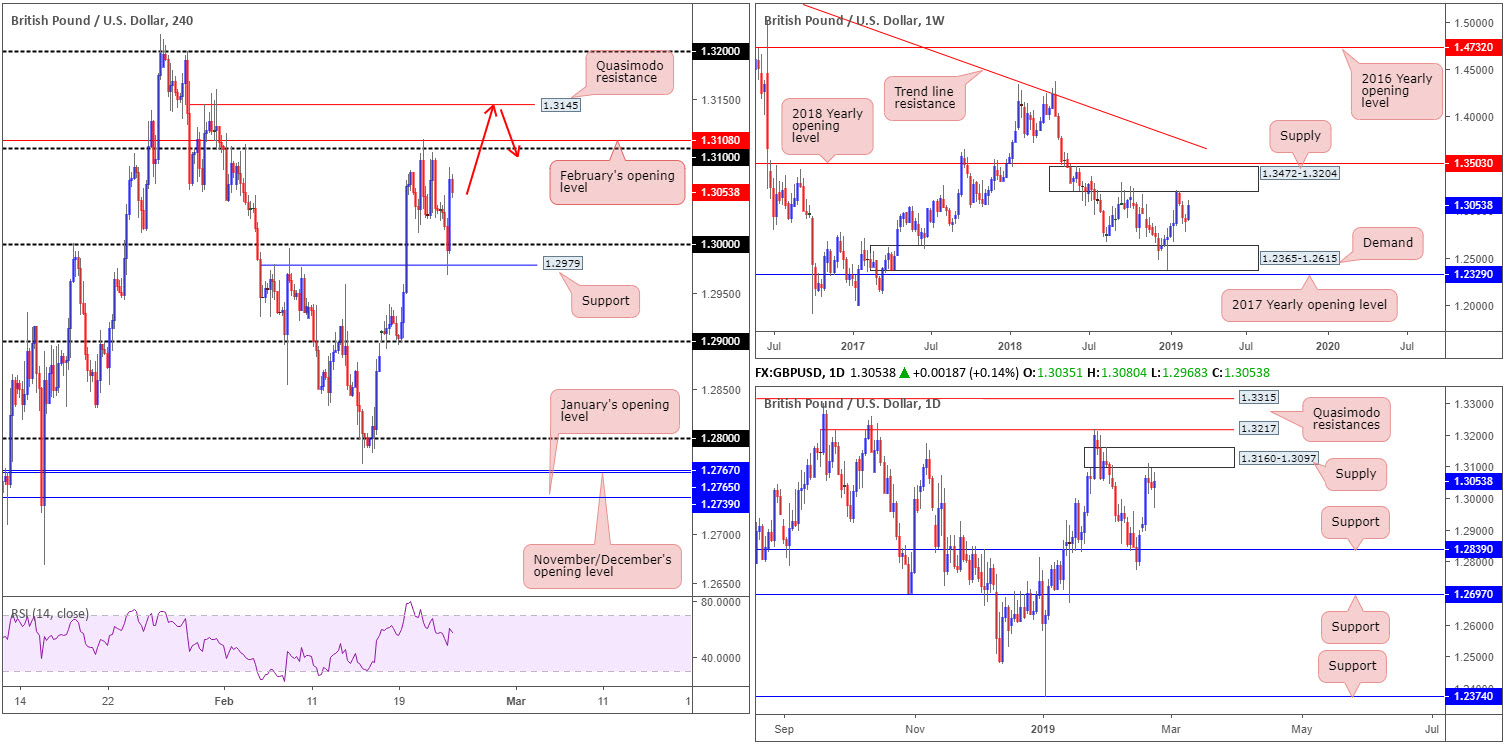
GBP/USD bulls entered an offensive phase last week, consequently shattering a three-day bearish run from the underside of supply at 1.3472-1.3204. In view of this, a retest of the said supply may develop this week, only this time a move higher within the zone is expected (in order to fill more extreme orders).
Daily perspective:
Supply at 1.3160-1.3097 elbowed its way into the mix Wednesday and held ground into the closing bell. Levels beyond this area are visible at 1.3315 and 1.3217, both Quasimodo resistances. To the downside from the noted supply, nevertheless, support at 1.2839 is in view.
H4 perspective:
A brief recap of price action on the H4 timeframe reveals the unit ran through orders at key figure 1.30 and brought in buyers from nearby support seen at 1.2979. By way of a strong H4 bull candle, price reclaimed 1.30+ status and reached highs of 1.3079 into the close. The primary driver behind this move, according to our team, was USD selling, which ended the week beneath its 96.50 mark (US dollar index).
The next port of call to the upside from current price is 1.31, shadowed closely by February’s opening level at 1.3108. It might also be worth pencilling in the Quasimodo resistance at 1.3145. All three of these zones are sited within the walls of the current daily supply area. Beyond 1.3145, we also have 1.32 in sight which is not only positioned 17 pips below daily Quasimodo resistance at 1.3217, it marks the underside of weekly supply at 1.3204.
Areas of consideration:
On account of the above technical reading, the research team feel sellers may enter the fray this week.
A short from the H4 Quasimodo resistance at 1.3145 is appealing. Not only is it located within the upper boundary of the current daily supply, the level may be used to help facilitate a fakeout (or stop run) above 1.31 this week (red arrows – round numbers attract a huge amount of orders).
Failing a response from 1.3145, the 1.32 handle is the next logical barrier for shorts given its connection with weekly supply mentioned above at 1.3472-1.3204.
For conservative traders wishing to add a little more confirmation to the mix from either 1.3145 or 1.32, waiting for an additional bearish candlestick signal to emerge on either the H1 or H4 is an option (entry/stop parameters can be defined according to this structure).
Today’s data points: BoE Gov. Carney Speaks; FOMC Member Clarida Speaks.
AUD/USD:
Weekly gain/loss: -0.21%
Weekly close: 0.7124
Weekly perspective:
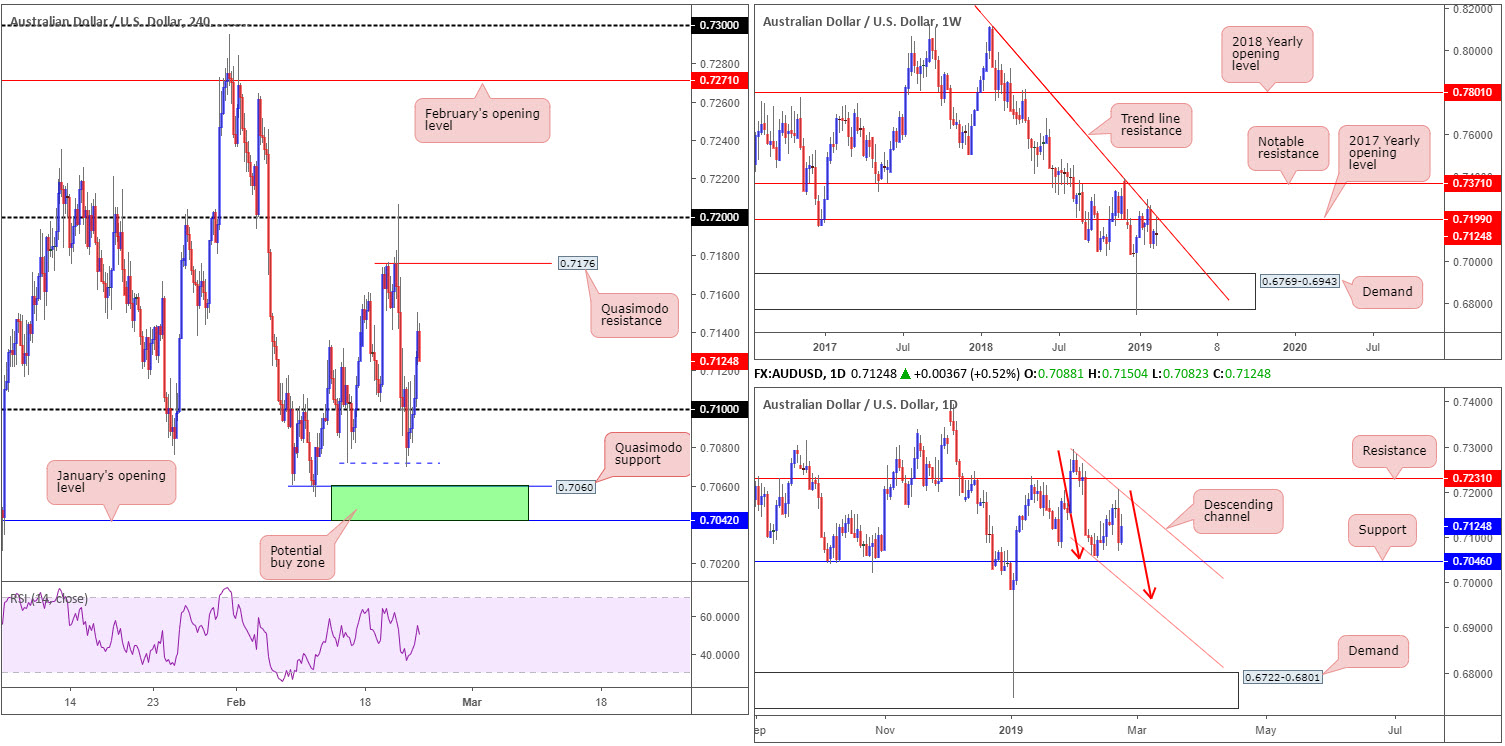
Contained by the 2017 yearly opening level at 0.7199 and merging trend line resistance (taken from the 2018 yearly high of 0.8135), the market wrapped up the week forming a clear-cut indecision candle.
Having seen weekly price recently connect with significant resistance, along with downside displaying room to press as far south as demand at 0.6769-0.6943, sellers appear to have the upper hand.
Daily perspective:
Compressing within a descending channel (0.7295/0.7060), the daily candles are seen eyeing support coming in at 0.7046. This, assuming the level holds if tested, places a question mark on the willingness of weekly sellers from 0.7199. A break of this barrier to the downside, nonetheless, will confirm seller strength to at least the AB=CD bullish completion point of 0.6965ish (red arrows – converging with said channel support).
H4 perspective:
Reports of an indefinite ban on Australian coal imports from China witnessed the H4 candles sink through 0.71 to a weekly low of around 0.7070 Thursday. The Chinese Foreign Ministry denied these reports in early EU hours Friday, encouraging a move back above 0.71 to highs of 0.7150.
Further buying this week on the H4 scale has Quasimodo resistance at 0.7176, followed closely by the 0.72 handle – fuses with 0.7199 on the weekly timeframe – on the radar.
With weekly sellers possibly involved, though, 0.71 is likely to re-enter the frame this week as support.
Areas of consideration:
The green area marked on the H4 timeframe between January’s opening level at 0.7042 and a Quasimodo support at 0.7060 form a potential buy zone to keep tabs on this week, targeting a bounce from here to at least 0.71. What gives this area extra credibility is it merging with daily support drawn from 0.7046.
Why only a bounce, as highlighted above, is due to threat of weekly sellers out of 0.7199.
Today’s data points: FOMC Member Clarida Speaks.
USD/JPY:
Weekly gain/loss: +0.17%
Weekly close: 110.64
Weekly perspective:
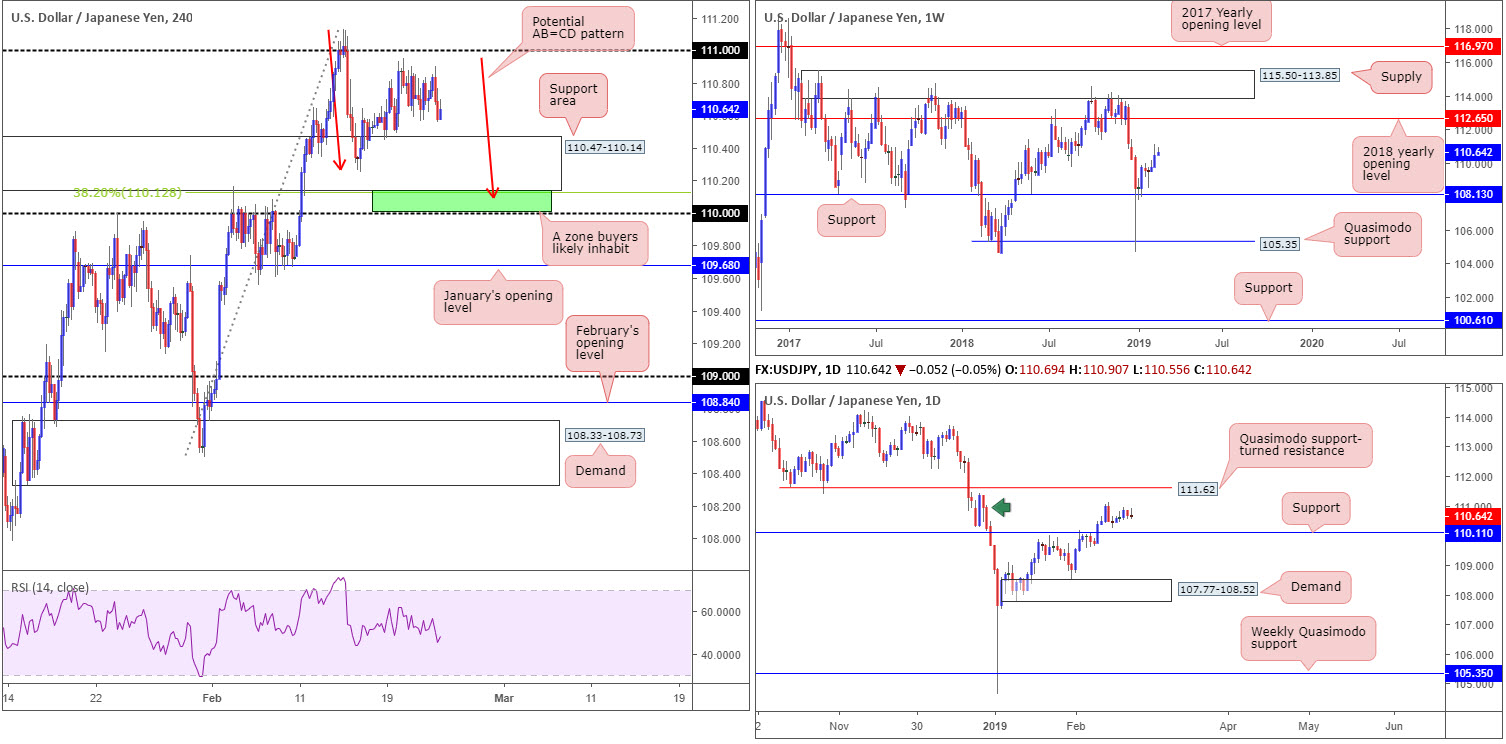
Although recording a third consecutive weekly gain, USD/JPY bulls failed to generate much follow-through momentum last week. In fact, the unit was unable to break the previous week’s range (111.12/109.73).
As long as price remains above support drawn from 108.13, upside on this timeframe is relatively free until linking with its 2018 yearly opening level at 112.65.
Daily perspective:
Following a strong bearish rotation candle on February 14, the market produced a number of lacklustre candles. Surrounding structure on this timeframe consists of a supply area at 111.40-110.27 (green arrow), a support level coming in at 110.11 and a Quasimodo support-turned resistance at 111.62.
H4 perspective:
The USD/JPY continued to reflect an indecisive stance Friday around the top edge of a rather large support area coming in at 110.47-110.14.
Beneath the current support zone, traders may also want to pencil in daily support mentioned at 110.11, shadowed closely by the 110 handle. Both levels boast relatively strong history, with the daily barrier positioned close by a 38.2% H4 Fibonacci support value at 110.12. In addition to this, a possible H4 AB=CD bullish pattern (red arrows) completion may take shape around 110.08.
Areas of consideration:
Having observed weekly action maintain somewhat of a bullish pose, as well as daily support plotted nearby at 110.11, the green zone marked on the H4 timeframe between 110/110.12 (the round number 110, the daily support at 110.11, the 38.2% H4 Fibonacci support at 110.12 and the H4 AB=CD bullish completion at 110.08) remains worthy of the watchlist this week. The only caveat here, nevertheless, is the possibility of a stop run materialising through 110 (common viewing around psychological numbers) before an advance is seen. To help avoid being stung, waiting for additional H4 candlestick confirmation to form out of the zone is an idea (entry/stop levels can be defined according to the candlestick’s rules of engagement).
Today’s data points: FOMC Member Clarida Speaks.
USD/CAD:
Weekly gain/loss: -0.81%
Weekly close: 1.3134
Weekly perspective:
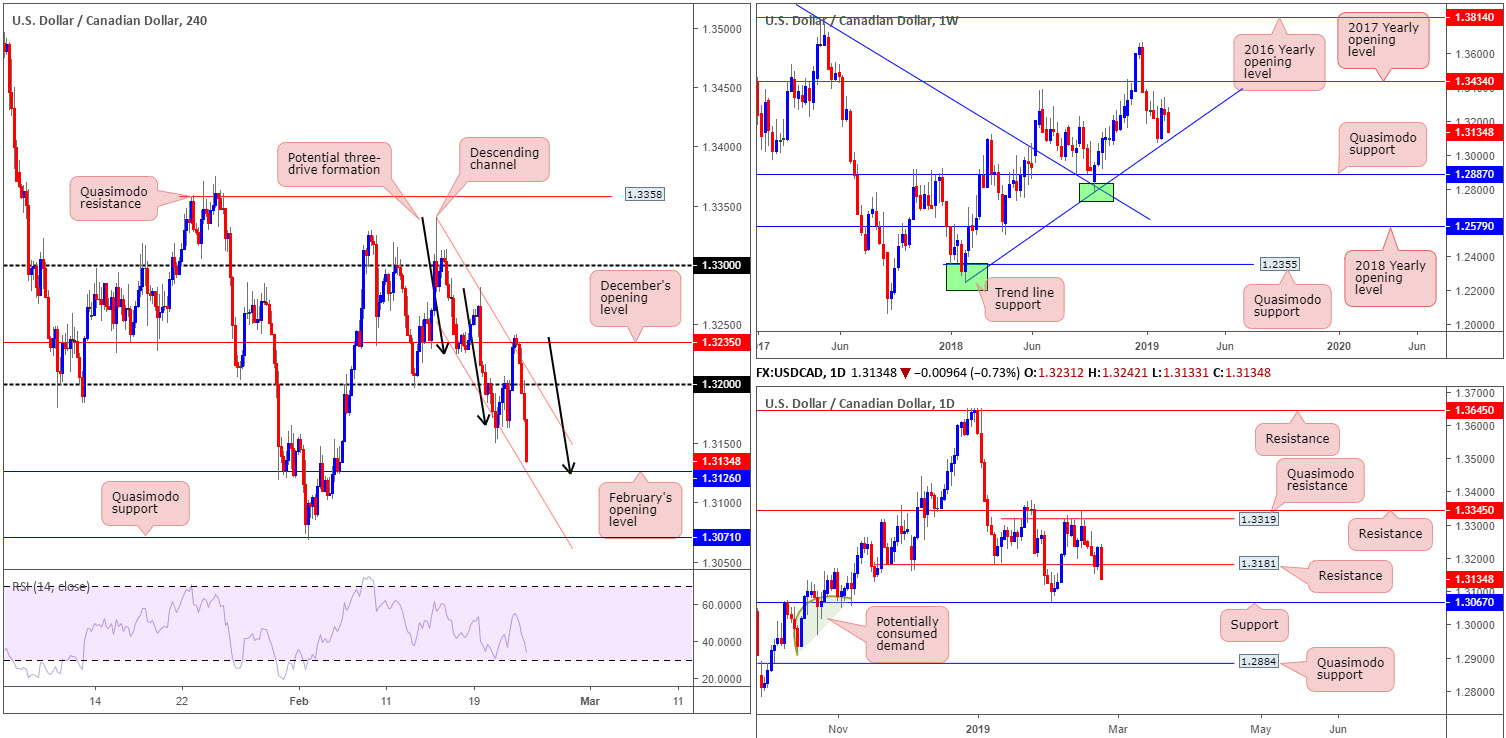
In the form of a near-full-bodied bearish candle the USD/CAD sustained further losses last week, erasing more than 100 pips. In accordance with weekly structure, though, the research team notes nearby support in the shape of a trend line (extended from the low 1.2247). Beyond here, limited support is in the offing until crossing swords with a Quasimodo formation seen at 1.2887.
Daily perspective:
Closer study on the daily timeframe reveals support at 1.3181 was dislodged Friday by means of a near-full-bodied bearish candle, theoretically paving the way for additional downside this week in the direction of support at 1.3067. It also sheds light on Quasimodo support drawn from 1.2884, in view of the limited demand to the left of current price beyond 1.3067.
H4 perspective:
Canadian retail sales edged down 0.1% to $50.4 billion in December, according to Statistics Canada Friday. Lower sales at gasoline stations (-3.6%) were partly offset by higher sales at motor vehicle and parts dealers (+1.0%). Excluding gasoline stations, retail sales increased 0.4%. The impact of the report sent the USD/CAD lower, shattering its 1.32 handle. Following a swift retest of this number (clearer on the M30), the pair resumed its downside trajectory into US hours, eventually clocking lows a few pips north of February’s opening level at 1.3126.
Recent selling has also opened up the possibility of a three-drive bullish formation completing today (black arrows) that terminates around February’s opening level, and a fusing channel support (etched from the low 1.3225).
Areas of consideration:
Longs from February’s opening level highlighted above on the H4 timeframe at 1.3126 are of interest this week, though traders are urged to consider the possibility of a fakeout materialising through this level to nearby weekly trend line support (see above), before serious buyers make an appearance.
With the above in mind, exercising patience is crucial. Studying the behaviour of H4 action once connected with 1.3126 is recommended before pulling the trigger. Should a H4 bullish pin-bar pattern form that pierces through 1.3126 and tests the weekly trend line, for example, buying this market is considered high probability (entry and stop parameters can be defined according to the pattern’s construction), targeting at least the opposing edge of the current H4 channel.
Today’s data points: FOMC Member Clarida Speaks.
USD/CHF:
Weekly gain/loss: -0.46%
Weekly close: 1.0002
Weekly perspective:
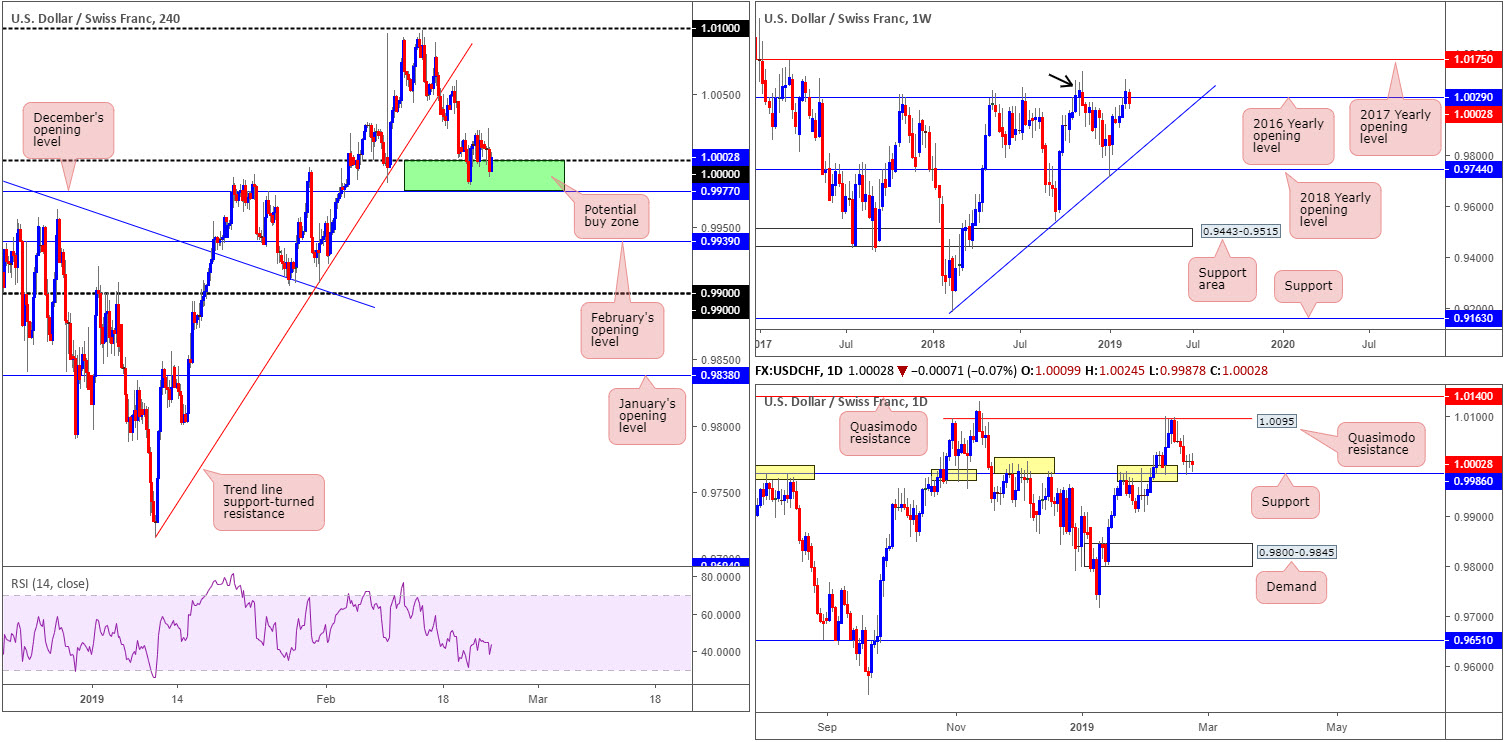
Weekly buyers struggled to gain a foothold above its 2016 yearly opening level at 1.0029 last week, consequently clawing back prior week gains and breaking a three-week bullish run. As highlighted in the previous weekly briefing, the barrier’s history as a resistance may still draw in sellers as it did in November 2018 (black arrow).
Daily perspective:
A closer look at price action on the daily timeframe turns the spotlight towards notable support seen at 0.9986. The level’s history (yellow) is a prominent feature on this chart, and therefore could hinder weekly sellers from 1.0029 this week.
H4 perspective:
Since Wednesday, USD/CHF action remained somewhat sedated, flipping between gains/losses nearby 1.0000 (parity), visually presented by three consecutive daily indecision candles. As a consequence to this, the research team’s outlook put forward in previous reports remains unchanged.
Alongside 1.0000 on the H4 timeframe, December’s opening level at 0.9977 as well as daily support coming in at 0.9986, collectively forms an appealing range of support (green). As highlighted in previous analysis, while 0.9977/1.0000 may be a tempting location to consider buying this market from in view of its construction, traders are urged to take into account weekly price trading beneath its 2016 yearly opening level at 1.0029.
Areas of consideration:
The combination of daily support mentioned above at 0.9986, December’s opening level at 0.9977 and 1.0000 has likely enticed buyers into the market, despite the threat of weekly sellers residing above.
With stop-loss orders likely tucked underneath December’s opening level, the initial upside target around 1.0050 appears a reasonably logical starting point, followed by the daily Quasimodo resistance at 1.0095 (the next upside target on the daily scale).
Today’s data points: FOMC Member Clarida Speaks.
Dow Jones Industrial Average:
Weekly gain/loss: +0.55%
Weekly close: 26039
Weekly perspective:
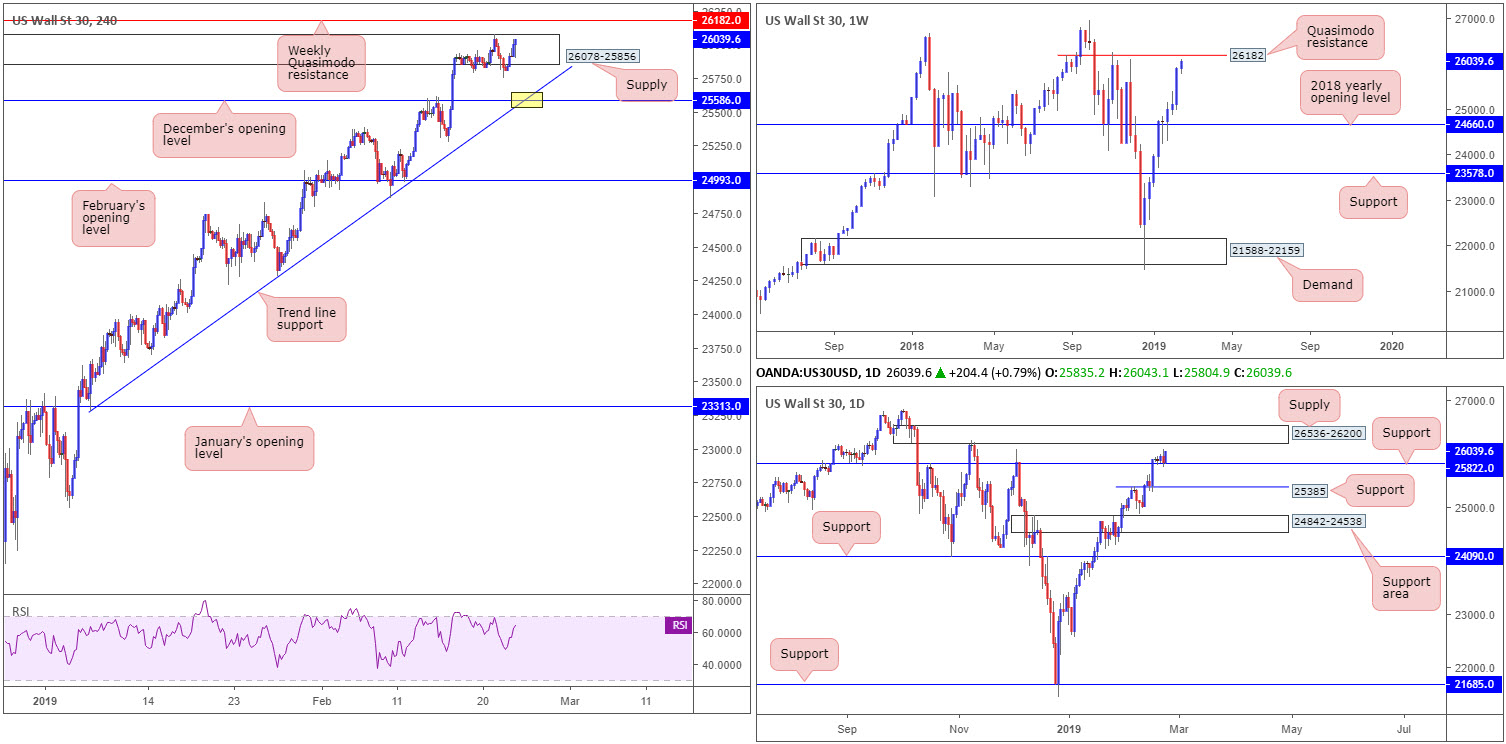
Since clearing and retesting the 2018 yearly opening level at 24660 as support four weeks ago, the Dow Jones Industrial Average elbowed its way north, reaching highs just south of Quasimodo resistance at 26182 last week.
Already capping upside in early November 2018 from 26182, the market may observe a rotation lower this week should the level be challenged.
Daily perspective:
Over the course of last week on the daily timeframe, the index found support around 25822. It may also interest some traders to note Friday’s session chalked up an inside candle, which for most is considered a bullish signal. Further buying from here, though, is somewhat hampered with supply at 26536-26200 pictured close by.
H4 perspective:
Since the beginning of the week, buyers and sellers on the H4 timeframe have been battling for position within the confines of a supply zone at 26078-25856.
Outside of the current supply, support can be seen in the form of December’s opening level at 25586 that merges with a trend line support (taken from the low 23277 [yellow]). Beyond the supply, however, the weekly Quasimodo resistance highlighted above at 26182 is visible.
Areas of consideration:
With the aforementioned H4 supply zone suffering a minor breach to its upper edge last week, the research team feels a move to the weekly Quasimodo resistance at 26182 may be in store. Note this level is positioned just south of daily supply mentioned above at 26536-26200.
Should H4 price strike the weekly level this week and pencil in a notable bearish candlestick pattern, this would, according to our technical studies, offer a high-probability entry into the market (entry and stop levels can be defined via the candlestick’s rules of engagement), targeting daily support at 25822 as an initial take-profit zone.
Today’s data points: FOMC Member Clarida Speaks.
XAU/USD (GOLD):
Weekly gain/loss: +0.51%
Weekly close: 1327.8
Weekly perspective:
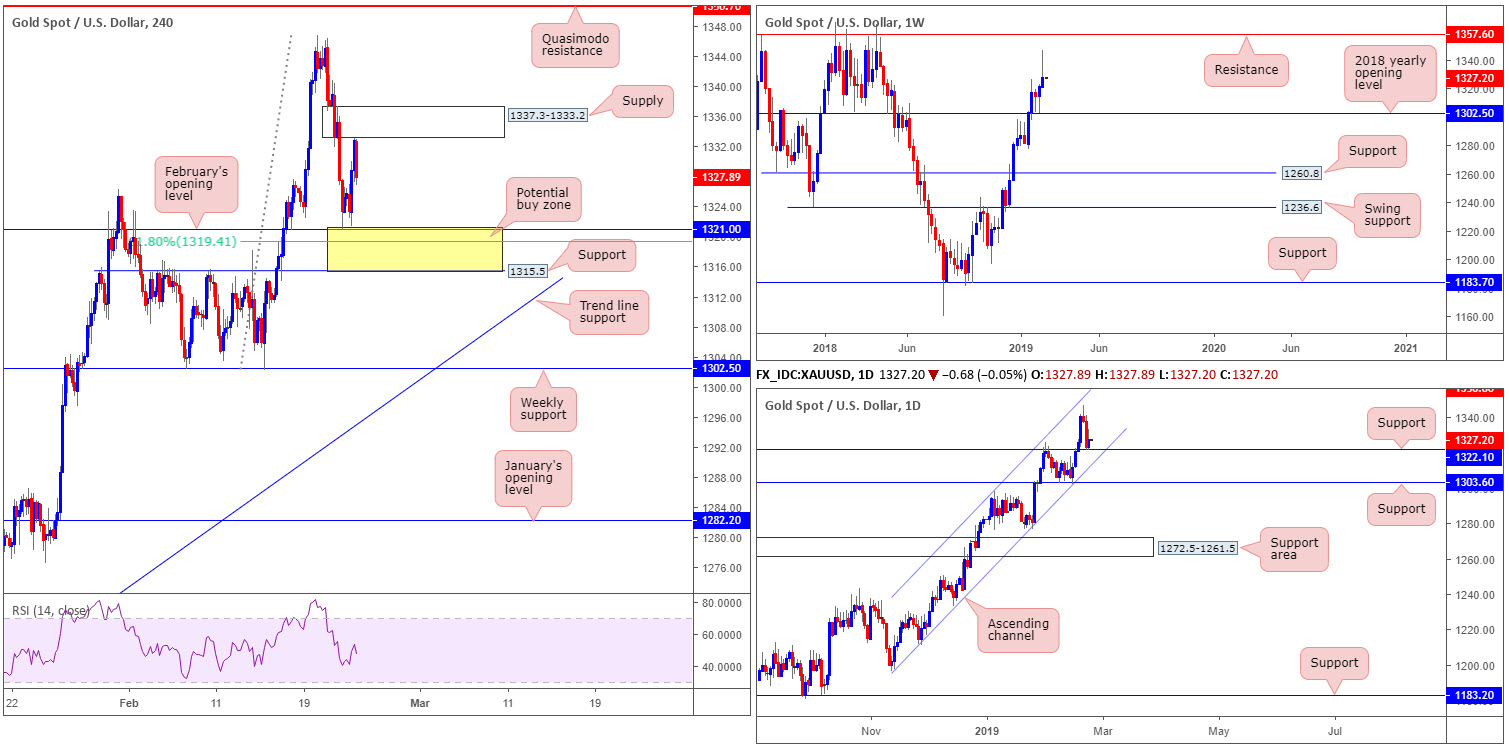
Leaving resistance at 1357.6 unchallenged last week, the yellow metal faded highs of 1346.7 and concluded the session closing by way of a bearish pin-bar formation. This has likely caught the eye of candlestick traders, and could potentially entice sellers into the market this week towards the 2018 yearly opening level at 1302.5.
Daily perspective:
Lower down on the curve, however, daily price is seen fading support at 1322.1 that is currently housed within an ascending channel support (1196.4/1298.5). Therefore, this may hinder downside activity on the weekly timeframe this week.
H4 perspective:
February’s opening level on the H4 timeframe at 1321.0, as you can see, provided a platform for buyers to enter the market Friday, targeting supply drawn from 1337.3-1333.2. Traders may also want to acknowledge a 61.8% Fibonacci support value positioned beneath 1321.0 at 1319.4 and a nearby support level coming in at 1315.5.
Areas of consideration:
With the above in mind, traders may find use in the yellow zone marked on the H4 timeframe at 1315.5/1321.0 (H4 support at 1315.5, the 61.8% H4 Fibonacci support value at 1319.4 and February’s opening level at 1321.0) as a possible buy zone. Note this area is also seen a few pips south of daily support at 1322.1.
Despite 1315.5/1321.0 housing reasonably attractive confluence, do bear in mind weekly price shows room to press beyond this area. For that reason, waiting for additional forms of confirmation to take shape out of the zone is recommended before pulling the trigger. One such example is a H4 bullish candlestick signal. An alternative to this is drilling down to the lower timeframes and trading a resistance-turned support setup.
The accuracy, completeness and timeliness of the information contained on this site cannot be guaranteed. IC Markets does not warranty, guarantee or make any representations, or assume any liability with regard to financial results based on the use of the information in the site.
News, views, opinions, recommendations and other information obtained from sources outside of www.icmarkets.com.au, used in this site are believed to be reliable, but we cannot guarantee their accuracy or completeness. All such information is subject to change at any time without notice. IC Markets assumes no responsibility for the content of any linked site. The fact that such links may exist does not indicate approval or endorsement of any material contained on any linked site.
IC Markets is not liable for any harm caused by the transmission, through accessing the services or information on this site, of a computer virus, or other computer code or programming device that might be used to access, delete, damage, disable, disrupt or otherwise impede in any manner, the operation of the site or of any user’s software, hardware, data or property.


