
Key risk events today:
RBA Gov Lowe Speaks; German IFO Business Climate; New Zealand Trade Balance.
EUR/USD:
Weekly gain/loss: +1.45%
Weekly close: 1.1368
Weekly perspective:
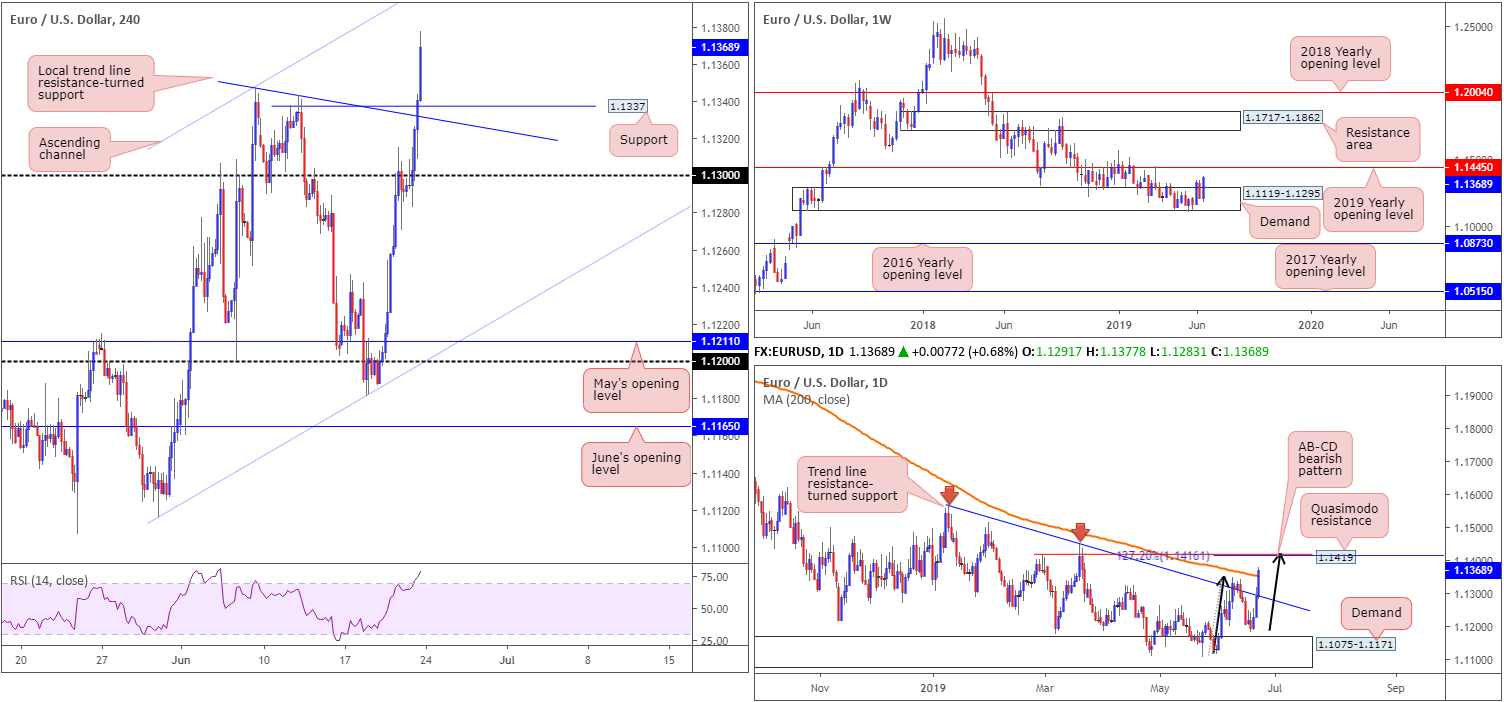
By means of a near-full-bodied bullish candle, EUR/USD bulls went on the offensive last week, adding more than 160 points out of a long-standing demand area at 1.1119-1.1295. Continued bidding this week will bring the 2019 yearly opening level (resistance) back to light at 1.1445.
Despite recent buying, though, longer-term traders may want to note the overall trend remains facing in a southerly direction since topping in early 2018. For that reason, 1.1445 is likely to act as strong resistance.
Daily perspective:
Leaving demand at 1.1075-1.1171 unchallenged, Wednesday saw the euro begin its advance higher vs. the buck, hauling price action beyond notable trend line resistance (extended from the high 1.1569) and also marginally above the 200-day SMA on Friday. This, as you can see, may have opened the pathway north to a nearby Quasimodo resistance at 1.1419 this week. What’s also interesting is a merging 127.2% AB=CD (black arrows) bearish pattern at 1.1416.
H4 perspective:
Friday witnessed the H4 candles storm above 1.13 and also beyond Quasimodo resistance at 1.1337, reaching a 3-month high of 1.1377. The main driver behind the buying is a waning dollar index (closed the week just north of its 96.00 handle) on the back of a rate cut expectation, and the euro receiving fresh impetus from upbeat German and French Markit PMI data.
The next area of resistance on the H4 timeframe is the 1.14 handle (not visible on the screen), closely shadowed by the daily Quasimodo resistance mentioned above at 1.1419 and its converging daily AB=CD approach at 1.1416.
Areas of consideration:
Higher-timeframe structure highlights weekly resistance around the 1.1445 point, with daily flow demonstrating a potential ceiling at 1.1419.
Shorter-term flows (H4) has the 1.14 handle in sight as potential resistance, and support can be found at prior resistance drawn from 1.1337, closely trailed by a local trend line resistance-turned support (taken from the high 1.1347).
On account of the above, a pullback this week opens the door to possible buying opportunities from 1.1337, whereas continued buying offers potential selling openings between 1.1445/1.14 (comprised of the weekly resistance level at 1.1445, the daily Quasimodo resistance at 1.1419 and the round number 1.14).
As for entry and exit, a long from 1.1337 offers stop-loss placement beyond the local trend line support, with an upside target set at the sell zone underlined above. As for selling, stop-loss placement is best set beyond the sell zone at around 1.1447, with an initial target fixed at the 200-day SMA (currently trading at 1.1351).
GBP/USD:
Weekly gain/loss: +1.21%
Weekly close: 1.2740
Weekly perspective:
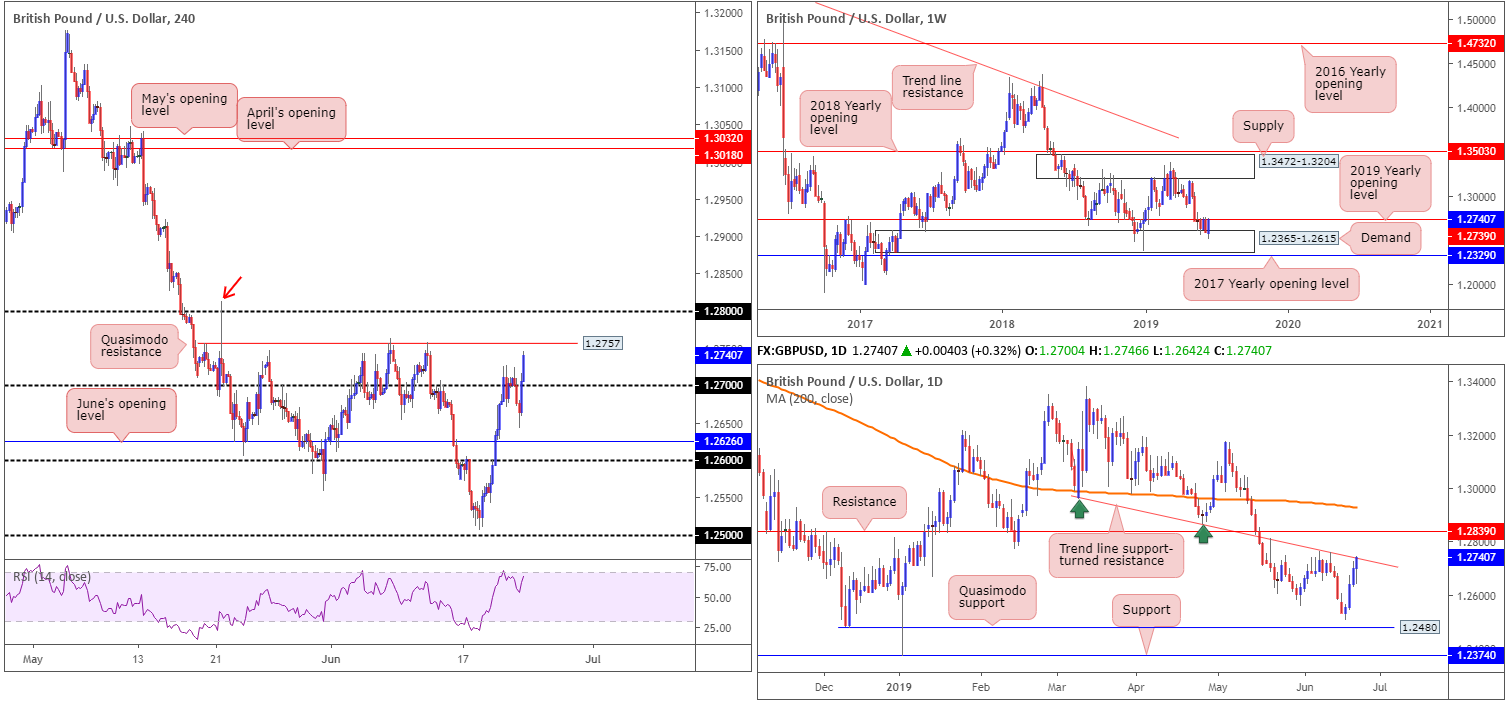
Since May 20, buyers and sellers have been sparring for position between long-standing demand at 1.2365-1.2615 and the 2019 yearly opening level at 1.2739. Areas outside of this border to be conscious of fall in around the 2017 yearly opening level at 1.2329 and supply coming in at 1.3472-1.3204.
Traders may also wish to acknowledge the unit ended the week closing at the underside of the 2019 yearly opening level, so selling may ensue this week.
Daily perspective:
In tandem with the 2019 yearly opening level at 1.2739 on the weekly timeframe, daily movement concluded the week shaking hands with trend line support-turned resistance taken from the low 1.2960. Beyond here, traders’ crosshairs are likely fixed on resistance drawn from 1.2839.
H4 perspective:
Sterling largely traded as a function of dollar softness Friday, up 0.32%. Following a dip to a session low of 1.2642 during London hours, the GBP/USD gained traction amid US trading and overthrew the 1.27 handle to the upside. The next port of call is a familiar Quasimodo resistance at 1.2757, which not only capped upside on two occasions already this month, it also boasts a close connection to the aforementioned daily trend line resistance and the current weekly resistance. Indicator-based traders may also wish to acknowledge the RSI is meandering nearby its overbought value.
Areas of consideration:
Traders are encouraged to include the H4 Quasimodo resistance at 1.2757 in their analysis today/early week, due to its surrounding confluence underscored above. However, traders should prepare for the possibility of a fakeout through this level, as the market may want to bring in additional sellers from 1.28 positioned nearby.
As a result of the above, the area between 1.28 and 1.2757 is of interest for selling. Favoured stop-loss placement, according to our technical studies, is beyond the 1.2813 May 21 high (red arrow), with the initial downside target placed at 1.27.
AUD/USD:
Weekly gain/loss: +0.80%
Weekly close: 0.6924
Weekly perspective:
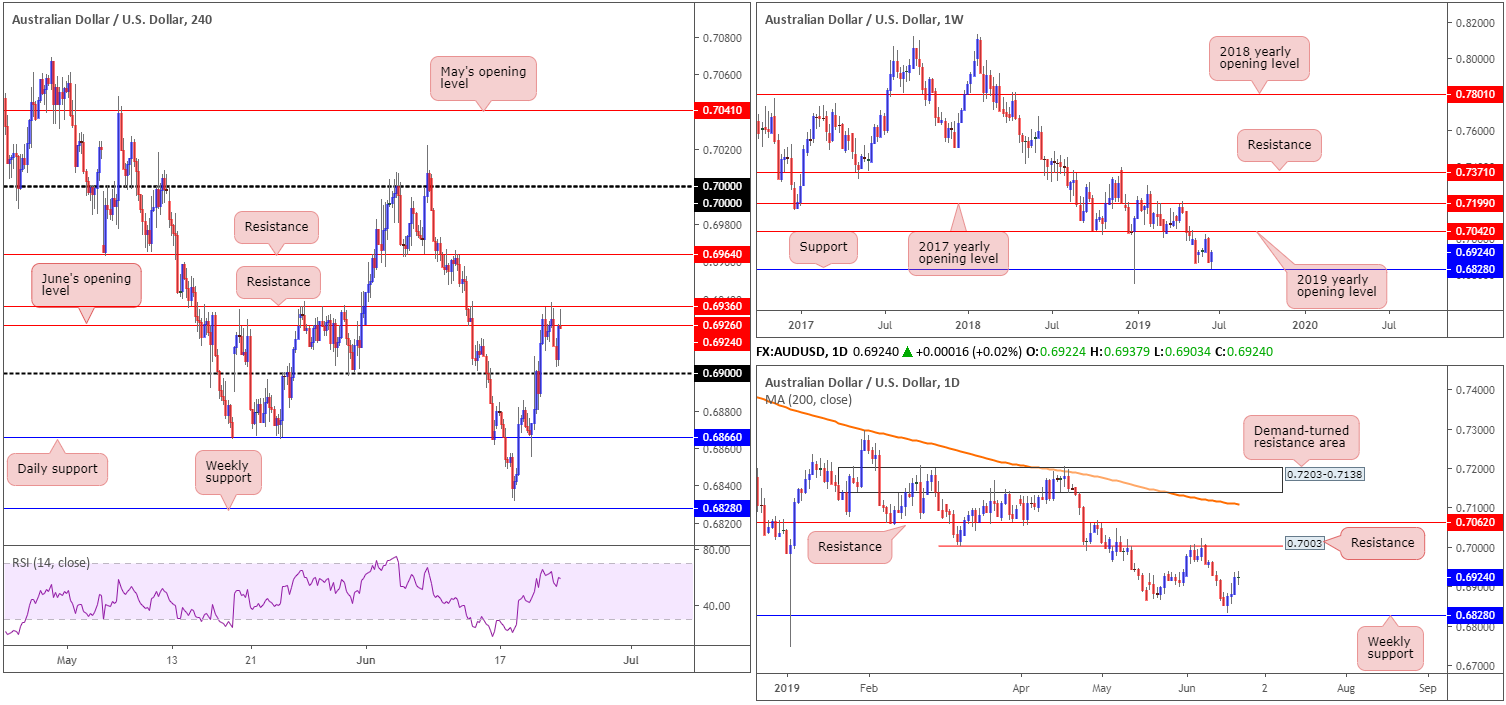
Over the course of last week’s sessions, price action came within a couple of points of connecting with notable support pencilled in at 0.6828 (a level offering history as far back as mid-2003) before rotating higher. Adding more than 50 points, and likely sparking buyer interest, further upside could be on the cards this week, with an initial objective set at the 2019 yearly opening level 0.7042.
Daily perspective:
Shifting focus to the daily timeframe, we can see the unit finished Friday in the shape of an indecision candle, following a three-day bullish phase.
Technically speaking, room to manoeuvre higher this week is visible, targeting resistance plotted at 0.7003. Note this level held price action lower since early May.
H4 perspective:
Despite a soft greenback across the board, the Australian dollar gathered little attention Friday, unable to dethrone resistance at 0.6936 and nearby June’s opening level at 0.6926. With both weekly and daily timeframes exhibiting scope for further buying this week, H4 resistance at 0.6936 may be fragile, potentially setting the stage for a run towards another layer of resistance at 0.6964, or maybe even the key figure 0.70.
On the flip side, nonetheless, the RSI indicator is lurking just south of its overbought value and the closing H4 candle ended the week in the form of a shooting star pattern (a bearish Japanese candlestick signal).
Areas of consideration:
Having seen higher-timeframe support recently enter the mix, albeit missing price by a couple of points, and the next upside objective on the bigger picture not entering the fray until at least 0.7003, the research team feels H4 resistance at 0.6936 is on the verge of caving in. The most you’ll likely receive from 0.6936 is a retest of 0.69.
In light of the above reading, two scenarios are on the menu this week:
- A H4 close above 0.6936, followed up with a retest, offers traders the chance to buy this market, ultimately targeting 0.70 (entry and risk can be structured according to the rejection candle’s parameters).
- A retest of 0.69, formed by way of a H4 or H1 bullish candlestick signal, unlocks the door to possible buying. Not only does the bullish candlestick signal identify buyer intent, it, as highlighted above, also helps traders locate entry and risk levels to work with.
USD/JPY:
Weekly gain/loss: -1.15%
Weekly close: 107.31
Weekly perspective:
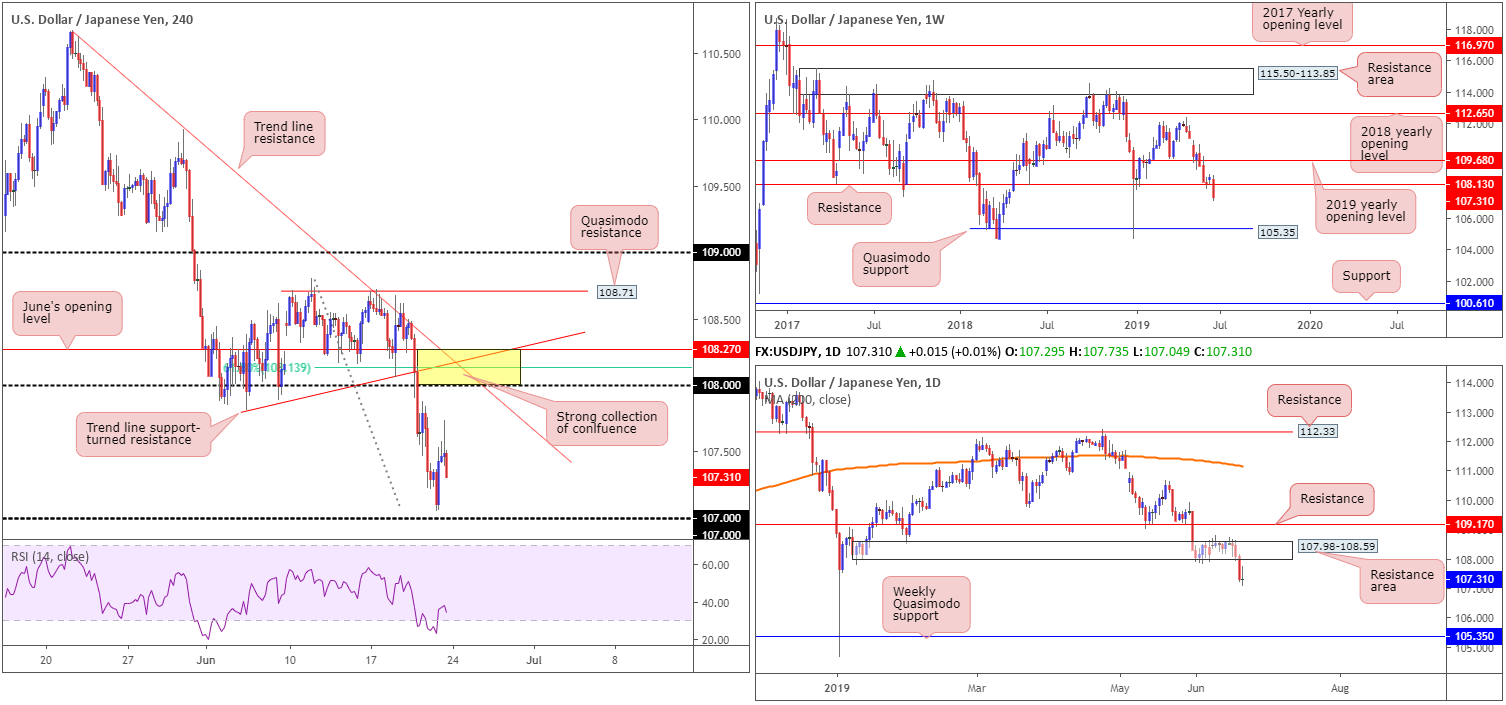
Over the past couple of weeks, longer-term flow has been engaging with support at 108.13. That was, of course, until last week’s movement dropped more than 125 points. The break of this key support is critical, given the next available support, according to our technical reading, does not emerge until Quasimodo support at 105.35.
Although violating 108.13 is considered a sell signal, the possibility of price action pulling back and retesting the underside of the broken level as resistance is certainly there. As such, those short on the breakout candle may experience drawdown.
Daily perspective:
A closer reading of price action on the daily timeframe witnessed the unit sink a long-suffering demand at 107.98-108.59 in the shape of a near-full-bodied bearish candle Thursday. Similar to the weekly timeframe, the research team sees limited support until connecting with weekly Quasimodo support at 105.35, though remain open to the possibility a pullback could ensue before further selling materialises.
H4 perspective:
Although the US dollar index continued to explore lower ground Friday, the USD/JPY concluded unchanged. Despite this, the daily range witnessed price action make a run for the 107 handle, though missed by a couple of points, and also connect with a session high of 107.73.
Areas of consideration:
In light of the unchanged status, Friday’s outlook remains intact:
Although the technical picture portends a downside bias this week that’ll likely bring in 107 buyers on the H4 timeframe, selling is problematic. An ideal scenario would be for the H4 candles to pull back and retest the 108 region, which happens to align closely with the lower edge of the recently engulfed daily demand at 107.98, two H4 trend line resistances (110.67/107.81), a 61.8% Fibonacci retracement value at 108.13 and June’s opening level at 108.27.
From here, traders have the opportunity to consider selling, with the first downside target likely best set at any demand formed on the approach. However, do keep in mind both weekly and daily timeframes show room to press as far south as the weekly Quasimodo support at 105.35, so further selling beyond the first take-profit target is most likely on the cards.
Entry at 108 seems reasonable, with a protective stop-loss order plotted beyond 108.27.
USD/CAD:
Weekly gain/loss: -1.42%
Weekly close: 1.3219
Weekly perspective:
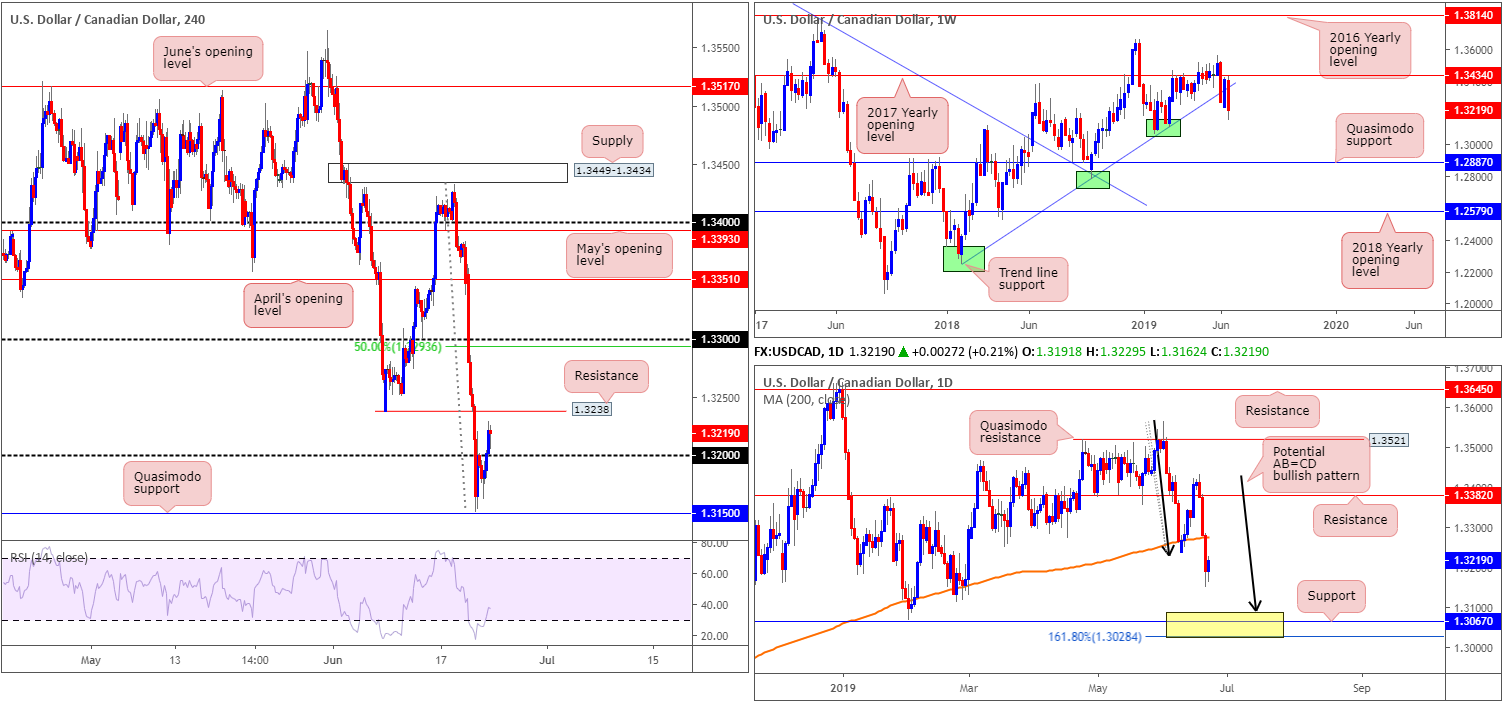
Since coming within two points of the 2017 yearly opening level at 1.3434 (resistance), the pair reclaimed trend line support (extended from the low 1.2247) in strong fashion last week.
Limited demand is visible to the left of current price, therefore the possibility of further downside this week is in store, targeting Quasimodo support at 1.2887.
Daily perspective:
A closer reading of price action on the daily timeframe recently observed a decisive close beneath the 200-day SMA and opened the door for a possible run to a support area fixed between 1.3028/1.3089 (yellow). Comprised of an AB=CD (black arrows) formation at 1.3089, a support at 1.3067 and a 161.8% Fibonacci extension at 1.3028 (forms part of the AB=CD structure), this area likely has enough confluence to hold price should we reach this far south this week.
H4 perspective:
After coming within touching distance of Quasimodo support at 1.3150 Thursday, the H4 candles ticked higher amid US hours Friday on the back of lower-than-expected retail sales data out of Canada, with buyers potentially looking to extend the attempted recovery further beyond the 1.32 handle. In spite of this, a combination of opposing forces may limit upside momentum: WTI prices continue to advance, closing above the $57.58 mark, and the US dollar index remains on the backfoot, eyeing a test of 96.00 nearby.
Above 1.32, we have possible resistance lurking nearby at 1.3238, though in view of the limited confluence bolstering this level, further buying could ensue towards the 200-day SMA on the daily timeframe around 1.3276, followed closely by the 1.33 handle.
Areas of consideration:
The 1.33 handle jumps out as interesting this week, having seen it closely unite with a 50.0% resistance value at 1.3293 and the 200-day SMA at 1.3276 (a sell zone of 1.33/1.3276) This area could provide a platform for sellers to engage and target a possible run to the daily buy zone underlined above between 1.3028/1.3089. As round numbers are prone to fakeouts, however, traders are urged to consider waiting for additional confirmation to form before pulling the trigger. This could be anything from a bearish candlestick signal – think shooting star pattern – an MA crossover or even drilling down to the lower timeframes and attempting to trade local structure within the higher-timeframe zone.
The daily buy zone mentioned above at 1.3028/1.3089 is also of interest this week, in light of its connecting confluence. Buying from here, though, places one against potential weekly flow, so, similar to above, waiting for additional confirmation before buying is recommended.
Entry and stop-loss placement are trader dependant, though a favourable position for longs is beneath the buy zone at 1.3028 and ten points above 1.33 for shorts.
USD/CHF:
Weekly gain/loss: -2.23%
Weekly close: 0.9761
Weekly perspective:
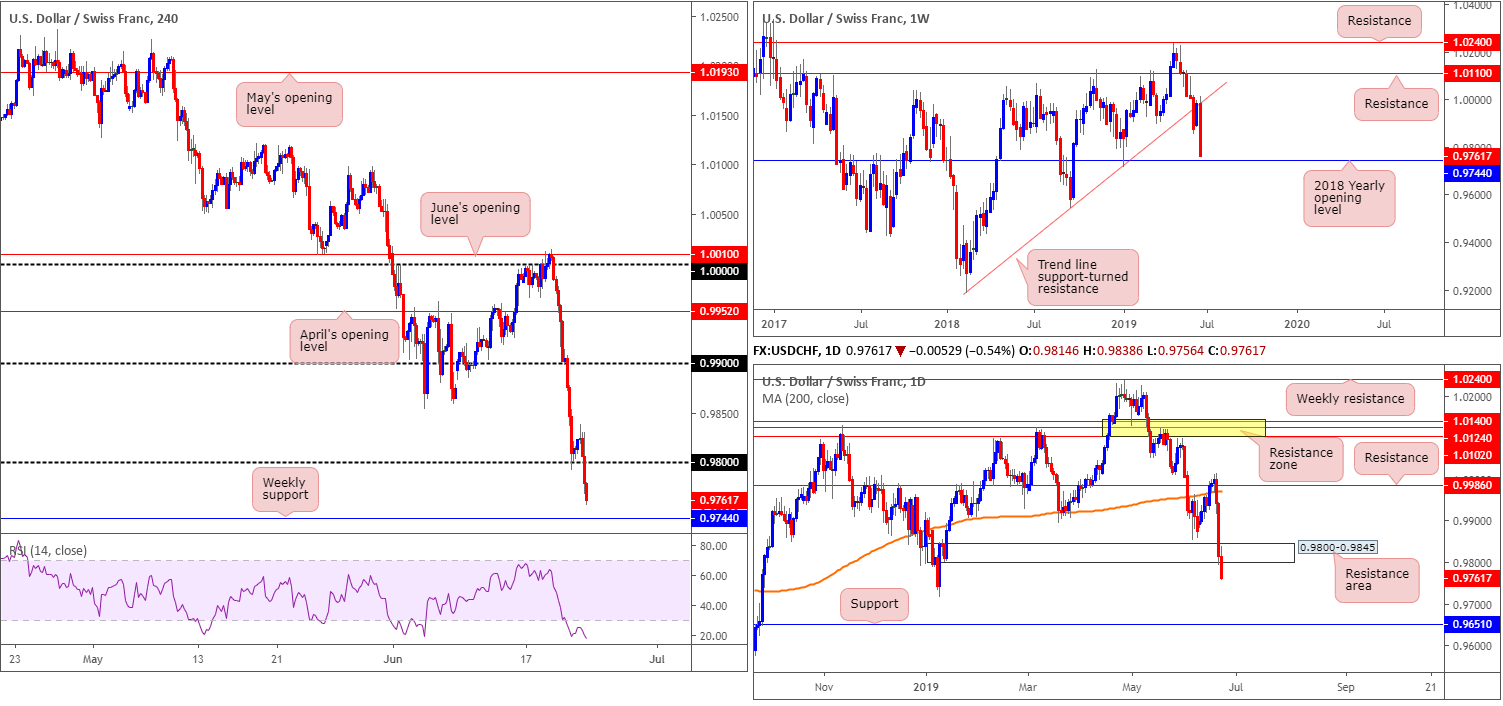
Safe-haven demand for the Swiss franc increased exponentially over the course of recent trading, weighing on the USD/CHF. Longer-term flow, as is evident from the chart, retested trend line support-turned resistance (taken from the low 0.9187) and concluded the session a few points north of the 2018 yearly opening level at 0.9744.
Daily perspective:
From Wednesday onwards, after the formation of a bearish engulfing pattern, the US dollar declined against the Swiss Franc in the shape of two near-full-bodied bearish candles. This consequently consumed demand at 0.9800-0.9845 and exposed the 0.9716 January 10 low, closely shadowed by support at 0.9651. Bear in mind, though, before we reach the said low point, the 2018 yearly opening level at 0.9744 will need to be engulfed.
H4 perspective:
Broad-based USD selling Friday weighed on the USD/CHF and broke through the 0.98 handle amid US flow. Breakout sellers beneath this level are currently in good form, though with weekly support, by way of the 2018 yearly opening level at 0.9744, lurking just south of Friday’s close, active buyers may enter the market and retest 0.98 as resistance.
Areas of consideration:
In the event the H4 candles fail to strike weekly support at 0.9744 and retest 0.98 as resistance, this could offer traders an ideal platform to short. Note 0.98 also represents the lower edge of the recently broken daily demand-turned resistance area at 0.9800-0.9845. In spite of this, round numbers are commonly prone to whipsaws (stop runs), therefore it may be best to wait for bearish candlestick confirmation (entry and risk can be determined according to the selected candlestick structure), either on the H4 or H1, to develop before initiating a sell.
Dow Jones Industrial Average:
Weekly gain/loss: +2.03%
Weekly close: 26665
Weekly perspective:
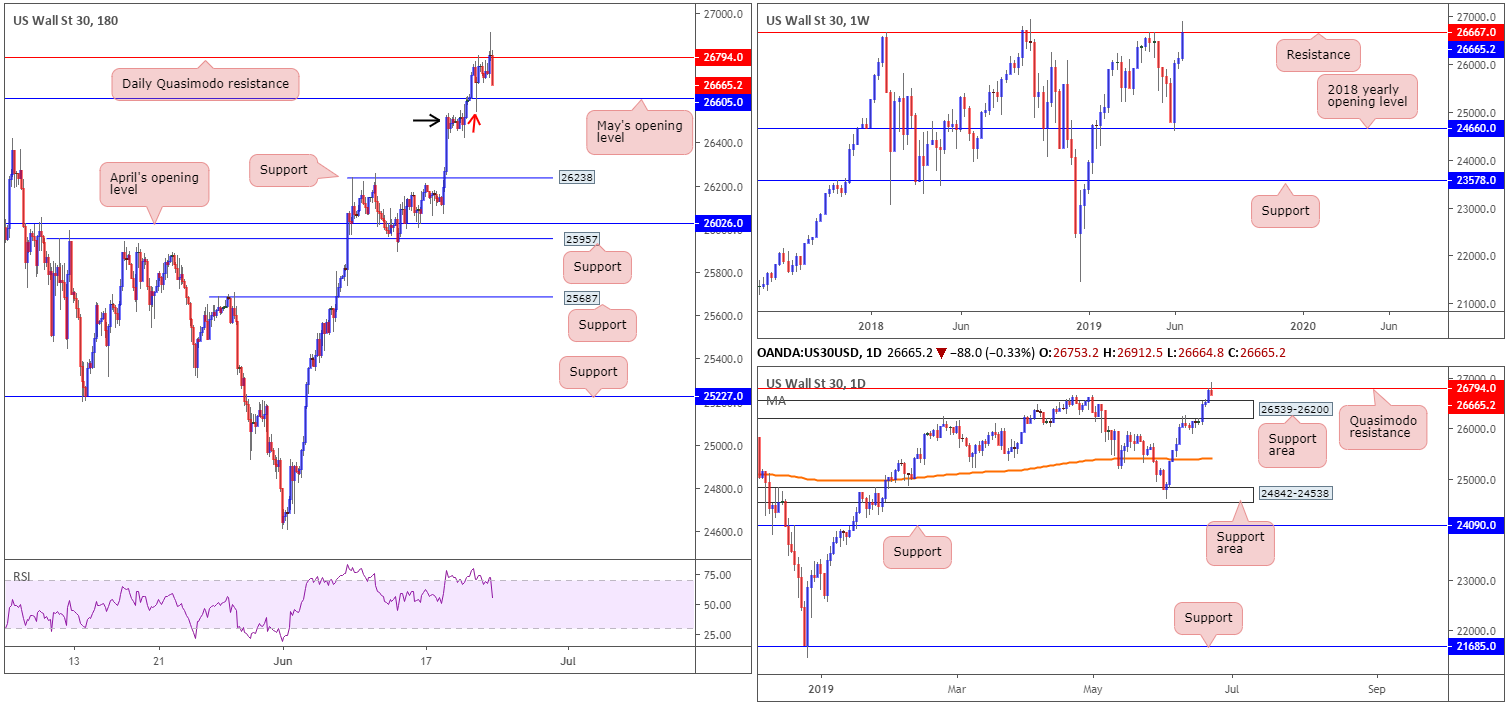
US equities extended gains last week, adding more than 500 points. Following the Dow snapping back three weeks’ worth of losses off its 2018 yearly opening level at 24660 three weeks back, consequently producing a bullish engulfing pattern, the recently closed weekly candle shook hands with resistance at 26667. Beyond here, we have little in view but the all-time high at 26939.
Daily perspective:
Together with weekly resistance at 26667, we also have daily Quasimodo resistance recently entering the fold at 26794. What’s interesting about this level, aside from the fact it converges closely with weekly structure, is Friday’s movement concluded in the shape of a shooting star formation, which may trigger a run to the nearby support area at 26539-26200 and, according to the weekly timeframe, potentially lower.
H4 perspective:
The Dow Jones Industrial Average fell Friday after the index clocked record intraday highs as investors gauged tensions with Iran and prospects for a resolution of the US/China trade conflict. The Dow Jones Industrial Average declined 0.13%; the S&P 500 was also down 0.13% and the tech-heavy Nasdaq 100 concluded trade down by 0.12%.
From a technical perspective, the H4 candles are seen fading the daily Quasimodo resistance mentioned above at 26794, though active buyers may enter the fight at May’s opening level drawn from 26605. Mild demand resides beneath here around the 26550 region (green arrow), though given Thursday’s spike to 26539 (red arrow), this area may be consumed, unlocking the door to support at 26238 this week.
Areas of consideration:
Clearly, we’re at a critical crossroads at the moment, with the index trading near its all-time high of 26939. As such, the daily bearish shooting star candlestick pattern may entice sellers into the market this week and explore ground as far south as the 2018 yearly opening level on the weekly timeframe at 24660. The drawback to this is the possibility of nearby support entering the mix around May’s opening level at 26605 or the top edge of the daily support area at 26539.
Should the market move lower, the risk/reward from a sell based on the daily bearish candlestick formation may be huge. The question you have to ask yourself is does your methodology agree with this approach and if so, how should the trade be managed in terms of risk control.
XAU/USD (GOLD):
Weekly gain/loss: +4.27%
Weekly close: 1398.6
Weekly perspective:
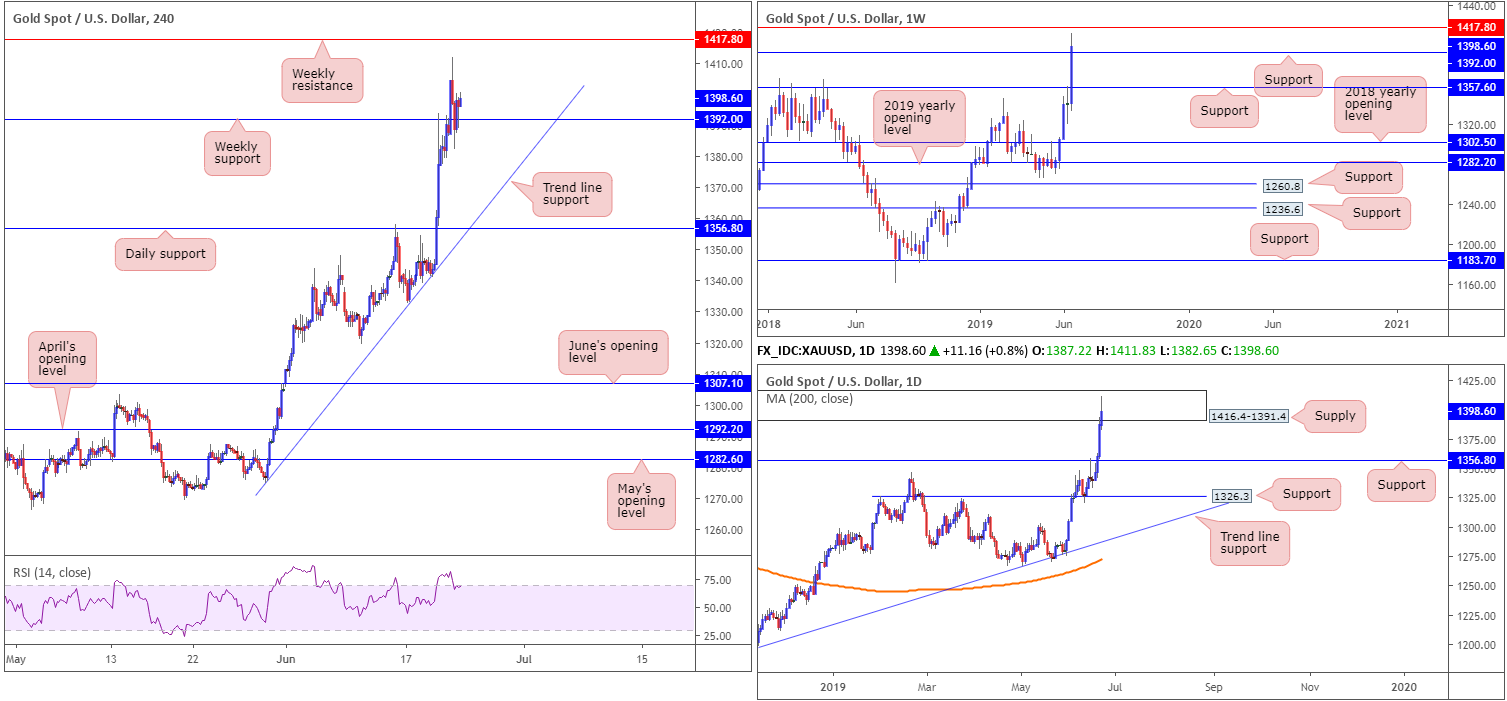
The price of gold, in $ terms, ended the week up more than $57, consequently extending the yellow metal’s four-week bullish phase. Safe-haven demand, along with a waning US dollar index from weekly resistance at 97.72, saw recent movement overthrow resistance at 1392.0 (now acting support), and came within striking distance of resistance at 1417.8.
Daily perspective:
Closer analysis of price action on the daily timeframe shows the unit trading within the walls of a supply zone coming in at 1416.4-1391.4. Note this area is located just south of the weekly resistance at 1417.8, though holds weekly support at 1392.0 within the lower limits of the boundary.
H4 perspective:
A closer examination of bullion on the H4 timeframe reveals Friday’s activity finished the day higher after retesting weekly support at 1392.0, albeit after a dip to a low of 1382.3. The next upside target, aside from Friday’s session high of 1411.8, is the weekly resistance level underscored above at 1417.8.
Areas of consideration:
For those who read Friday’s briefing you may recall the following:
In the event we test weekly support at 1392.0 today and produce a H4 bullish candlestick configuration, a long from this base may be worth considering, targeting weekly resistance at 1417.8 (entry and risk can be adjusted according to the bullish candlestick’s structure).
As is evident from the H4 timeframe, the market produced a H4 hammer formation (the candle preceding the closing candle) off the noted weekly support. This, given we’re coming from weekly support, could be enough to prompt buyers into the market today. The drawback, of course, is by entering long from here you’re effectively buying daily supply, though on the plus side you do have the overall trend backing the setup and room to move higher on the weekly timeframe.
Should the H4 hammer formation be of interest, entry should have already been filled, with the protective stop-loss order sited beneath Friday’s session low at 1382.3, therefore giving the setup some room to breathe.
The accuracy, completeness and timeliness of the information contained on this site cannot be guaranteed. IC Markets does not warranty, guarantee or make any representations, or assume any liability with regard to financial results based on the use of the information in the site.
News, views, opinions, recommendations and other information obtained from sources outside of www.icmarkets.com.au, used in this site are believed to be reliable, but we cannot guarantee their accuracy or completeness. All such information is subject to change at any time without notice. IC Markets assumes no responsibility for the content of any linked site. The fact that such links may exist does not indicate approval or endorsement of any material contained on any linked site.
IC Markets is not liable for any harm caused by the transmission, through accessing the services or information on this site, of a computer virus, or other computer code or programming device that might be used to access, delete, damage, disable, disrupt or otherwise impede in any manner, the operation of the site or of any user’s software, hardware, data or property.


