A note on lower timeframe confirming price action…
Waiting for lower timeframe confirmation is our main tool to confirm strength within higher timeframe zones, and has really been the key to our trading success. It takes a little time to understand the subtle nuances, however, as each trade is never the same, but once you master the rhythm so to speak, you will be saved from countless unnecessary losing trades. The following is a list of what we look for:
- A break/retest of supply or demand dependent on which way you’re trading.
- A trendline break/retest.
- Buying/selling tails – essentially we look for a cluster of very obvious spikes off of lower timeframe support and resistance levels within the higher timeframe zone.
- Candlestick patterns. We tend to only stick with pin bars and engulfing bars as these have proven to be the most effective.
EUR/USD:
Weekly recap:
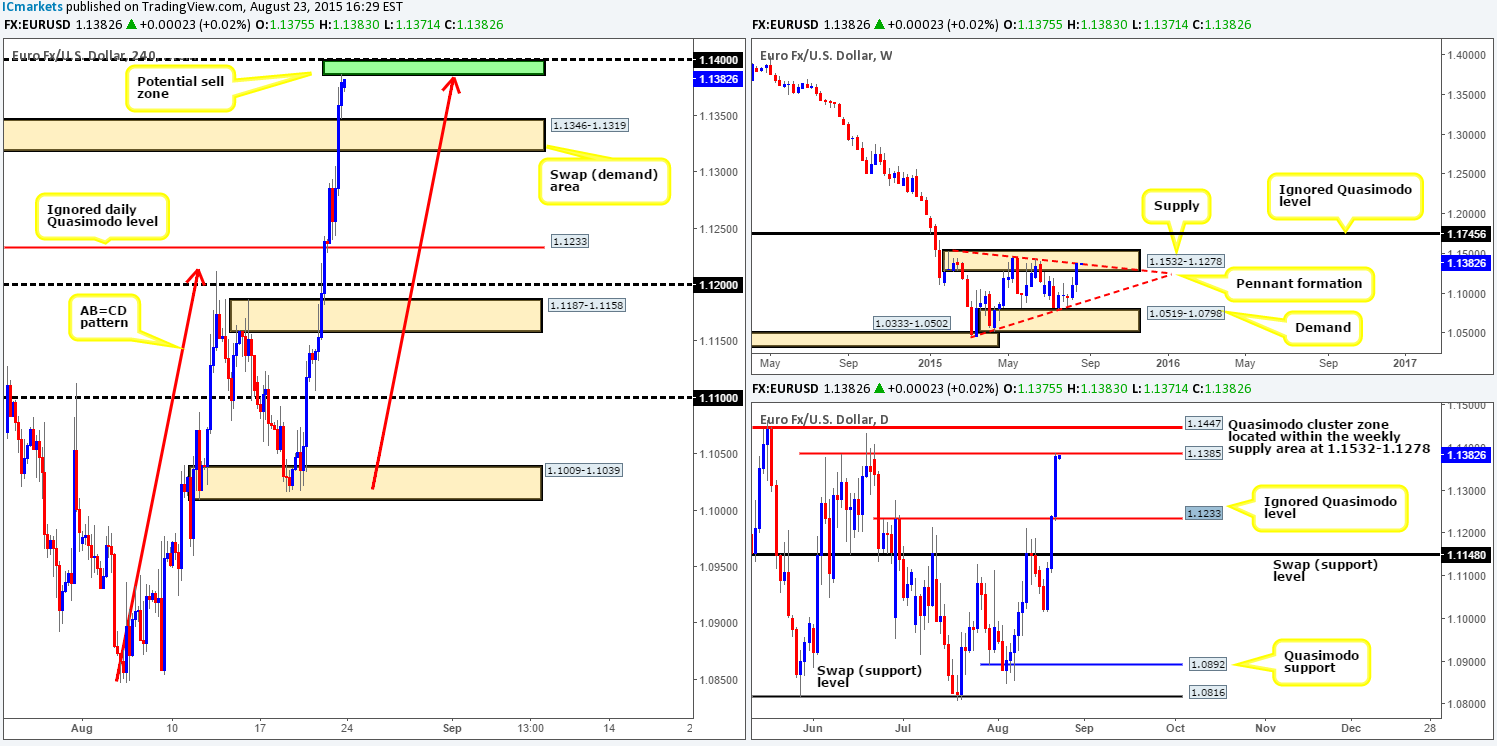
The EUR/USD market enjoyed another successful trading week, increasing its value by a little over 270 pips into the close 1.1380. This recent advance saw price drive relatively deep into weekly supply at 1.1532-1.1278, and also shake hands with the underside of a weekly downtrend line extended from the high 1.1532 (pennant upper limit). Turning our attention to the daily timeframe, we can see that ever since price drew support from the 1.1015 on Wednesday heavy buying was seen, consequently closing the week out just below a daily Quasimodo resistance line at 1.1385 (positioned within the aforementioned weekly supply zone).
Weekly outlook (big picture):
Given that both the weekly and daily timeframes show price trading at distinct resistance points in the market, we feel the EUR currency will eventually see a pullback this week. This will likely take place either from the current daily Quasimodo resistance level, or the one above sitting at 1.1447 – also located within the aforementioned weekly supply area. Downside targets from here fall in at 1.1233 – an ignored Quasimodo level, followed closely by a daily swap (support) line at 1.1148.
Today’s outlook and review:
Friday’s action was quite dramatic. Following a close above 1.1233 – a Quasimodo resistance level at the time, price retested this number going into Thursday’s close forming a small bullish pin-bar candle in the process. This, as you can see, clearly encouraged further buyers into the market which surpassed the 4hr supply zone at 1.1346-1.1319, and reached highs of 1.1387 on the day.
Transferring into a new week, price opened five pips lower than Friday’s close at 1.1375. Considering the location of price on the higher timeframe picture (see above in bold), and the fact that price is trading just below both 1.1400/4hr AB=CD potential reversal zone (1.1386), our prime focus today will be on shorts. Even though the market is showing all-round resistance at this time, we’ll still require lower timeframe confirmation at out sell zone marked in green (1.1386/1.1399). The reason being is simply to avoid being stopped out should price fakeout above 1.1400! In the event that we do happen to spot an entry short here, partial profits will be taken at 1.1346-1.1319, and then look towards 1.1233 – the ignored daily Quasimodo level.
Levels to watch/live orders:
- Buys: Flat (Stop loss: N/A).
- Sells: 1.1386/1.1399 [Tentative – confirmation required] (Stop loss: dependent on where one confirms this area).
GBP/USD:
Weekly recap:
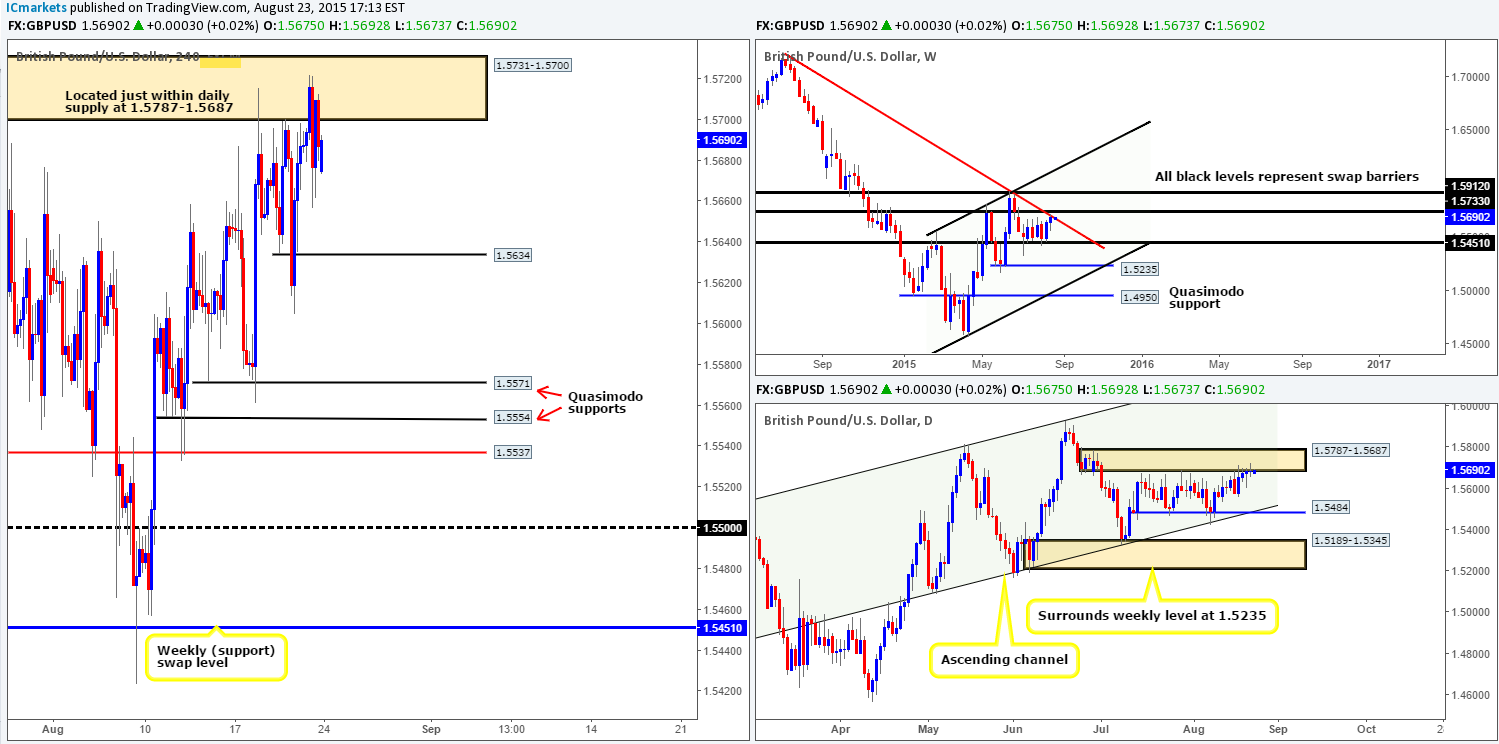
Following the rebound seen off of the weekly swap (support) level 1.5451, Cable extended higher last week, posting gains of around 45 pips into the close 1.5687. Consequent to this, price hit and respected the underside of a weekly downtrend line taken from the high 1.7166. Moving down to the daily timeframe, however, shows that the market spent the majority of last week teasing the underside of daily supply at 1.5787-1.5687, ending the week with price painting a small daily indecision candle.
Weekly outlook (big picture):
Looking to the week ahead, we see that the GBP has a ton of wood to chop through before it can print any noteworthy gains. As such, until there is a weekly close seen above the weekly swap (resistance) level at 1.5733, or the aforementioned daily supply area, our bias will remain short for the time being. Downside targets to keep an eye on this week are 1.5484 – a daily support, and the weekly swap (support) level at 1.5451 just below it.
Today’s outlook and review:
Friday’s trade saw price whipsaw in and out of 4hr supply coming in at 1.5731-1.5700, reaching lows of 1.5656 on the day – hence the daily indecision candle! Little change was seen over the weekend as trade opened eight pips lower than Friday’s close at 1.5675.
Taking into account where price is presently trading in the bigger picture (see above in bold), where do we see this market heading today on the 4hr timeframe? Well, with there being very little active demand seen below current price at the moment (demand consumption tails seen at 1.5656/1.5661), price will likely sell-off down to at least Quasimodo support at 1.5634. Ultimately though, before we’d consider a short entry on this pair, price would need to drive back up into the current 4hr supply zone and respect offers around Friday’s highs at 1.5722. Following this we’d also want to see price close back below 4hr supply lower limit –1.5700. It would be at this point our team would attempt to trade the retest of 1.5700. Lower timeframe confirmation would be a plus here, but one could simply touch trade 1.5700 in our opinion with a stop above at 1.5735.
Levels to watch/ live orders:
- Buys: Flat (Stop loss: N/A).
- Sells: Look to sell the retest at 1.5700 after price has cleared offers around 1.5722 (Stop loss: 1.5735).
AUD/USD:
Weekly recap:
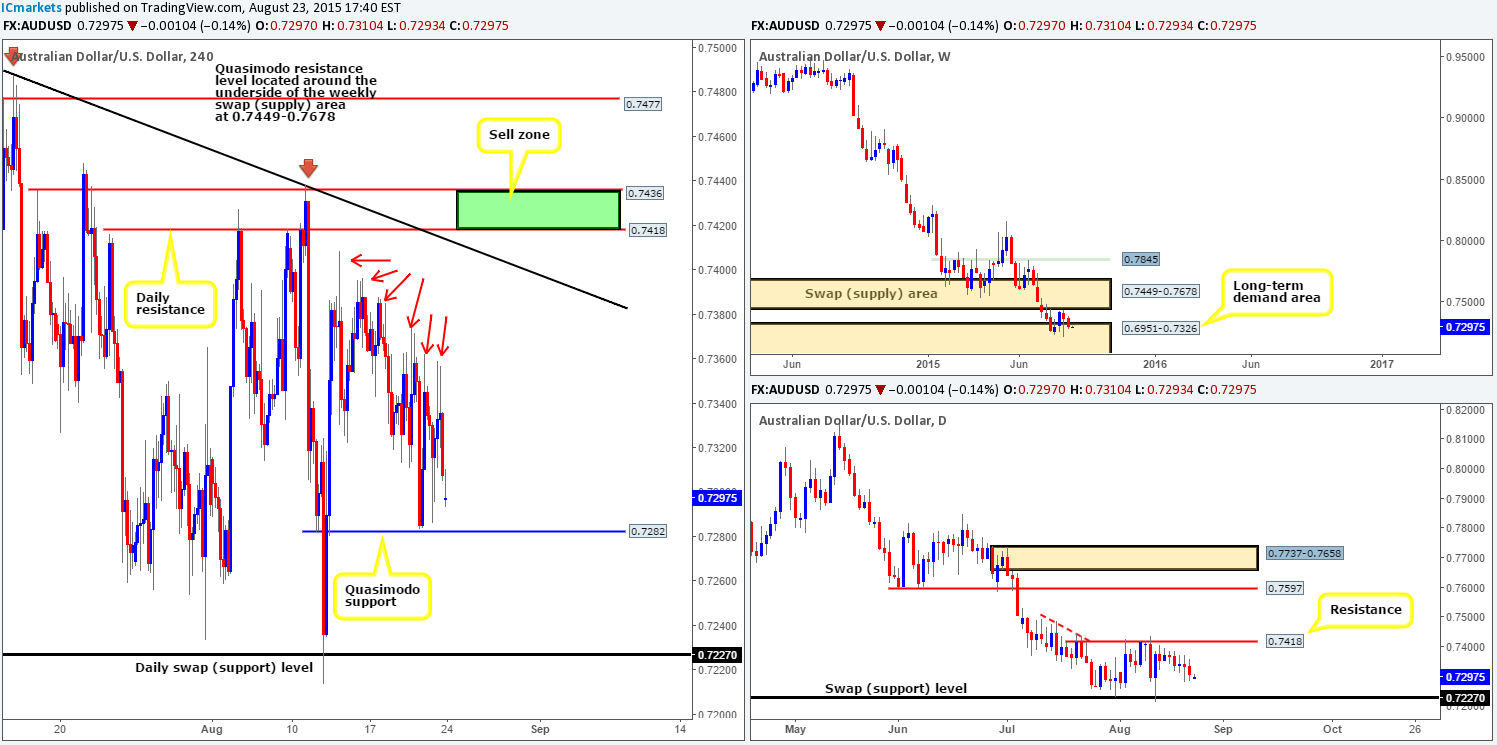
After price missed connecting with the weekly swap (supply) area at 0.7449-0.7678, the AUD/USD fell back into the jaws of a long-term weekly demand zone at 0.6951-0.7326 last week. This saw the pair shred 65 pips of value into the close 0.7307. Daily action on the other hand, shows that price spent the week steadily grinding south, reaching lows of 0.7371 during Thursday’s trade, which, as you can see, was respected as support on Friday.
Weekly outlook (big picture):
From a higher timeframe perspective, the week ahead will likely be tricky. Price on the weekly timeframe is currently trading within a long-term demand, whilst the daily picture shows price trading mid-range between 0.7418 and 0.7227. On top of all this, the Aussie remains entrenched in what seems to be a never-ending downtrend at the moment. Therefore, 0.7418 and 0.7227 will remain key levels going into this week.
Today’s outlook and review:
During Friday’s trade we witnessed price spike south to once again connect just above the 4hr Quasimodo support barrier at 0.7282, which quickly spring boarded this market north up to highs of 0.7359, only to once again sell-off into the close.
Price structure on the 4hr timeframe is extremely interesting at the moment. Above current price marked with red arrows is what we recognize as consumed supply. Check out the very obvious supply consumption wicks seen at 0.7359/0.7362/0.7374/0.7388/0.7396/0.7408. With this alone, the aforementioned 4hr Quasimodo support level is a fantastic level to be looking for longs today. However, seeing as price has come so close to hitting it on two occasions now, and the fact that the aforementioned daily swap (support) level is looming forty or so pips below, one has to be careful here. Waiting for lower timeframe confirmation before entering long off of 0.7282 is, in our opinion, the best path to take today. This will likely help avoid an unnecessary loss, but also help defend against any fakeouts below this level. Should a trade setup be seen here today, we’ll be looking towards the underside of the 4hr trendline (0.7494) to take partial profits, followed closely by 123.81/124.00 – a beautiful sell zone.
Levels to watch/ live orders:
- Buys: 0.7282 [Tentative – confirmation required] (Stop loss: dependent on where one confirms this level).
- Sells: 0.7418/0.7436 [Tentative – confirmation required] (Stop loss: dependent on where one finds confirmation within this area).
USD/JPY:
Weekly recap:
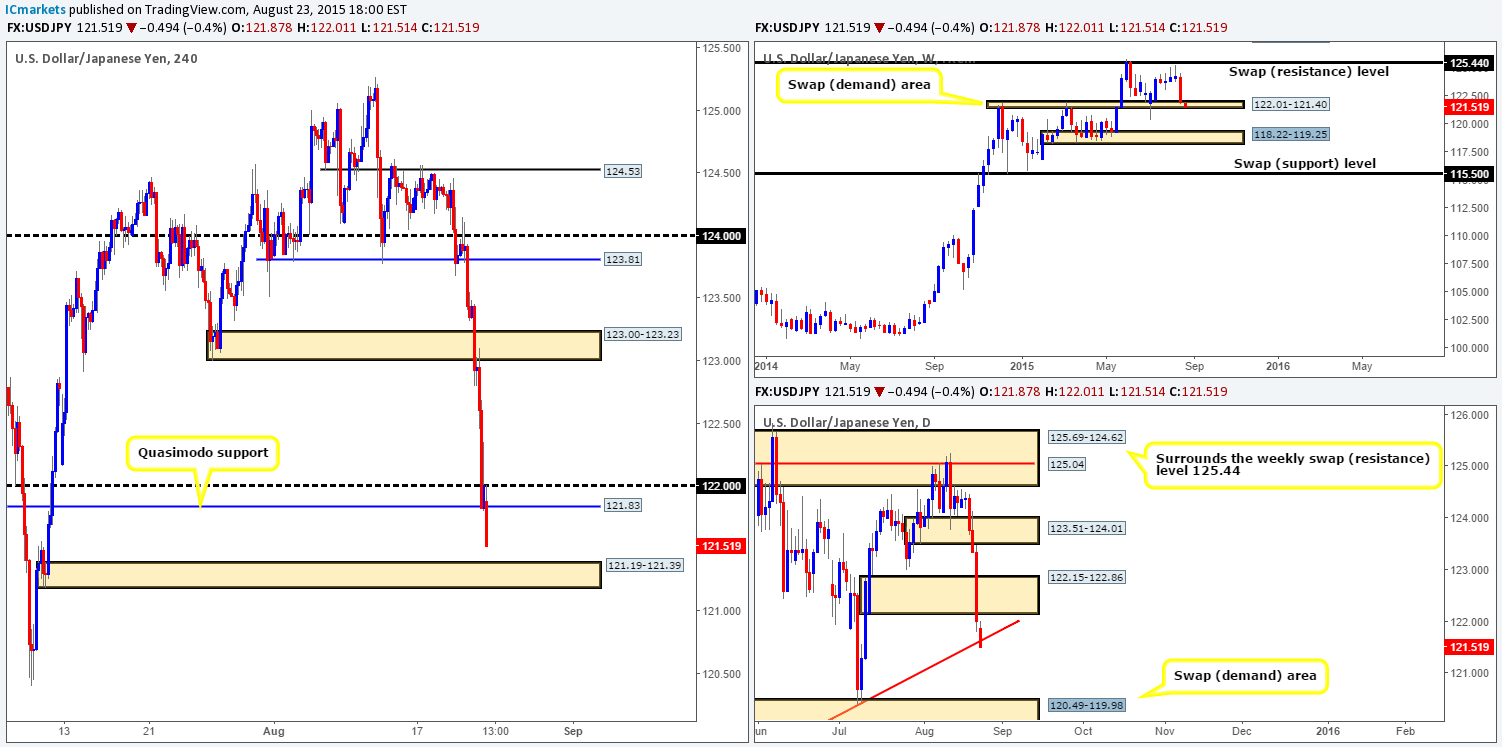
Last week’s action shows that the Japanese Yen gained close to 230 pips against the Greenback on the week. The USD/JPY aggressively sold off down towards a weekly swap (demand) area coming in at 122.01-121.40, which, as you can see, saw very little buying interest into the close 122.01. Rolling a page lower to the daily timeframe, we can see that price never really gained consciousness until Wednesday’s trade. This resulted in a three-day assault lower, taking out two daily demand zones (123.51-124.01/ 122.15-122.86) and coming so very close to connecting with a major daily ascending trendline extended from the low 115.84.
Weekly outlook (big picture):
Our team is relatively positive going into this week due to price not only trading within a clear area of weekly demand, but also just above a major daily uptrend line (see above). In addition to this, let’s not forget that the USD/JPY is in one stonking great uptrend at the moment. Be that as it may, do keep an eye on the recently broken daily demand zone just above current price at 122.15-122.86, as this could potentially act as supply!
Today’s outlook and review:
For those who read Friday’s report on the USD/JPY http://www.icmarkets.com/blog/friday-21st-august-daily-technical-outlook-and-review/ you may recall that we were short from 123.901, which hit our take-profit level at 123.25 just beautifully during Friday’s trade. Following this, however, price then continued to drop like a rock, engulfing the 4hr demand zone at 123.00-123.23, and driving past 122.00 into a 4hr Quasimodo support level at 121.83.
As we move into a new week, we can see that price opened fourteen pips lower than Friday’s close at 121.87. This small gap was quickly filled, which in turn saw strong offers push this pair below 121.83. In the event that this selling continues, which we think it will, there is a good chance price will connect with the 4hr demand zone seen at 121.19-121.39. Now, considering where price is currently trading on the higher timeframes right now (see above in bold), we believe that this 4hr demand area could provide a nice base in which to look for confirmed longs into this market today. Targets from this area to keep an eye on fall in at 121.83 and 122.00. If price should break above these numbers, then the path north could potentially be free all the way back up to the recently consumed demand area at 123.00-123.23.
Levels to watch/ live orders:
- Buys: 121.19-121.39 [Tentative – confirmation required] (Stop loss: dependent on where confirms this area).
- Sells: Flat (Stop loss: N/A).
USD/CAD
Weekly recap:
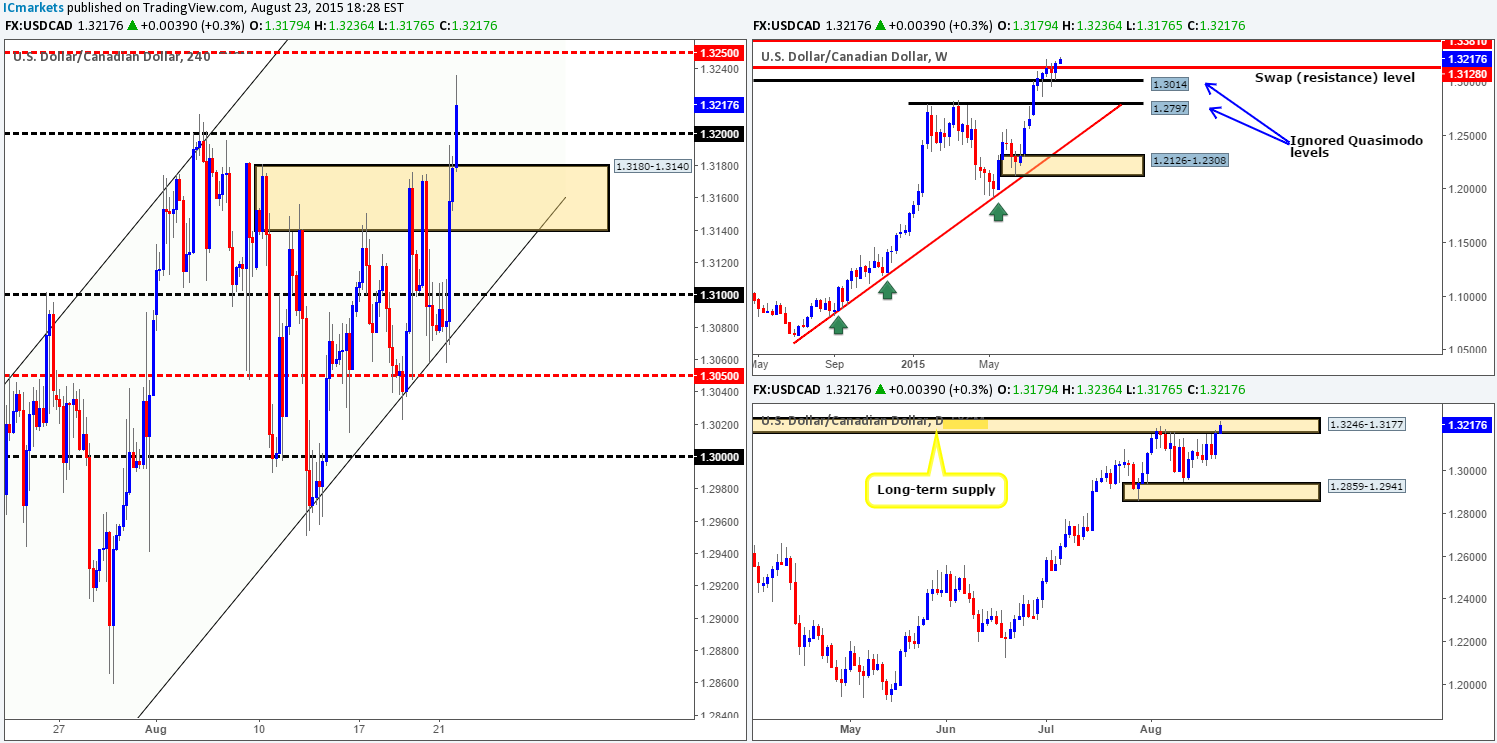
The USD/CAD pair gained about 85 pips on the week, closing near its highs at 1.3178. This recent buying saw price punch cleanly above offers sitting around a major weekly swap (resistance) level at 1.3128. From the daily scale, however, we can see that price remains trading below a long-term daily supply zone drawn from 1.3246-1.3177.
Weekly outlook (big picture):
Following the above, we think it’s fair to say that the USD/CAD’s prevailing uptrend is still very much intact! However, as for joining this trend, we would exercise patience. On the one hand price has closed above a major weekly level, but on the other, price is trapped below long-term daily supply. Therefore, the best path to take, at least from a higher timeframe perspective, would be to wait until a close is also seen above daily supply before considering longs into this market.
Today’s outlook and review:
Going into the early hours of Friday’s American session, the bulls were seen pressing forward. This took out the last remaining offers sitting at 1.3100, and also saw price spike above a 4hr supply zone at 1.3180-1.3140 into the close.
Going forward, we can see that this week’s trade opened at 1.3179 – a pip higher than Friday’s close. Despite this calm opening though, heavy buying has been seen consequently driving price high above the psychological resistance 1.3200. In consequence, price is now trading deep within the aforementioned daily supply zone, which might be consumed later on today with a bit of luck!
As of now, we have no plan on trading this pair until, as we mentioned above, price closes above the aforementioned daily supply zone.
Levels to watch/ live orders:
- Buys: Flat (Stop loss: N/A).
- Sells: Flat (Stop loss: N/A).
USD/CHF
Weekly recap:
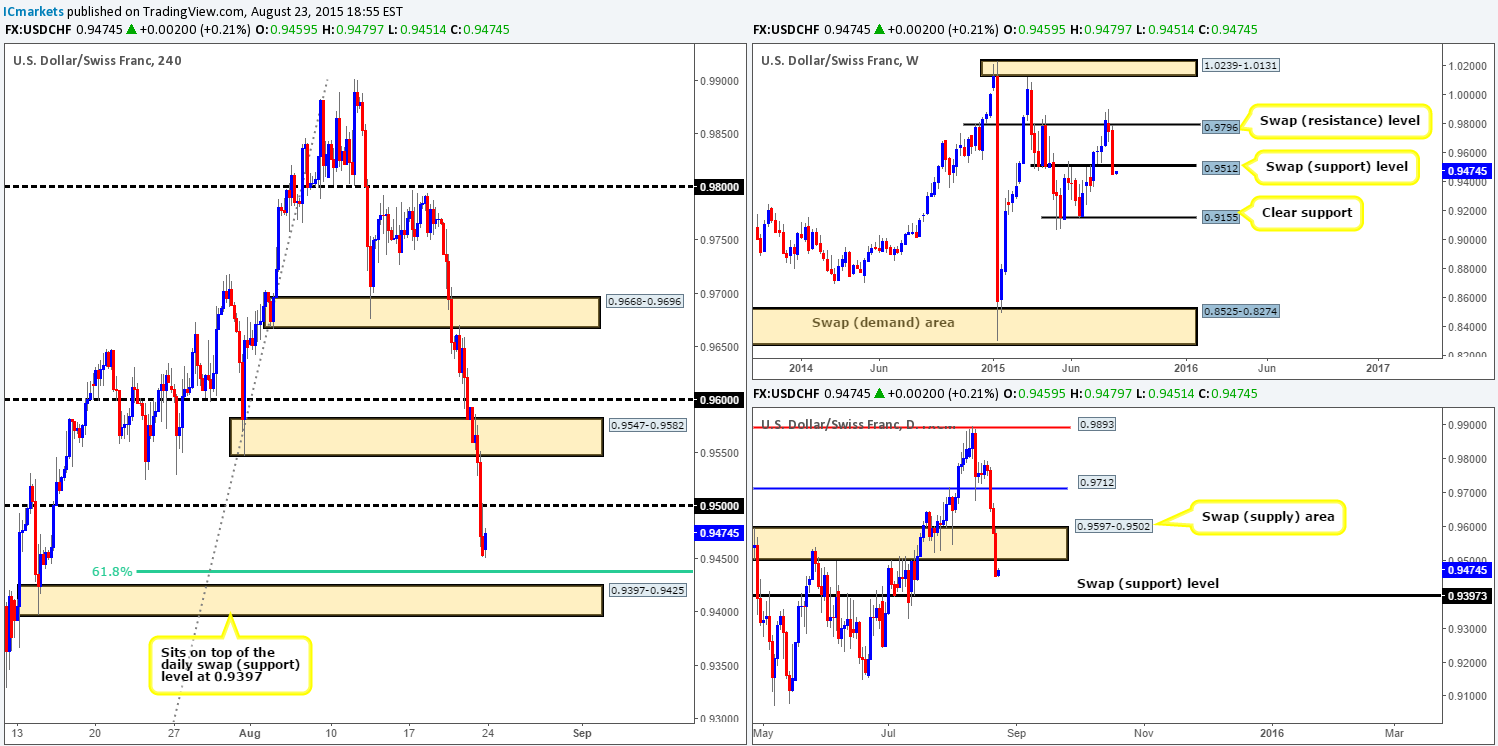
The USD/CHF suffered a nasty decline in value last week, consequently losing a little over 300 pips. This assault saw price take out a weekly swap (support) barrier coming in at 0.9512, closing on its lows at 0.9454. Shifting a gear lower, daily action reveals that price did not begin selling off until trade opened on Wednesday, which took out bids sitting at both 0.9712 and a daily swap (demand) area at 0.9597-0.9502.
Weekly outlook (big picture):
Progressing forward, it’s clear to see that after last week’s free-fall, there is room for this market to continue pushing lower this week. From the weekly timeframe, the next obvious structural support to keep an eye on is at 0.9155, while on the daily timeframe; keep a close tab on the daily swap (support) level at 0.9397.
Today’s outlook and review:
Amid Friday’s sessions, the recent selling broke below and retested a 4hr demand area at 0.9547-0.9582 as supply. From this, price aggressively shot lower, breaking below and retesting 0.9500 as resistance into the close.
Crossing over into a brand new week, early morning trade began at a steady pace, opening five pips higher than Friday’s close at 0.9459. With all of the above taken into consideration, we believe price will continue driving south today down to 4hr demand at 0.9397-0.9425. This area no only boasts round-number support at 0.9400 and 61.8% Fibonacci support just above it at 0.9439, it is also sitting on top of the aforementioned daily swap (support) level. Therefore, this zone could provide us a nice platform in which to look for potential long entries into this market today. Although this 4hr demand zone has support from the daily scale, we would still advise waiting for the lower timeframes to prove buying strength exists before risking you hard-earned cash. The reason for why is simply because price could fakeout below 0.9400 and take your stop before rallying higher from this area.
Levels to watch/ live orders:
- Buys: 0.9397-0.9425 [Tentative – confirmation required] (Stop loss: dependent on where one confirms this area).
- Sells: Flat (Stop loss: N/A).
DOW 30:
Weekly recap:
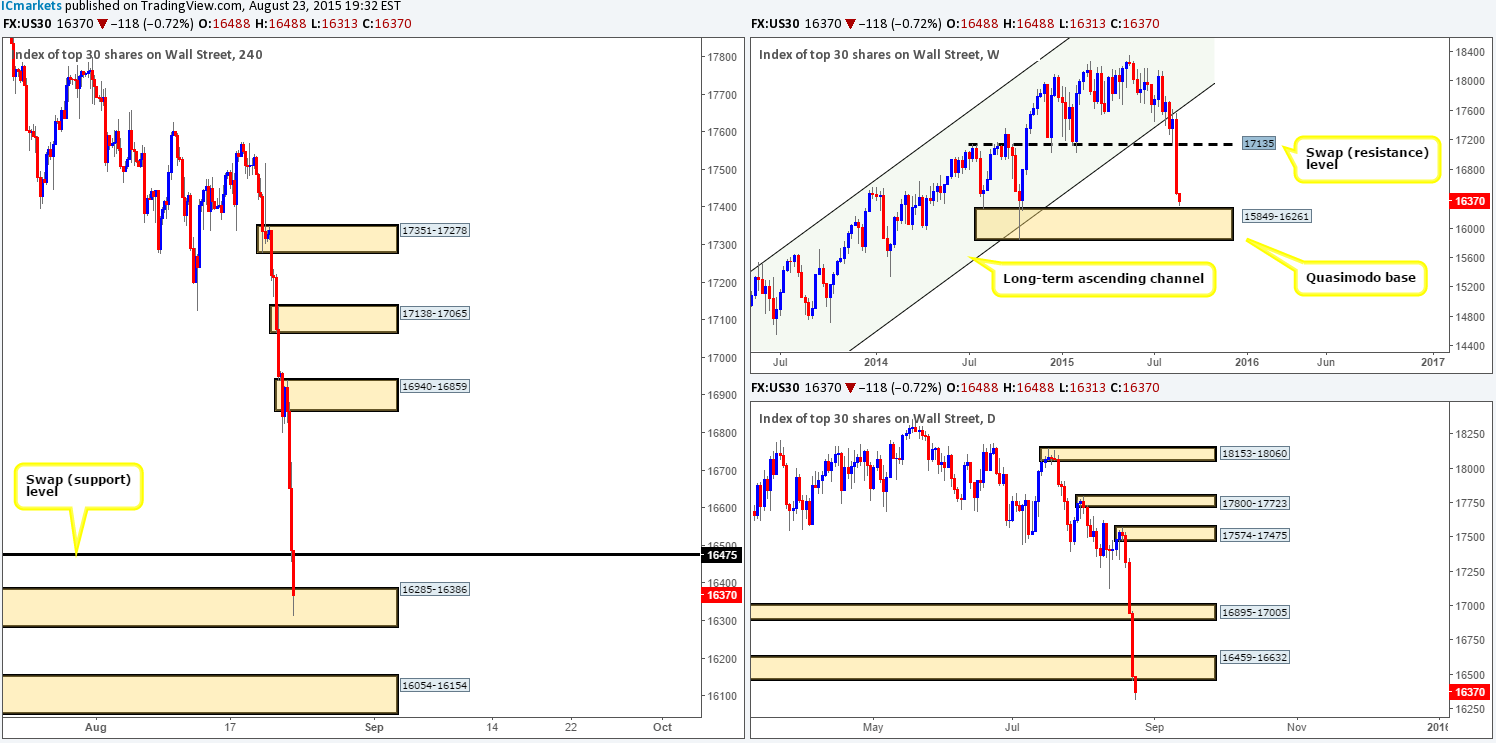
One word sprung to mind when we opened up the charts on the DOW this morning – ouch! Last week’s action saw this market drop a colossal 1000 points into the close 16488, which, as you can see, cleanly took out the weekly swap (support) level at 17135 in the process. Price action on the daily timeframe did not begin selling off until trade opened on Wednesday. This three-day decline in value took out bids sitting at daily demand coming in at 16895-17005, and slam dunked itself deep into another daily demand area coming in at 16459-16632 to end the week.
Weekly outlook (big picture):
With the weekly timeframe showing room for price to continue south this week, we’re not holding out much hope for the daily demand area mentioned above at 16459-16632. Unfortunately, we see very little resistance on the bigger picture to short this market at this time. It will be interesting to see what we find on the 4hr timeframe…
Today’s outlook and review:
From the 4hr chart, it’s clear to see that once the U.S. traders began placing trades; this market was painted red, which continued until price connected with 16475 at the close.
As we enter into a fresh week of trade, the DOW 30 opened at Friday’s closing price, 16488. Following this, offers came into the market pushing price down into a 4hr demand area seen at 16285-16386, which, at the time of writing is holding firm. Considering that price is hovering just above a weekly Quasimodo base at 15849-16261 and the daily demand area at 16459-16632 appears to be consumed, be careful entering long at current 4hr demand. The reason why is because price may want to fill bids sitting at the 4hr demand area lower down at 16054-16154. This is not to say that the current 4hr demand area will not work. We simply feel that because the 4hr demand zone below current price is located within both the aforementioned weekly Quasimodo base, and also just within the daily demand at 16078-15849, it will likely provide a bigger bounce. Therefore, our team has set an alert at 16177, which if triggered will be our cue to begin watching how the lower timeframes respond to this 4hr demand zone.
Levels to watch/ live orders:
- Buys: 16054-16154 [Tentative – confirmation required] (Stop loss: dependent on where one confirms this area).
- Sells: Flat (Stop loss: N/A).
XAU/USD: (Gold)
Weekly recap:
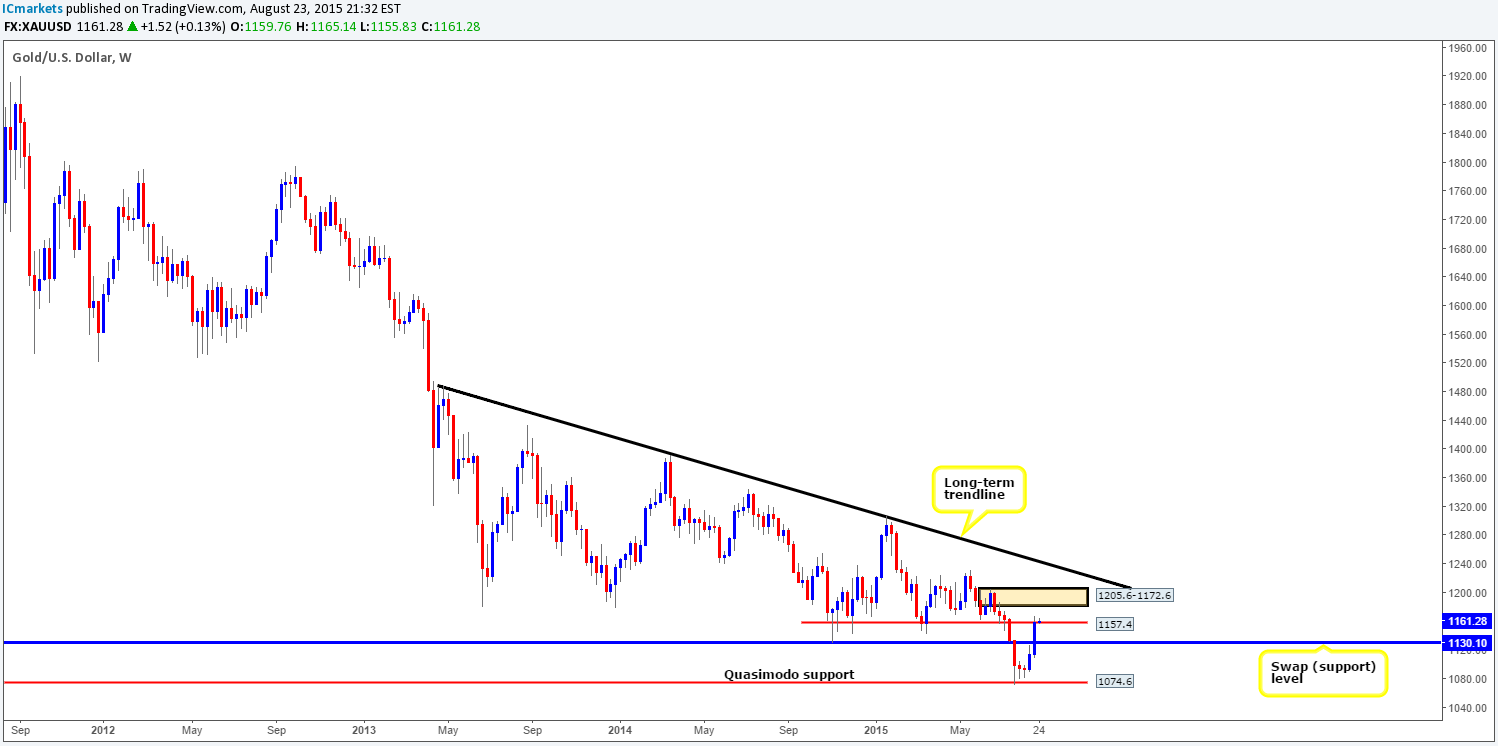
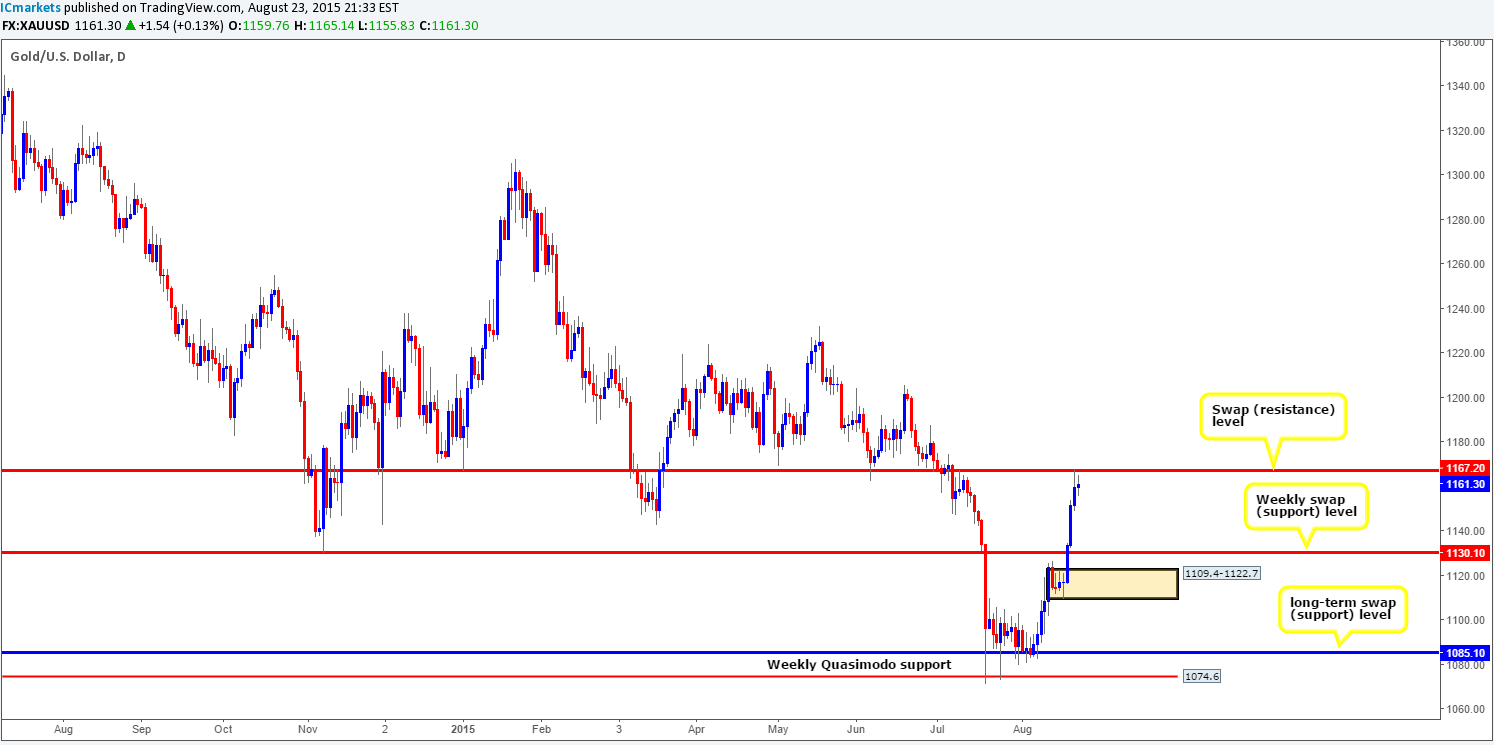
The Gold market enjoyed yet another successful week seeing its value increase by a little over $45 at the close 1159.7. As a consequence, offers positioned around 1130.1 were taken out, which in turn saw price connect and close slightly above a minor weekly swap (resistance) level coming in at 1157.4. From the daily chart, it is clear to see that Gold never really gained consciousness until Wednesday’s trade, which ended with price slightly faking above a daily swap (resistance) level seen at 1167.2 to end the week.
Weekly outlook (big picture):
Regarding the week ahead, it’s difficult to trust the close above the minor weekly swap (resistance) level at 1157.4 as price was seen respecting the daily swap (resistance) level at 1167.2 into the close. Therefore, until we see price CLOSE above 1167.2 we’re going to ‘assume’ a pullback will be seen in this market this week. Downside targets from here come in at the weekly swap (support) level 1130.1, followed closely by daily demand sitting at 1109.4-1122.7.