A note on lower timeframe confirming price action…
Waiting for lower timeframe confirmation is our main tool to confirm strength within higher timeframe zones, and has really been the key to our trading success. It takes a little time to understand the subtle nuances, however, as each trade is never the same, but once you master the rhythm so to speak, you will be saved from countless unnecessary losing trades. The following is a list of what we look for:
- A break/retest of supply or demand dependent on which way you’re trading.
- A trendline break/retest.
- Buying/selling tails – essentially we look for a cluster of very obvious spikes off of lower timeframe support and resistance levels within the higher timeframe zone.
- Candlestick patterns. We tend to only stick with pin bars and engulfing bars as these have proven to be the most effective.
EUR/USD:
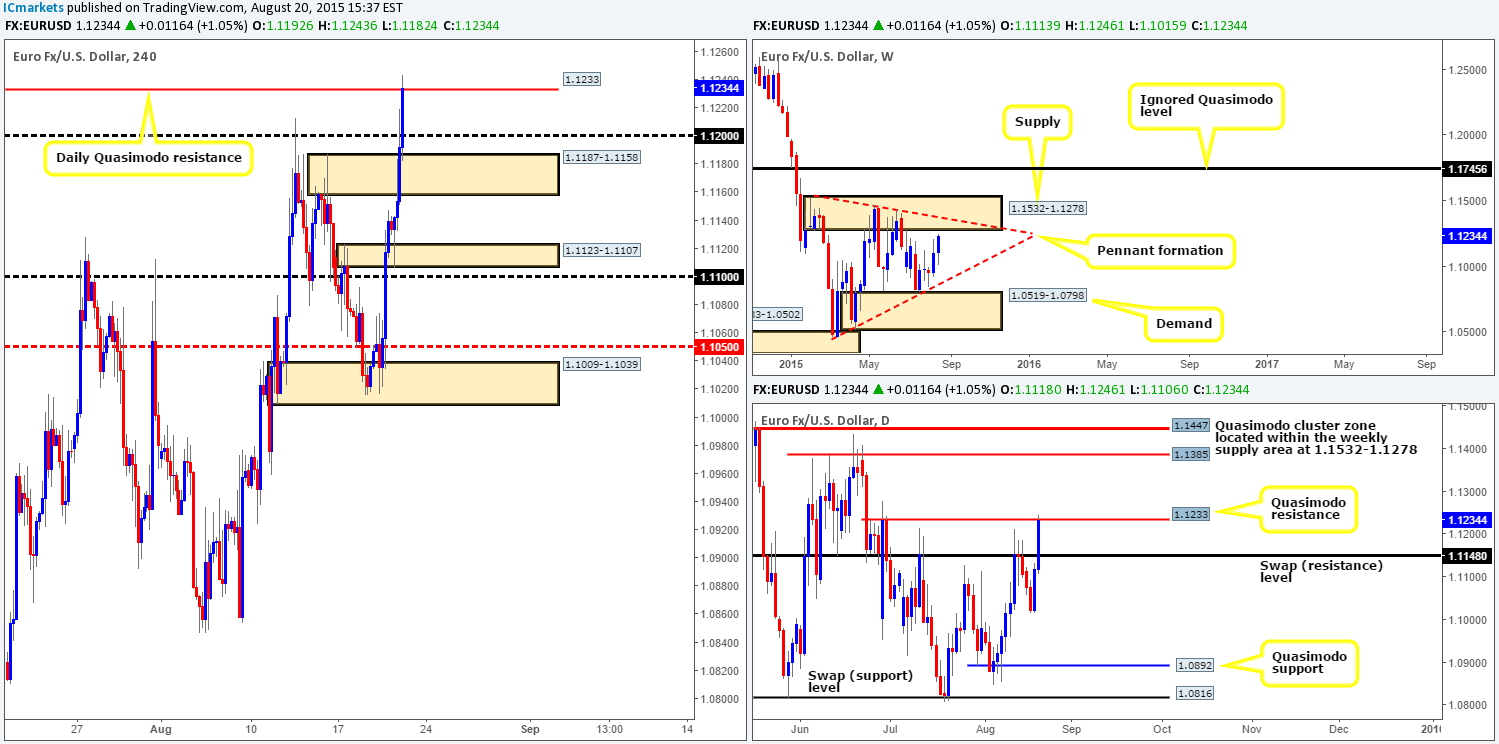
This morning’s analysis will kick-off with a look at the weekly timeframe, which, as you can see, shows price currently steaming north towards weekly supply coming in at 1.1532-1.1278. Meanwhile, looking down to its smaller brother, the daily timeframe, price action is currently kissing a daily Quasimodo resistance level seen at 1.1233.
Slipping down one lower to the 4hr timeframe, we can see that the buyers appear strong around the aforementioned daily Quasimodo level. In the event that the current 4hr candle closes above this number, the river north should be ‘ripple free’ so to speak up to a small 4hr supply zone at 1.1346-1.1319. A strong close above would, in effect, be our cue to begin watching for price to retest this number as support and show some form of lower timeframe confirmation to enter long.
Should 1.1233 be respected, nevertheless, the next downside target to keep an eye on is the 1.1200 handle, followed closely by 1.1187-1.1158 – a 4hr swap (demand) area. As you can see the take-profit zones are relatively close, as such, for us to consider selling the EUR currency, we’d need one of the following to take place:
- Selling confirmation from the smaller timeframes (five minute and lower). This would allow us to potentially enter with a tight stop and still give reasonable risk/reward down to 1.1200.
- A push below 1.1200 and a deep dive into 1.1187-1.1158. Following this, price would need to retrace back up to the 1.1233 region for a short entry. Our rationale behind this approach is that the majority of the bids will likely have been taken out within the above said 4hr areas so one could look to short should a retrace be seen. Just to be on the safe side though, we’d still require lower timeframe confirmation on the retrace before risking capital in this market.
Levels to watch/live orders:
- Buys: Watch for offers at 1.1233 to be consumed and then look to enter on a retest at this area (confirmation required).
- Sells: 1.1233 [Tentative – confirmation required] (Stop loss: dependent on where one confirms this level).
GBP/USD:
At the time of writing, the GBP/USD pair remains trading around distinct higher timeframe resistance points. The weekly chart shows price currently kissing the underside of a weekly trendline resistance (1.7166), while the daily chart shows price respecting a daily supply area at 1.5787-1.5687. Overall though, we have seen very little enthusiasm from the sellers at these levels over the past three trading days.
The 4hr timeframe on the other hand did show a quick spurge of selling going into the London session yesterday. This brought prices below the 4hr swap (demand) area at 1.5674-1.5642, which quickly rebounded from just above 1.5600 back up to the lower limits of the 4hr supply at 1.5731-1.5700.
With selling weakness now being seen on the higher timeframe structures and the 4hr timeframe not showing any obvious opportunity to trade right now, our team’s position will remain flat going into today’s sessions.

Levels to watch/ live orders:
- Buys: Flat (Stop loss: N/A).
- Sells: Flat (Stop loss: N/A).
AUD/USD:
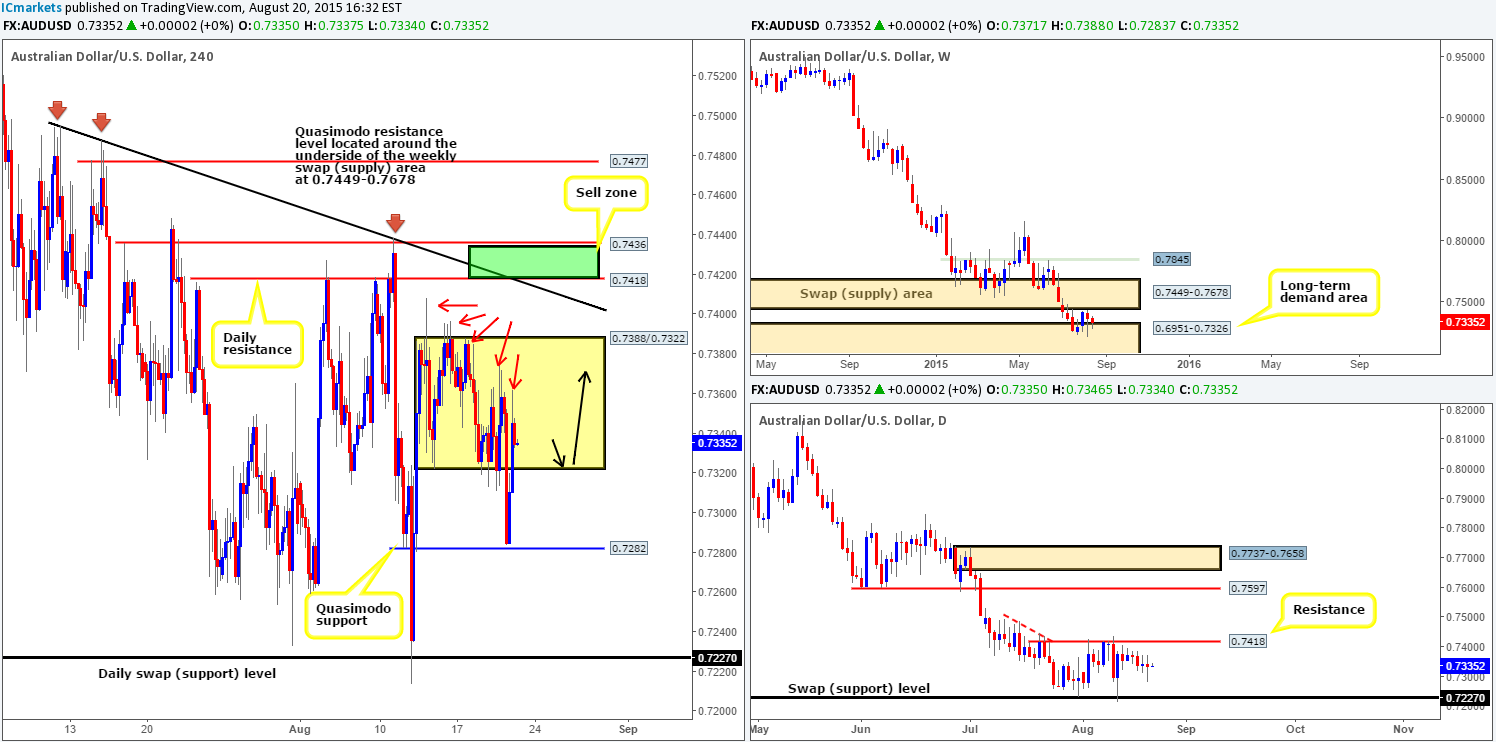
During the course of yesterday’s sessions the AUD fell sharply going into the early hours of European trade. This move took out bids at the 4hr range low 0.7322, and aggressively connected just above a 4hr Quasimodo support barrier at 0.7282. The buyers, as you can see were quick to react here, pushing the Aussie over 60 pips higher back up into the current 4hr range (0.7388/0.7322) into the close 0.7335.
With the weekly timeframe now hugging the top-side of a long-term weekly demand at 0.6951-0.7326, and daily action showing price trading mid-range between 0.7418 and 0.7227, where do we see this market heading today? Well, speaking purely from a technician’s point of view, we feel price may head north before closing out the week. Here’s why:
- Price is currently reacting from the aforementioned long-term weekly demand zone.
- Yesterday’s deep fakeout below the 4hr range took a lot of money to achieve, which, as far as we’re aware, only pro-money can afford to do. With this, there were likely unfilled bids left at the lower limit 0.7322 when price broke through offers to re-enter the 4hr consolidation. Therefore, as per the black arrows, price may drop lower to connect with these unfilled orders and rally higher.
- Above current price marked with red arrows is what we recognize as consumed supply. Check out the very obvious supply consumption wicks seen at 0.7362/0.7374/0.7388/0.7396/0.7408.
Nevertheless, seeing as this pair is still in one humongous downtrend at the moment, we’d highly recommend waiting for the lower timeframes to prove there is buying strength at 0.7322 before committing capital. Should we manage to spot a lower timeframe buy entry here today, targets for this trade will be the underside of the 4hr down trendline (0.7495), followed closely by 0.7418/0.7436 – a clear sell zone!
Levels to watch/ live orders:
- Buys: 0.7322 [Tentative – confirmation required] (Stop loss: dependent on where one confirms this level).
- Sells: 0.7418/0.7436 [Tentative – confirmation required] (Stop loss: dependent on where one finds confirmation within this area)
USD/JPY:
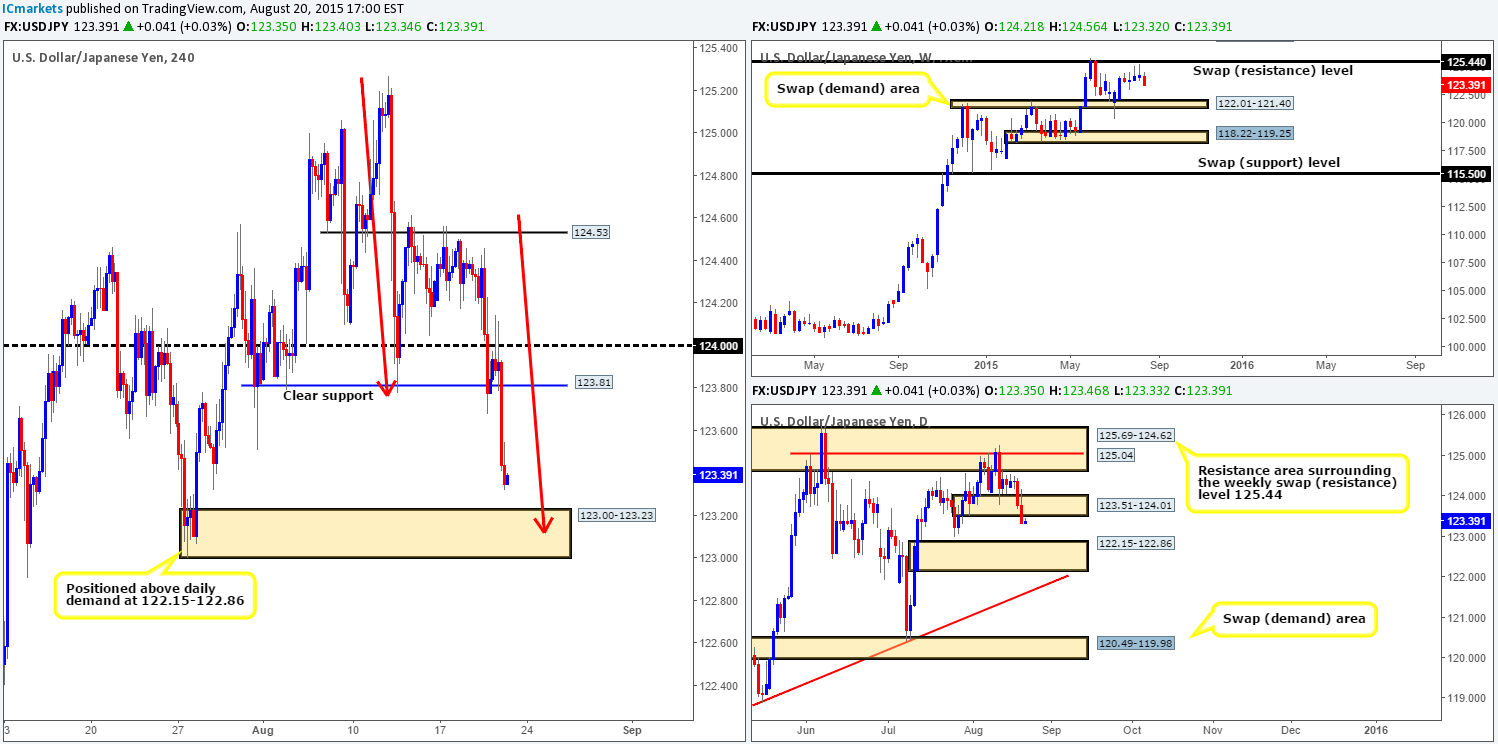
For those who read our previous report on the USD/JPY http://www.icmarkets.com/blog/thursday-20th-august-daily-technical-outlook-and-review/ you may recall that we mentioned to watch for lower timeframe selling confirmation in between 123.81/124.00. As you can see, price responded beautifully to 124.00 with two clear selling wicks. It was after the close of the second candle (123.92) that we decided to enter short at market. Shortly after price dropped like a rock and is at the time of writing close to hitting 123.25 – our take-profit level just above the 4hr demand area at 123.00-123.23.
In that price is now trading just above a 4hr demand area at the moment, would this be a tradable zone going into today’s sessions? In favor of going long from here, we have the following noted:
- AB=CD pattern completion point around the 123.12 mark – see red arrows.
- Psychological support coming in at 123.00.
- Positioned just above daily demand at 122.15-122.86.
The above points, in our opinion, are not enough to set a pending buy order at the current 4hr demand since the following may play against a buy in this market:
- There is space for price to move lower on the weekly timeframe down to the weekly swap (demand) area at 122.01-121.40.
- The daily demand zone (see above) positioned just below our current 4hr demand area may act as a magnet to price – one would need to at the very least to expect a fakeout lower.
So, with the above in mind, our team has decided that once/if price reaches the aforementioned 4hr demand zone; our current short position will be closed and we’ll begin watching the lower timeframes for CONFIRMATION to enter long.
Levels to watch/ live orders:
- Buys: 123.00-123.23 [Tentative – confirmation required] (Stop loss: dependent on where confirms this area).
- Sells: 123.901 [LIVE] (Stop loss: still currently at breakeven).
USD/CAD:
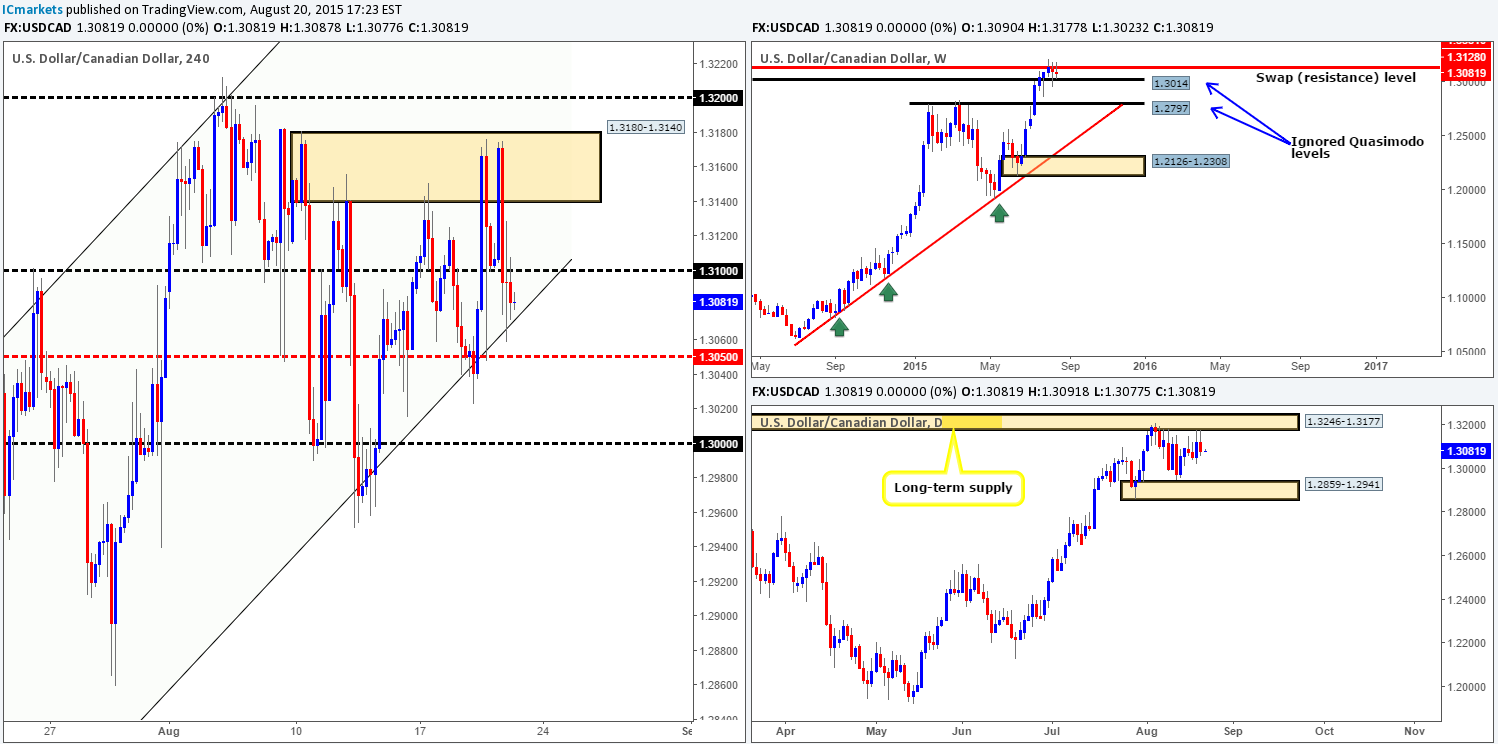
Recent events on the USD/CAD show price found supportive pressure at 1.3100 early on in yesterday’s trade. This saw price reach highs of 1.3175 before aggressively selling off past 1.3100 into support provided by the 4hr ascending channel line taken from the low 1.2536.
Now, buying from this 4hr ascending channel support has worked very well in the past, but we are still hesitant here. The reasons for why are as follows:
- The weekly action shows price tightly jammed between an ignored weekly Quasimodo support level at 1.2797 and a weekly swap (resistance) level at 1.3128.
- Yesterday saw price rebound once again from a long-term daily supply zone coming in at 1.3246-1.3177.
- Psychological resistance looming just above at 1.3100.
The above points are enough to turn us off buying this market. Even if price breaks above 1.3100 and retests it as support, near-term supply is sitting just forty pips above at 1.3180-1.3140. One would need a relatively tight stop to achieve reasonable risk/reward from this angle. Therefore, with all of the above taken into consideration, opting to stand on the side lines here may very well be the best position to take.
Levels to watch/ live orders:
- Buys: Flat (Stop loss: N/A).
- Sells: Flat (Stop loss: N/A).
USD/CHF:
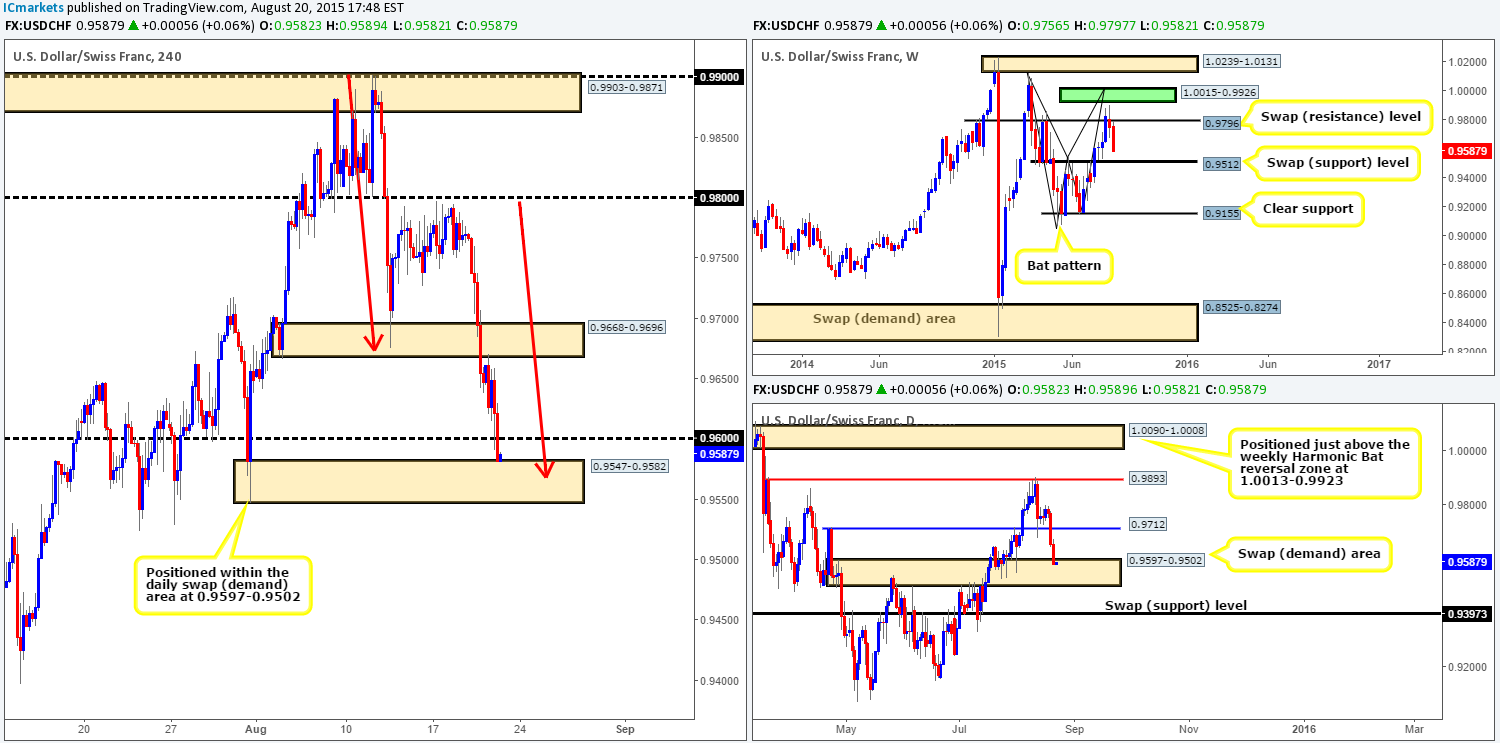
For those who follow our analysis on a regular basis, you may have caught us mentioning to keep a close eye on the recently broken 4hr demand zone at 0.9668-0.9696 for potential sells. Yesterday’s price action responded beautifully to this area, pulling price down to 0.9600 and eventually the 4hr demand zone at 0.9547-0.9582 (located within the daily swap [demand] area at 0.9597-0.9502). Since we were already short the USD on the USD/JPY trade (see above), we left this one alone. Well done to any of our readers who did manage a short from here though!
In view of price trading at a 4hr demand zone that’s backed by a daily area, is this somewhere we’d consider stable enough zone to enter long from today? Much like the USD/JPY, there is an AB=CD pattern completion point within this area around the 0.9567 mark – see red arrows. However, even with this and the fact that there is supporting daily demand behind this 4hr zone, the weekly timeframe still shows room to continue lower until the weekly swap (support) level at 0.9796.
Given these points, our team is happy to enter long at the current 4hr demand if we see price close above and retest the near-term psychological resistance at 0.9600. Targets for this trade fall in at the mid-level number 0.9650 and the 4hr swap (supply) zone coming in just above at 0.9668-0.9696.
Levels to watch/ live orders:
- Buys: 0.9547-0.9582 [Tentative – wait for price to close above and retest 0.9600 before considering entering long] (Stop loss: likely below 4hr demand at 0.9543).
- Sells: Flat (Stop loss: N/A).
DOW 30:
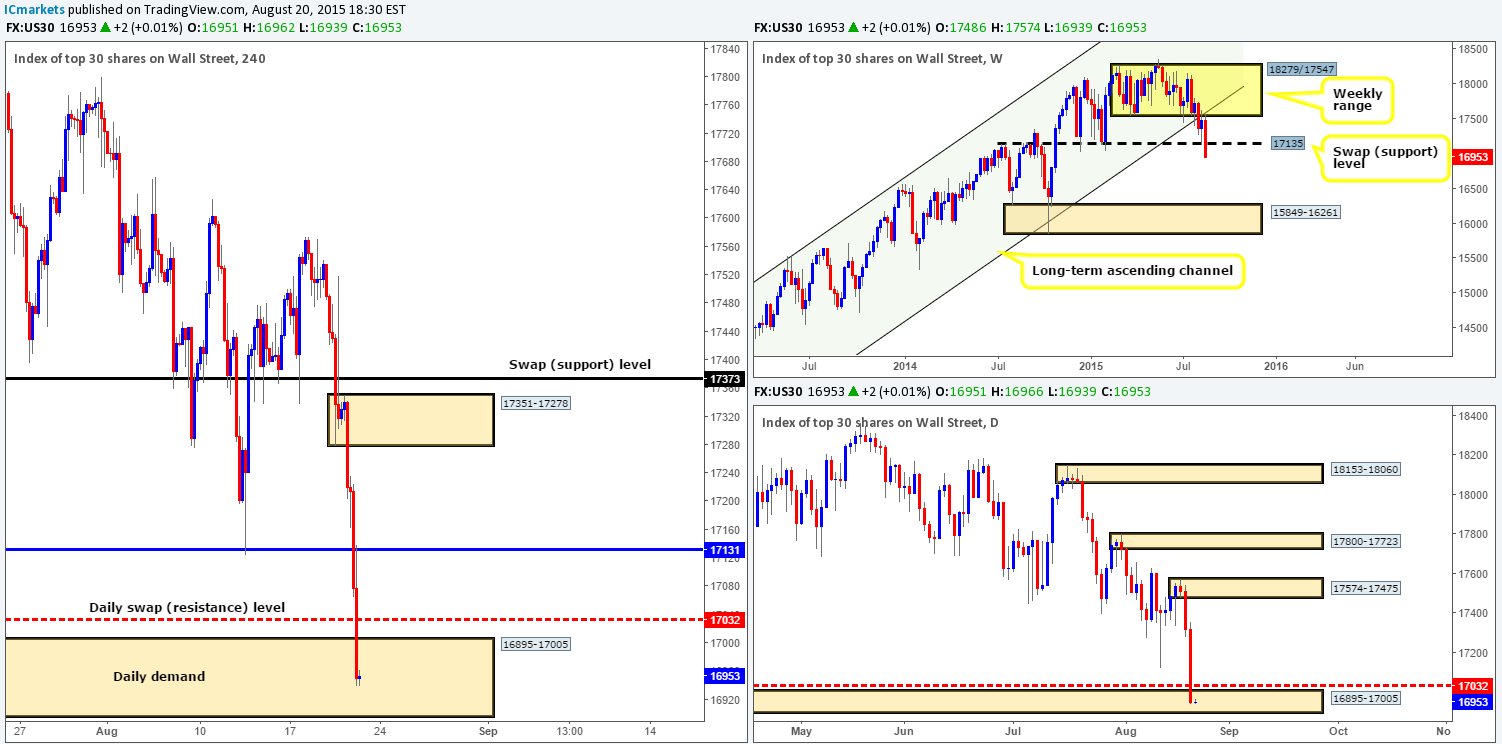
Beginning with the weekly timeframe this morning, we can see price is currently trading below a weekly swap (support) level at 17135. Assuming that a close below this level is seen this week, this could suggest further downside towards a weekly Quasimodo area coming in at 15849-16261. Daily action on the other hand, shows price now trading within daily demand at 16895-17005. However, before we all go hitting the buy button, looming just above this zone is a daily swap (resistance) level at 17032.
Moving down to the 4hr timeframe, price action shows that the next barrier of concern, other than 17032 is 17131 – a former 4hr Quasimodo support level. In that event, our approach to this market will be centered on the daily swap (resistance) level at 17032 today. Should price close above this hurdle and firmly retest it as support, there may be a possible long trade on the retest of this number up to 17131. On the other hand, if price respects 17032 as resistance, we could be in for a further decline in value, where at which point we’d be trading side-by side with the weekly timeframe (see above). Entering either long or short at 17032 will, at least for us anyway, require lower timeframe confirmation before risking capital in this market.
Levels to watch/ live orders:
- Buys: 16895-17005 [wait for price to close above and retest 17032 before considering any longs in this market] (Stop loss: dependent on how deep price retraces following a close higher).
- Sells: 17032 [Tentative – confirmation required] (Stop loss: dependent on where one confirms this level).
XAU/USD: (Gold)
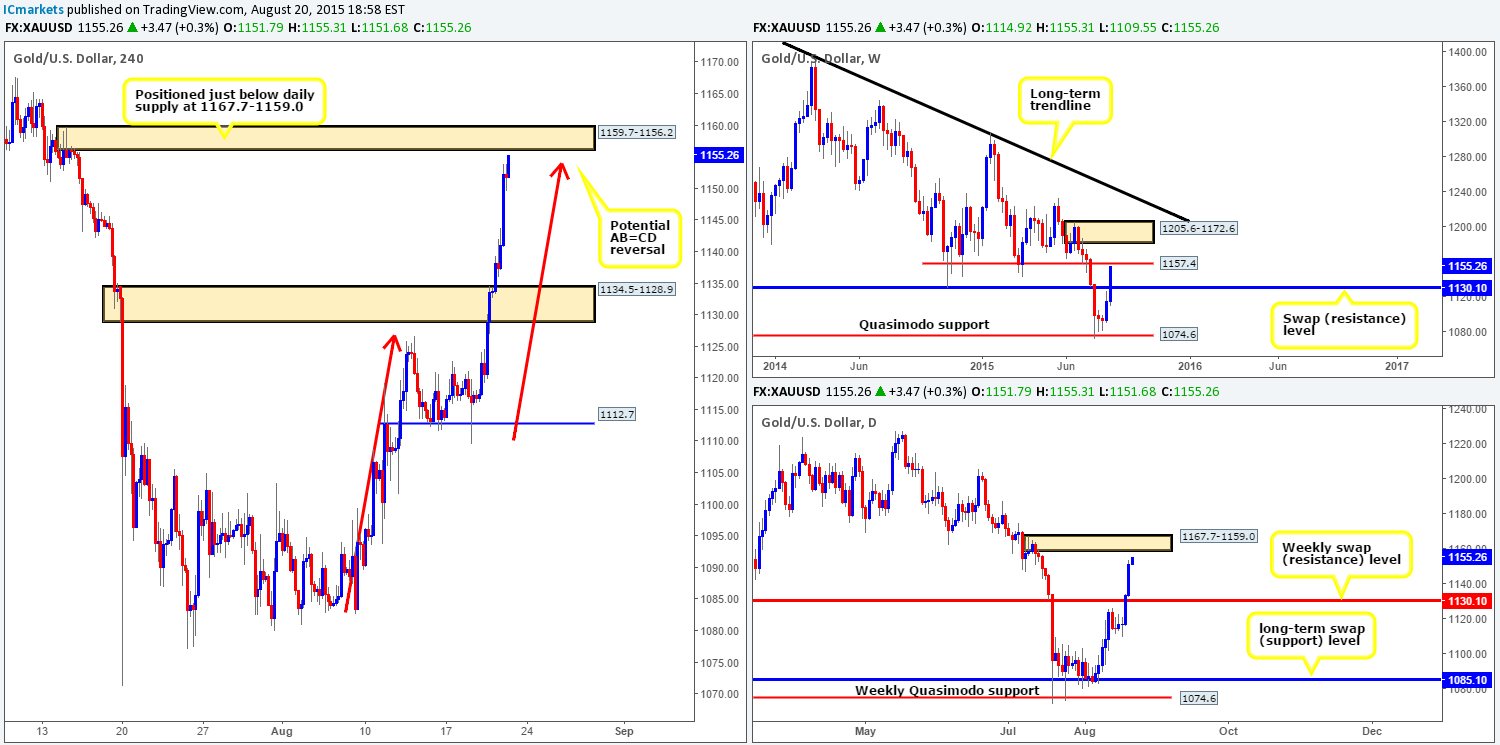
Looking at the weekly timeframe, we can see that price is trading strongly above the weekly swap (resistance) level at 1130.1, and is very near to connecting with the weekly swap (resistance) level at 1157.4. Meanwhile, following the close above the aforementioned weekly swap (resistance) level on the daily timeframe, price extended higher yesterday, closing the day within shouting distance of a daily supply zone at 1167.7-1159.0.
Turning our attention to the 4hr timeframe reveals that yesterday’s drive higher forced price to take out offers sitting within 4hr supply at 1134.5-1128.9, which saw Gold reach highs of 1153.9 on the day. Consequent to this, price is now lurking just below a 4hr supply zone at 1159.7-1156.2. This area not only boasts a potential AB=CD correction zone just below at 1154.2, but is also positioned just beneath the aforementioned daily supply area.
On account of the above, all eyes will be on the 1159.7-1156.2 area today. It is totally down to each individual trader whether he/she waits for selling confirmation here. We, however, have chosen to since there is the possibility price may fake above our 4hr supply area to connect with the extremes within the aforementioned daily supply zone.
Levels to watch/ live orders:
- Buys: Flat (Stop loss: N/A).
- Sells: 1159.7-1156.2 [Tentative – confirmation required] (Stop loss: dependent on where one finds confirmation within this area).