
Key risk events today:
French Flash Services PMI; French Flash Manufacturing PMI; German Flash Manufacturing PMI; German Flash Services PMI; EUR Flash Manufacturing PMI; EUR Flash Services PMI; MPC Member Tenreyro Speaks; ECB President Draghi Speaks; US Flash Manufacturing PMI; FOMC Members Williams and Bullard Speak.
EUR/USD:
Weekly gain/loss: -0.50%
Weekly close: 1.1017
Weekly perspective:
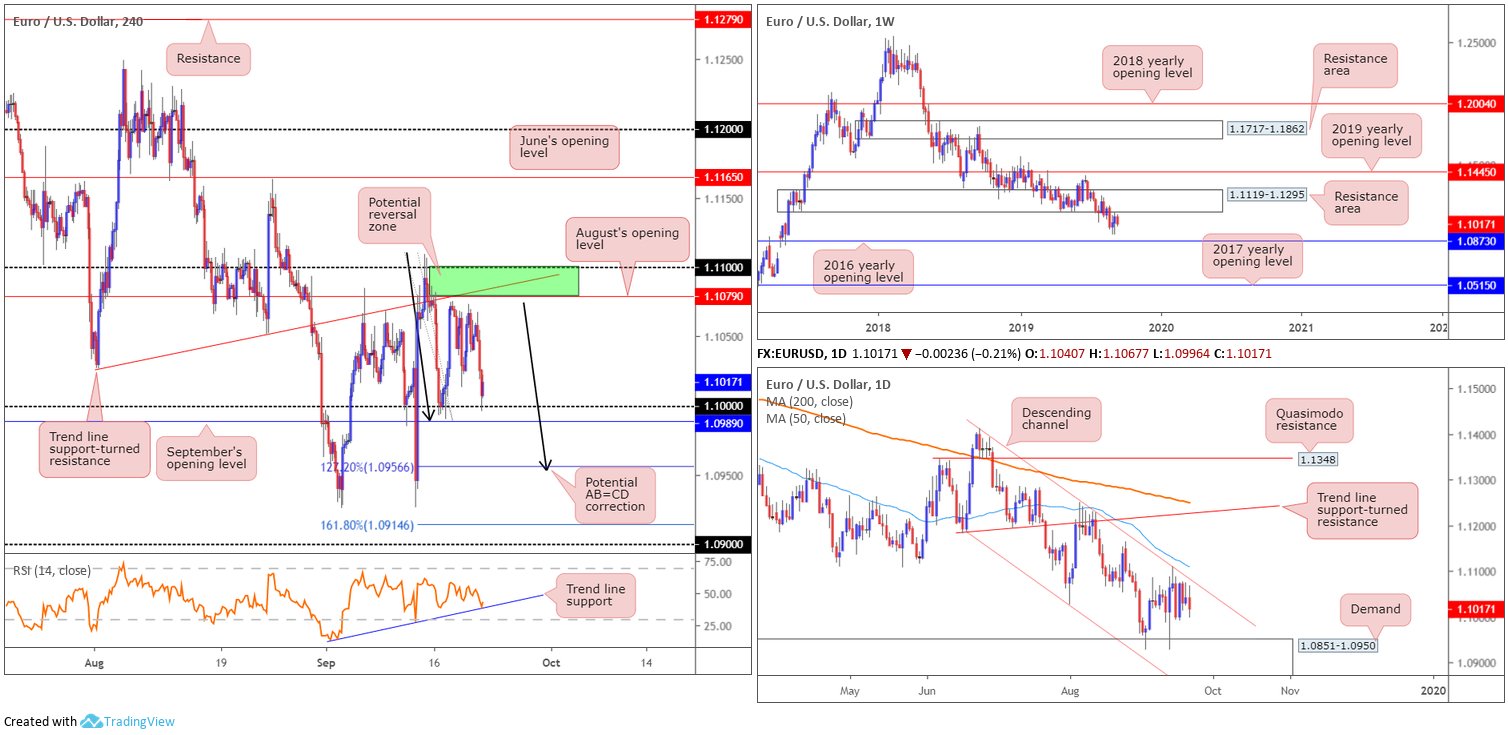
Leaving the underside of long-standing demand-turned resistance at 1.1119-1.1295 unchallenged, last week’s movement shifted lower, snapping a two-week recovery and erasing more than 50 points. The next downside target remains set at the 2016 yearly opening level drawn from 1.0873.
Concerning trend direction, since topping in early 2018 at 1.2555, the long-term trend remains facing a southerly bearing.
Daily perspective:
Daily activity was somewhat monotonous last week, with most of the action limited to Monday’s range set a few points south of channel resistance taken from the high 1.1412. Demand pencilled in at 1.0851-1.0950 – houses the 2016 yearly opening level inside its lower bounds – is fixed as the next downside target this week, whereas a break of the said channel formation exposes the 50-day SMA (blue), followed by a possible run to trend line support-turned resistance extended from the low 1.1181.
H4 perspective:
Friday had Europe’s single currency a shade lower against its US counterpart, down 0.21% on the day. Price action on the H4 timeframe left August’s opening level at 1.1079 unopposed and concluded the session drawing key figure 1.10 back into the fray, shadowed closely by September’s opening level at 1.0989.
In the event we turn higher this week, 1.1079 remains in focus, as well as trend line support-turned resistance (etched from the low 1.1032) and round number 1.11 (green). However, before reaching this area traders must contend with daily channel resistance mentioned above (1.1412).
Beneath 1.10, a potential 127.2% AB=CD formation may complete around 1.0956, fixed a couple of points north of daily demand highlighted above at 1.0851-1.0950.
Indicator-based traders may wish to note the RSI closed at 43.27, though the line is displaying a trend line support (blue) which dovetails reasonably nicely with the bounce off 1.10.
Areas of consideration:
The green zone on the H4 timeframe between the 1.11 handle, trend line support-turned resistance and August’s opening level at 1.1079 remains a likely area of interest for possible shorting opportunities this week. That is, of course, if we can slightly penetrate daily channel resistance. For those looking to press this bearish theme, the research team recommends waiting for additional H4 candlestick structure to form before pulling the trigger (entry/risk can be determined according to this pattern). This is largely due to the threat of a stop run materialising through 1.11 to the underside of the weekly resistance area mentioned above at 1.1119-1.1295.
With both weekly and daily timeframes exhibiting scope to the downside, entering off 1.10, although could work, is precarious. The top edge of daily demand at 1.0950, coupled with the H4 AB=CD completion, is more appealing from a technical perspective, according to our chart studies. Whether traders feel confident enough to long this area at 1.0950 without the need for additional confirmation is trader dependent, though waiting for at least candlestick confirmation may be worth considering.
GBP/USD:
Weekly gain/loss: -0.20%
Weekly close: 1.2469
Weekly perspective:
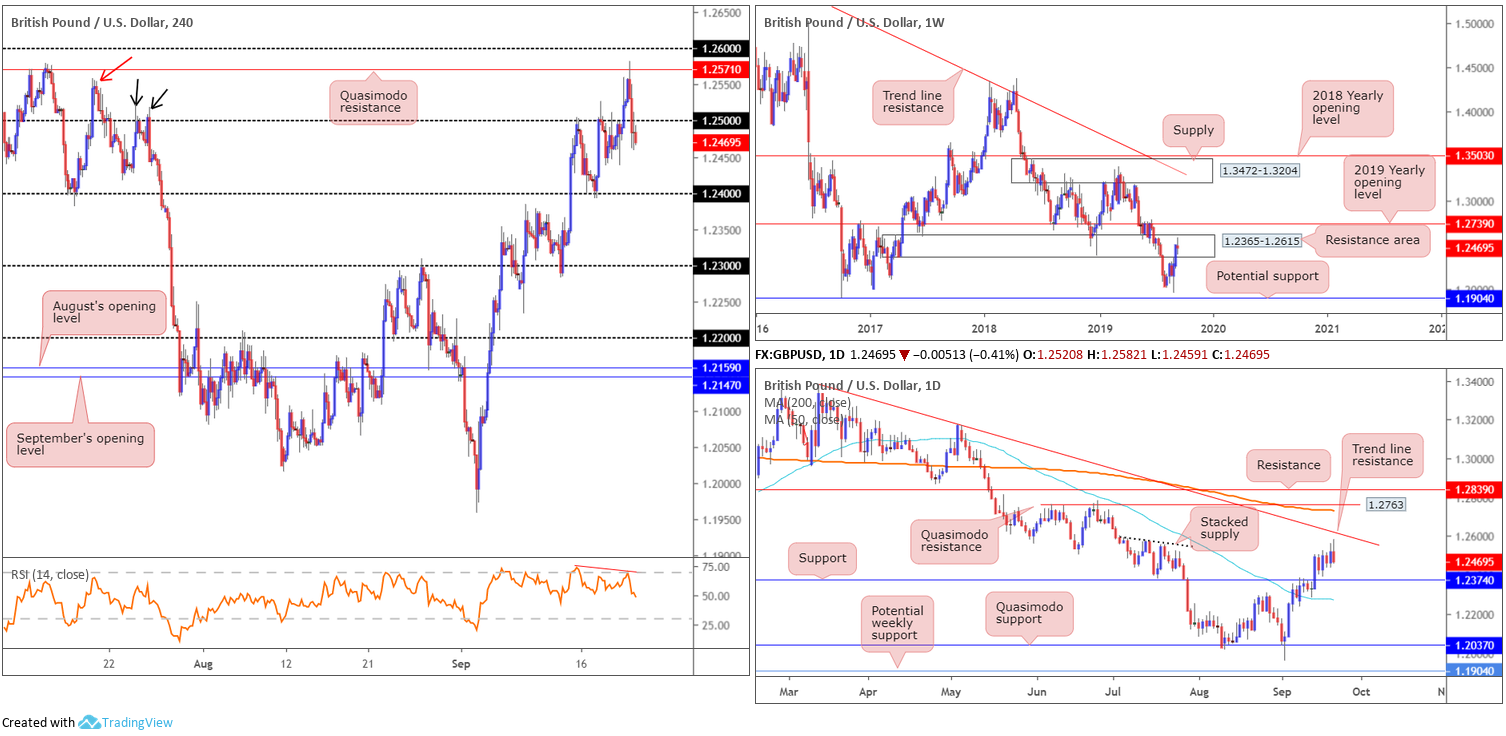
Following a sizeable bullish outside week that pitched price action into the walls of a long-term resistance area coming in at 1.2365-1.2615 the following week, last week’s flow saw a pause in momentum. Although this zone is expected to produce something to the downside, traders are urged to pencil in the 2019 yearly opening level at 1.2739, in the event we press for higher ground this week.
Daily perspective:
Friday witnessed the unit enter the upper limit of stacked supply positioned between 1.2591/1.2475, and come within striking distance of trend line resistance etched from the high 1.3380, before turning southbound. Continued selling may call for a run to a well-placed support level at 1.2374, whereas a move that places action above the said trend line resistance could observe price close in on its 200-day SMA (orange).
H4 perspective:
Optimism over EU’s Juncker’s comments regarding the possibility of a breakthrough on the Irish backstop turned out to be reasonably short lived. The British pound decisively switched lower vs. the dollar Friday following various EU officials claiming the UK has still not delivered proposals compatible with the principles of the existing Withdrawal Agreement.
For traders who read Friday’s technical briefing (italicised) you may recall the following pieces from the H4 timeframe:
Technically, we concluded the session north of the 1.25 handle on the H4 timeframe, exposing Quasimodo resistance at 1.2571, closely followed by 1.26. As aired in Thursday’s briefing, the high 1.2558 (red arrow), and the highs set beneath it (black arrows) at 1.2522ish, likely have buy stops plotted above. This may help provide liquidity to sell the said Quasimodo resistance.
H4 Quasimodo resistance is considered a sell zone given it being located within the walls of the said weekly resistance area and has H4 liquidity pockets (set above highs on approach) below it in the form of buy stops to sell into. Traders are urged to wait for a H4 bearish candlestick pattern (entry/risk can be set according to this structure) to form before pulling the trigger, as not only is daily price eyeing levels around 1.2617 (the daily trend line resistance), the 1.26 handle is likely to act as a magnet to price.
Areas of consideration:
While H4 price failed to print a recognisable bearish candlestick formation off the said H4 Quasimodo resistance, the rejecting candlestick was strong and covered more than 50% of the previous bullish candle. Well done to any of our readers who managed to jump aboard this move.
With 1.25 consumed on the H4 scale, a retest, preferably in the shape of a bearish candlestick configuration (entry and risk can be set according to this pattern), of this level as resistance could be a potential setup to have on the radar this week. 1.24 is fixed as the initial downside target, closely tailed by daily support underscored above at 1.2374.
AUD/USD:
Weekly gain/loss: -1.70%
Weekly close: 0.6762
Weekly perspective:
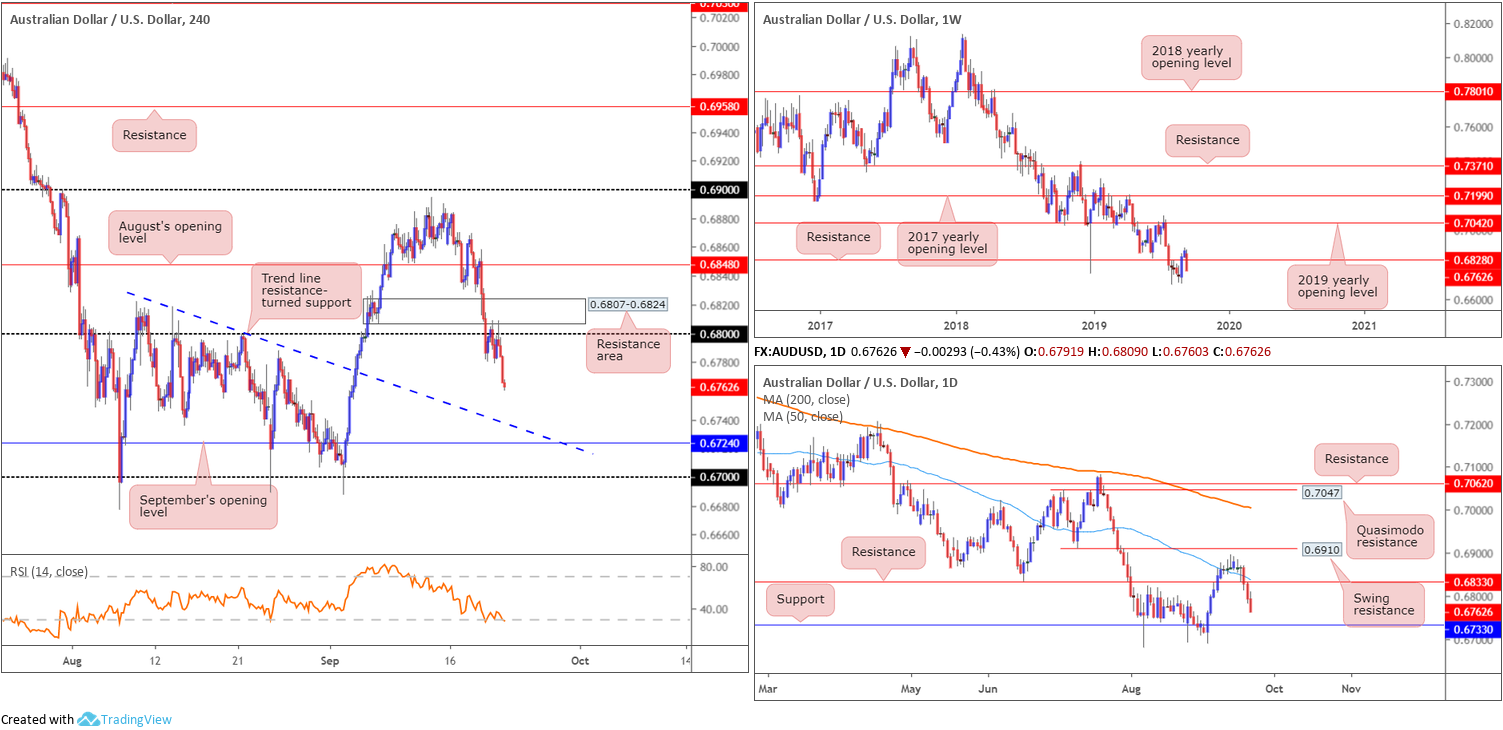
The Australian dollar glided back into negative territory against the buck last week, consequently suspending hopes of a continuation towards the 2019 yearly opening level at 0.7042.
Having witnessed the pair reclaim support at 0.6828 to the downside in reasonably strong fashion last week, leaving price action closing on its lows, further downside potentially has 0.6677 in sight, the YTD low.
Daily perspective:
Despite a fleeting spell north of the 50-day SMA (blue), price action displayed a sharp change in mood last week and resumed control of the said SMA along with support (now acting resistance) at 0.6833. This exposed support carved from 0.6733 as a possible base this week.
H4 perspective:
Trade-related headlines, along with a modest USD bid, weighed on the commodity-linked currency Friday, down 0.43%.
Traders who read Friday’s technical report (italicised) may recall the following:
Keeping things simple this morning, all three timeframes analysed portend a move lower, with shorts based off the H4 bearish outside pattern formed from the underside of a H4 demand-turned resistance area at 0.6807-0.6824. As for downside targets, either the H4 trend line resistance-turned support (drawn from the high 0.6818) or daily support at 0.6733 offers a logical starting point, whichever hits first.
Areas of consideration:
Well done to any of our readers who managed to jump onboard Friday’s decline. As of current price, this might be a good opportunity to consider reducing risk to breakeven, with the prospect of the initial target being achieved (see above in bold) today/early this week.
Aside from the current short in motion, the research team has little else to hang its hat on in terms of high-probability setups at the moment.
USD/JPY:
Weekly gain/loss: -0.49%
Weekly close: 107.53
Weekly perspective:
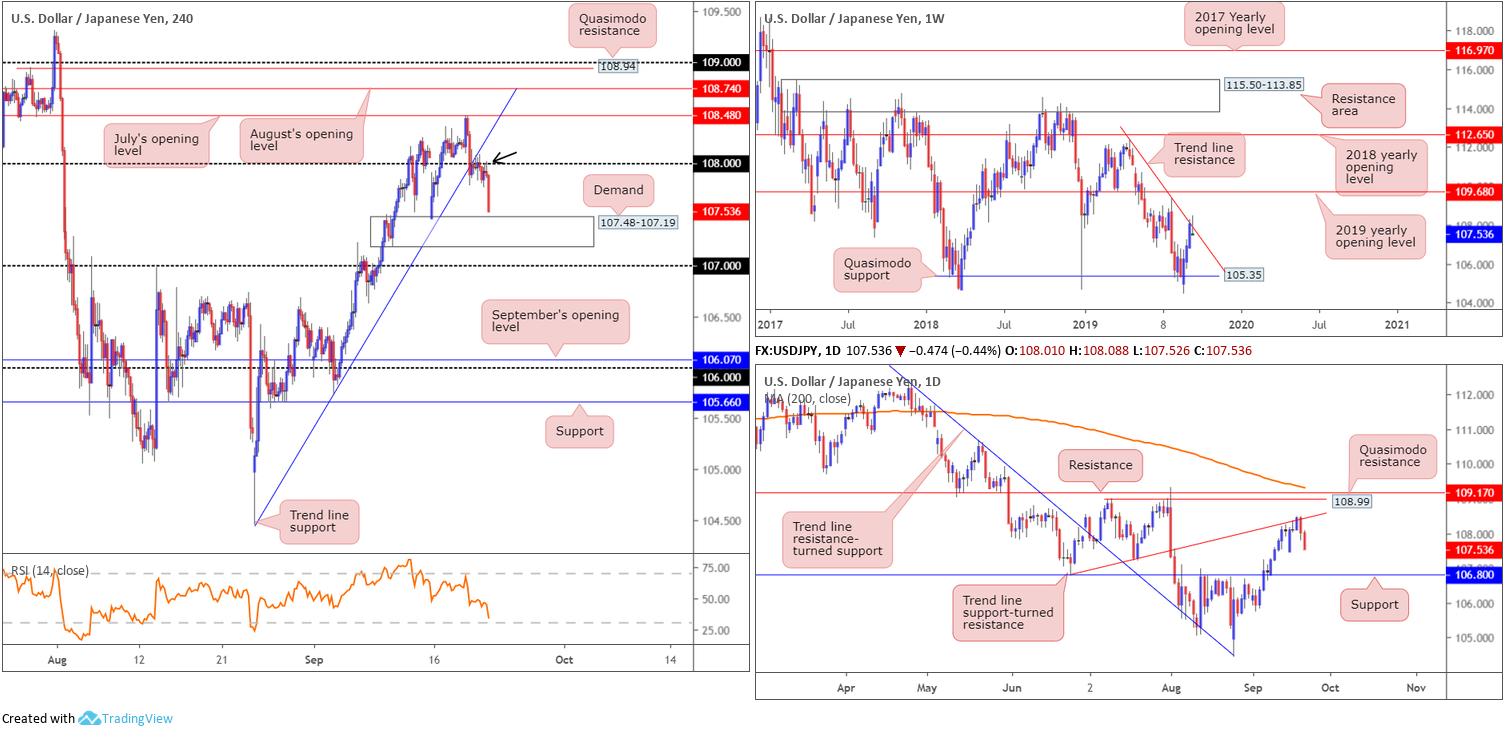
The recovery from Quasimodo support at 105.35 has so far been impressive, shaped by three back-to-back bullish closes. Last week’s movement, nevertheless, proposes a pause in momentum may be in store, formed by way of a shooting star candlestick pattern off trend line resistance (extended from the high 112.40).
Additional upside could see the 2019 yearly opening level at 109.68 enter the mix, though a reaction off the 109.31 high may also occur.
Daily perspective:
Trend line support-turned resistance (extended from the low 106.78) recently made an appearance and saw price action form a bearish engulfing formation Thursday, followed by additional selling Friday. Support at 106.80 is eyed as the next downside target on this scale, which, as you can see, boasts strong history since the end of June.
H4 perspective:
Major US equity indexes clocked fresh lows Friday, as did the 10-year US Treasury note, after Chinese officials cancelled a visit to view US agriculture. This consequently increased demand for safe-haven assets, such as the Japanese yen.
Traders who read Friday’s technical research (italicised) may recall the following:
Thursday’s downside move witnessed the H4 candles dethrone not only a steep trend line support (taken from the low 104.44), but also the 108 handle. Although early trade sees H4 action trading a touch back above 108, the next port of call in terms of support falls in around demand at 107.48-107.19, sited a few points north of 107.
The break of the H4 trend line support along with the 108 handle signals a possible shift in sentiment. Couple this with trend line resistances identified on the weekly and daily timeframes as well as a daily bearish engulfing candlestick pattern, focus shifts to selling today.
Ultimately, though, before pulling the trigger, traders are urged to consider waiting for signs of seller intent to form at the underside of 108 in the mould of a H4 bearish candlestick structure (entry and risk can be calculated on the back of this range), with H4 demand at 107.48-107.19 set the initial take-profit target.
As evident from the H4 timeframe, the candles chalked up a shooting star pattern off 108 Friday, which also immersed the previous candle’s range (an outside setting – black arrow). This followed through with a strong downside move. Well done to any of our readers who boarded the push lower, as price action closed a few points ahead of demand mentioned above at 107.48-107.19.
Areas of consideration:
Traders short 108 might want to consider reducing risk to breakeven and liquidating a portion of the position at the said H4 demand. Given both weekly and daily timeframes exhibit potential to push as far south as daily support at 106.80, though, holding the position to here is an option.
Unless we retest 108 before engaging with H4 demand (highly unlikely), the market offers limited trading opportunity as of current price, based on our chart studies.
USD/CAD:
Weekly gain/loss: -0.17%
Weekly close: 1.3262
Weekly perspective:
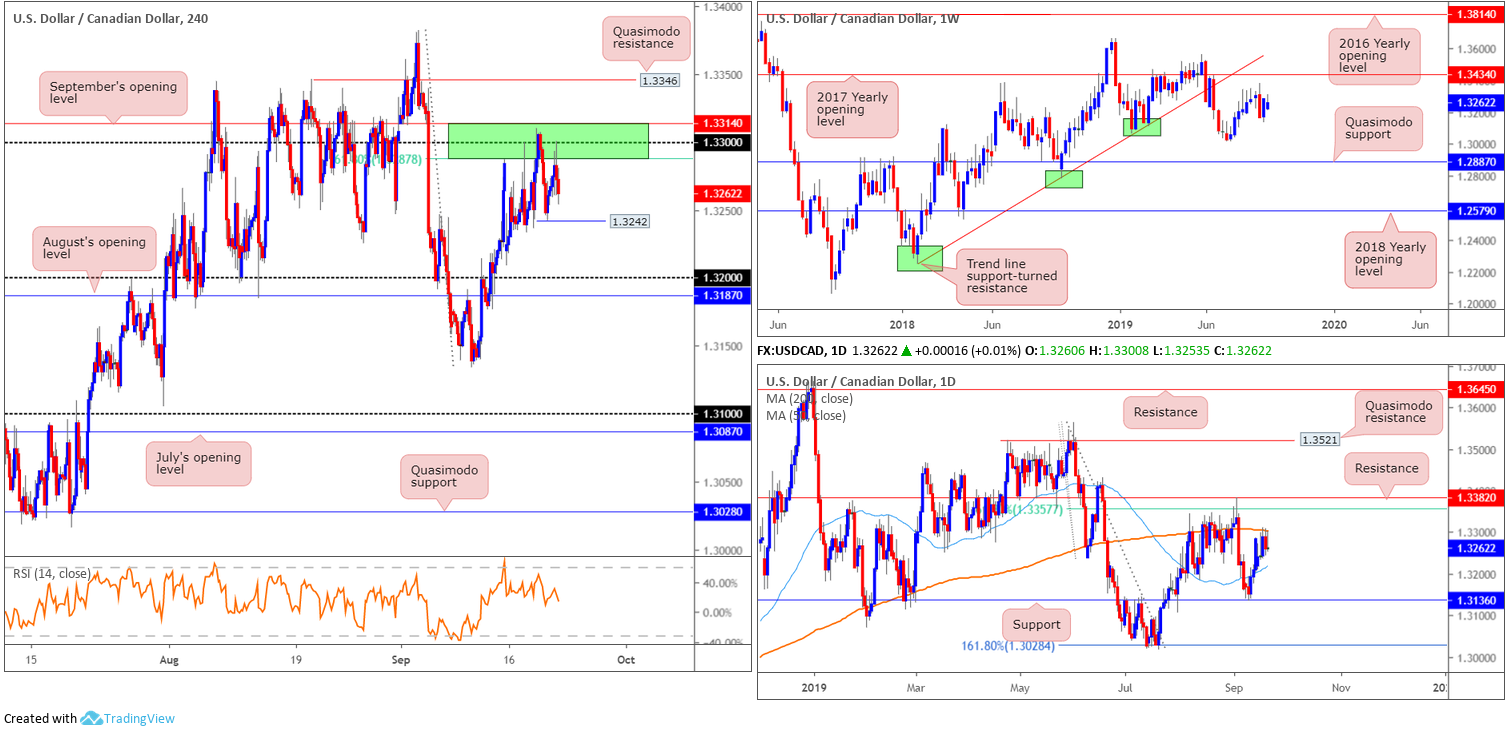
USD/CAD action, to some extent, was unresponsive last week, mostly confined within the prior week’s range. Resistance on the weekly timeframe is fixed at the 2017 yearly opening level drawn from 1.3434, closely lagged by trend line support-turned resistance extended from the low 1.2247. To the downside, nonetheless, we have the 1.3016 July 15 low representing potential support, followed by a Quasimodo formation at 1.2887.
Daily perspective:
Upside attempts on the daily timeframe, as is evident from the chart, were contained by the 200-day SMA (orange – 1.3305) in recent trading. Resistance beyond here is visible in the form of a 61.8% Fibonacci resistance at 1.3357 and a resistance level at 1.3382. Immediately lower, the 50-day SMA is hovering close by (blue – 1.3219), sited north of a familiar support at 1.3136.
H4 perspective:
Prominent sell zone (green) between September’s opening level at 1.3314, the round number 1.33 and the 61.8% Fibonacci ratio at 1.3287 (1.3314/1.3287) limited any upside efforts Friday, specifically testing 1.33 (supported further by the 200-day SMA highlighted above). In terms of macroeconomic releases, Statistics Canada revealed July retail sales rose from June to 0.4% from a prior revised -0.1%, though missed expectations for a 0.6% rise. In other news, US President Donald Trump announced the details of sanctions over the Iranian National Bank, though WTI was mostly contained within the previous day’s range.
The H4 sell zone mentioned above at 1.3314/1.3287 has been tested on three separate occasions over the last week, each time failing to produce a lower low. Technically, this may eventually result in a break of the said area and a possible run to H4 Quasimodo resistance at 1.3346 this week. Despite this, sellers still have the upper hand all the while the H4 candles respect the mentioned area of resistance.
Areas of consideration:
To confirm healthy intent from the current H4 resistance area, the research team requires a H4 close beneath 1.3242. A break of this angle likely clears the runway to at least 1.32 and August’s opening level at 1.3187, possibly followed by a move to daily support at 1.3136.
A potential entry, albeit considered somewhat conservative, is wait and see if the H4 candles retest 1.3242 following the break lower. A retest of this level, preferably formed by a H4 or H1 bearish candlestick pattern (entry/risk can be defined according to this structure), is likely sufficient to entice sellers to at least 1.32ish. Traders are also urged to consider risk/reward ratio, targeting at least a 1:1 fix to the initial downside target, before pulling the trigger.
USD/CHF:
Weekly gain/loss: +0.08%
Weekly close: 0.9906
Weekly perspective:
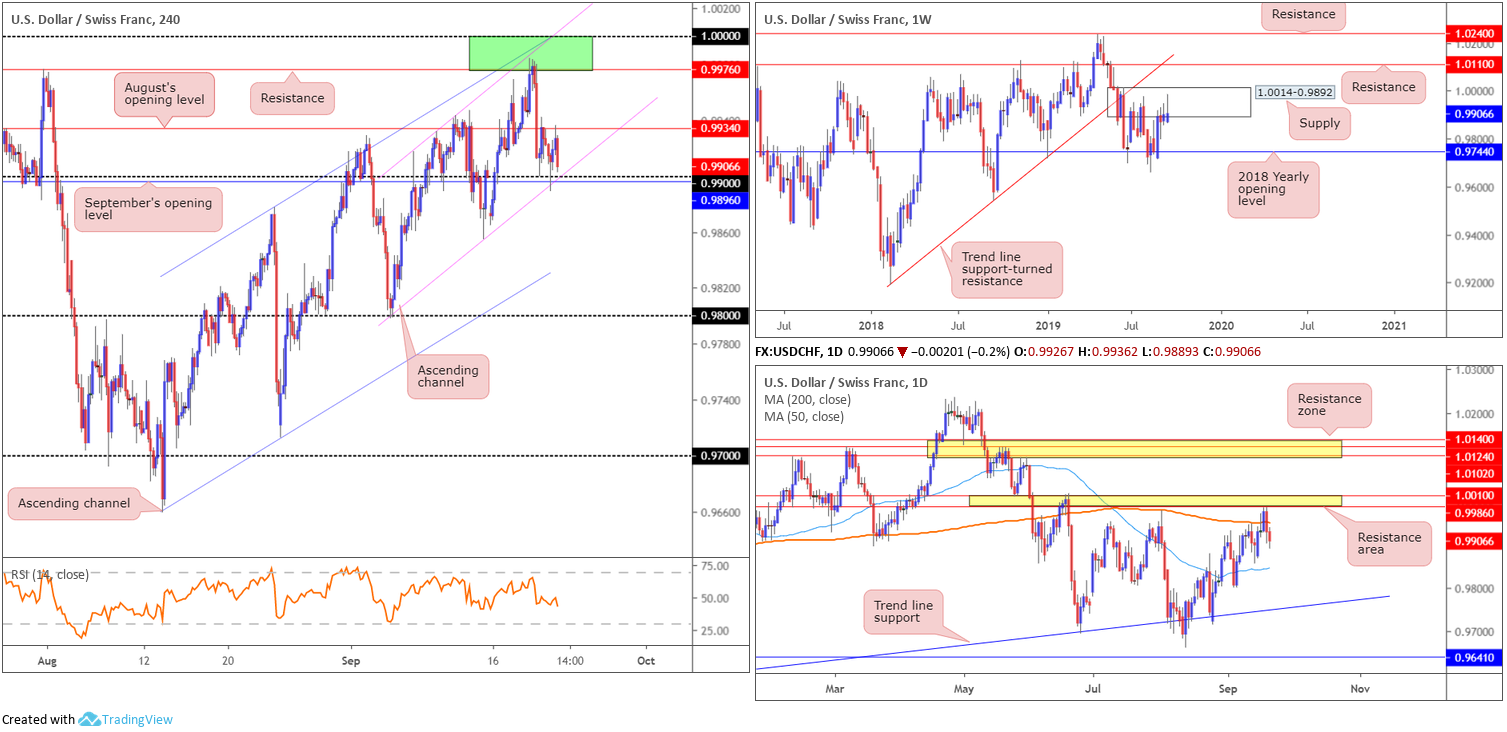
Longer-term flow has action engaging with familiar supply coming in at 1.0014-0.9892, consequently producing a shooting star formation last week (considered a bearish signal). This is the second time back to the area; therefore, its strength may be compromised. A rotation lower from here, nevertheless, has the 2018 yearly opening level at 0.9744 in view. In the event buyers brush aside the said supply (unlikely a straightforward feat but certainly a possibility), resistance at 1.0110 is in sight, as is long-term trend line support-turned resistance taken from the low 0.9187.
Daily perspective:
A closer reading of price action on the daily timeframe has the pair airing a bearish vibe just south of a daily resistance area at 1.0010/0.9986. The market also recently saw price engulf the 200-day SMA (orange – 0.9744). The research team notes limited active demand until reaching the 50-day SMA (blue – 0.9844), with an engulf of this line possibly unbolting the door to trend line support etched from the low 0.9542.
H4 perspective:
Thursday’s retreat from 0.9983 brought price action lower from a resistance area at 1.0000/0.9976 (comprised of a notable high formed at the end of July from 0.9976. a channel formation extended from the high 0.9877 and 1.0000 [parity]). Though Friday’s movement extended losses, a combination of support comprised of the round number 0.99, September’s opening level at 0.9896 and channel support (extended from the low 0.9798) contained the move.
Daily action crossed beneath its 200-day SMA last week, suggesting sellers may have the upper hand at the moment. The research team adds a H4 close beneath the current channel support would further support this theory and open bearish scenarios to the 0.9854 September low and the 0.98 handle.
Areas of consideration:
To confirm a bearish theme, look for a decisive H4 close beneath 0.99. This – coupled with a (bearish candlestick) retest at 0.99 – highlights selling opportunities to the noted H4 targets. Entry and protective stop-loss orders can be set based on the rejection candlestick’s framework.
Dow Jones Industrial Average:
Weekly gain/loss: -1.22%
Weekly close: 26898
Weekly perspective:
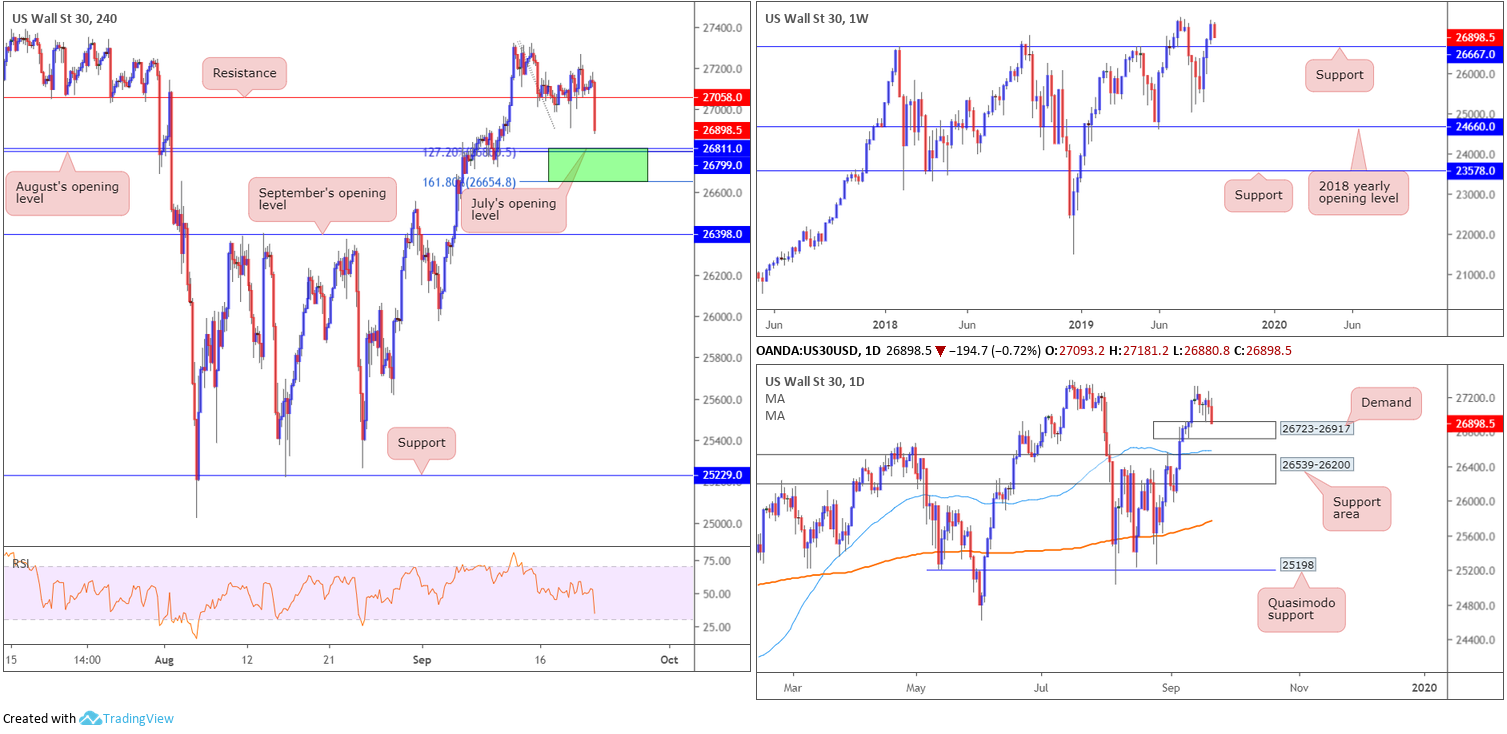
Down more than 300 points and snapping a three-week bullish phase, US equities rotated lower last week and concluded the session poised to retest notable support at 26667.
A retest of the said support this week could clear out a path north to approach the all-time high 27388.
Daily perspective:
In response to recent selling, daily activity entered the parapets of fresh demand priced in at 26723-26917. Failure to hold prices higher from here this week could result in the support area at 26539-26200 entering the fray, which happens to align closely with a 50-day SMA (blue – 26575).
H4 perspective:
US stocks declined Friday after Chinese officials cancelled a visit to US farms, reigniting trade concerns. The Dow Jones Industrial Average erased 159.72 points, or 0.59% Friday; the S&P 500 concluded lower by 14.76 points, or 0.49% while the tech-heavy Nasdaq 100 fell 78.42 points, or 0.99%.
Technical support at 27058 was obliterated Friday (now acting support), guiding a close set a few points north of August and July’s opening levels at 26799 and 26811, respectively. Note the 127.2% Fibonacci extension value at 26800 closely aligns with the said levels, with the 161.8% Fibonacci extension also in sight at 26654 (green area). This is a particularly appealing area of support having seen it boast a connection to weekly support at 26667 and the current daily demand at 26723-26917.
Areas of consideration:
On account of the research, the H4 support area at 26654/26811 denotes a possible buy zone this week. Having noted a connection to weekly support at 26667, based within the lower boundary of the said H4 support zone, a move deep into the area could occur before buyers make an appearance. For that reason, waiting for additional candlestick confirmation to form before pulling the trigger is recommended. Not only does this help identify buyer intent, it also provides traders entry and risk levels to work with.
XAU/USD (GOLD):
Weekly gain/loss: +1.89%
Weekly close: 1516.7
Weekly perspective:
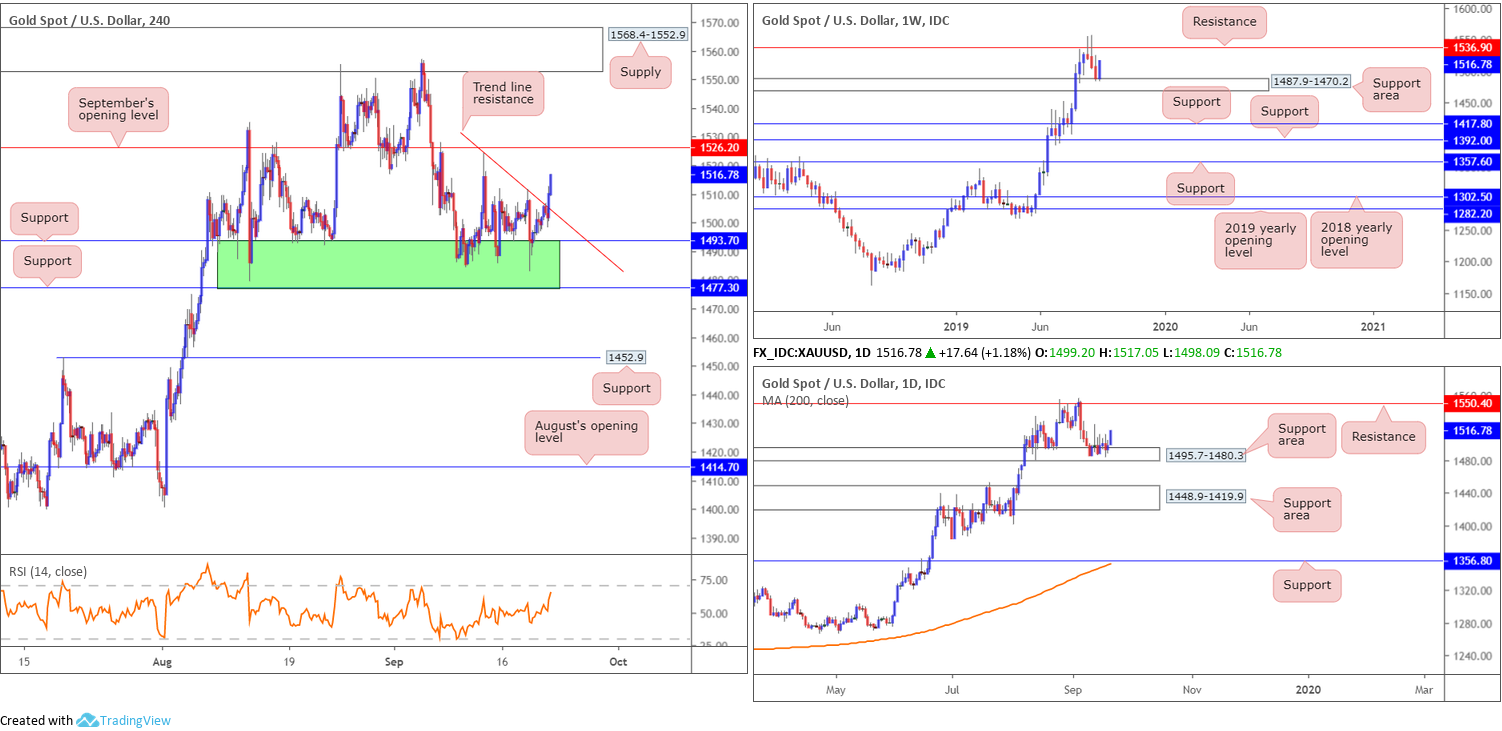
Shaped in the form of a bullish engulfing configuration, price action rotated higher from a support area coming in at 1487.9-1470.2 (drawn from April 2013) last week. Snapping a three-week losing streak, the recent move positioned the yellow metal within a short walking distance from resistance coming in at 1536.9.
Daily perspective:
In conjunction with weekly moves, daily candles found a floor off a support area coming in at 1495.7-1480.3 (glued to the top edge of the current weekly support area). From this angle, though, the next upside target falls in a touch higher than weekly resistance (1536.9) at 1550.4.
H4 perspective:
Gold wrapped up firmer Friday, as Chinese officials cancelled a visit to US farms, reigniting trade concerns, and US President Donald Trump announced more sanctions on Iran. This resulted in haven demand, lifting bullion firmly north of 1500.0 to session highs at 1517.0.
For traders who read Friday’s technical research you may recall the following:
As evident from H4 structure, the metal remains testing a familiar support area between 1477.3/1493.7 (green). Buyers, particularly on the H4 timeframe, likely still eye higher prices all the time the current support zone is intact. A break of this area has support at 1452.9 to target.
In order to validate buyer intent out of the current H4 support zone at 1477.3/1493.7, a H4 close above local trend line resistance (extended from the high 1524.2) is required. A decisive push through this barrier exposes September’s opening level as the next resistance at 1526.2. Ideally, a retest at the broken trend line as support is eyed as possible entry, even better if the retest forms by way of a H4 bullish candlestick signal (entry and risk can then be set according to this structure).
As can be seen from the H4 chart, an entry on the back of the breakout beyond the noted trend line resistance was in the offing, with protective stop-loss orders plotted beneath its lower shadow. Unfortunately, a retest of the broken trend line was not seen.
Areas of consideration:
Well done to any of our readers who managed to board the break of the H4 trend line resistance. The initial upside target, as underlined above, falls in around September’s opening level at 1526.2. In the event we pullback and retest the said trend line before clocking the target, this allows traders a favourable entry, particularly if the retest forms by way of a H4 bullish candlestick configuration (entry/risk can be calculated according to its dimensions).
The accuracy, completeness and timeliness of the information contained on this site cannot be guaranteed. IC Markets does not warranty, guarantee or make any representations, or assume any liability regarding financial results based on the use of the information in the site.
News, views, opinions, recommendations and other information obtained from sources outside of www.icmarkets.com.au, used in this site are believed to be reliable, but we cannot guarantee their accuracy or completeness. All such information is subject to change at any time without notice. IC Markets assumes no responsibility for the content of any linked site.
The fact that such links may exist does not indicate approval or endorsement of any material contained on any linked site. IC Markets is not liable for any harm caused by the transmission, through accessing the services or information on this site, of a computer virus, or other computer code or programming device that might be used to access, delete, damage, disable, disrupt or otherwise impede in any manner, the operation of the site or of any user’s software, hardware, data or property.


