
A note on lower timeframe confirming price action…
Waiting for lower timeframe confirmation is our main tool to confirm strength within higher timeframe zones, andhas really been the key to our trading success. It takes a little time to understand the subtle nuances, however, as each trade is never the same, but once you master the rhythm so to speak, you will be saved from countless unnecessary losing trades. The following is a list of what we look for:
- A break/retest of supply or demand dependent on which way you’re trading.
- A trendline break/retest.
- Buying/selling tails – essentially we look for a cluster of very obvious spikes off of lower timeframe support and resistance levels within the higher timeframe zone.
- Candlestick patterns. We tend to only stick with pin bars and engulfing bars as these have proven to be the most effective.
For us, lower timeframe confirmation starts on the M15 and finishes up on the H1, since most of our higher timeframe areas begin with the H4.
EUR/USD:
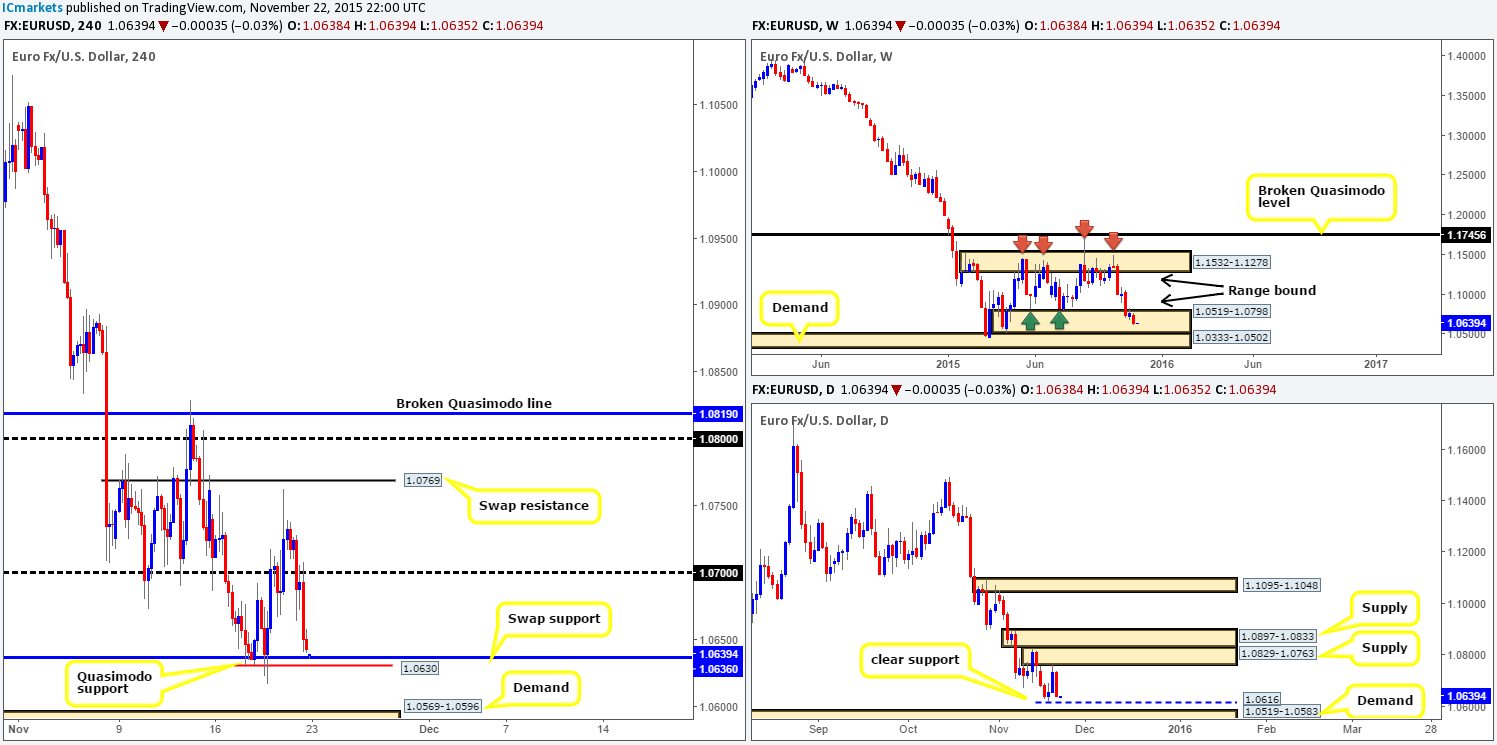
Weekly view: Two weeks back, a brief stint of hope was seen within the range demand at 1.0519-1.0798. This, however, got washed away at sea last week as the sellers drove the EUR further into the depths of the above said demand, consequently losing 120 pips in the process by the close 1.0642. On the assumption that this momentum continues this week, we may see a break lower into demand lurking just below at 1.0333-1.0502, which has already proved itself on two occasions already(17/03/03-1.0499/09/03/15-1.0461).
Potential weekly levels to watch this week fall in at:1.0519-1.0798/1.0333-1.0502.
Daily view:From the other side of the field, we can see that supply at 1.0829-1.0763 did a good job of holding this market lower towards the end of last week. Directly below current price, nonetheless, sits a support drawn from Wednesday’s low at 1.0616, followed closely by a demand just below it at 1.0519-1.0583 (positioned deep within the aforementioned weekly range demand). In our opinion, all three of the above said zones are definitely areas to keep a tab on this week!
Potential daily levels to watch this week fall in at:1.0829-1.0763/1.0616/1.0519-1.0583.
H4 view:A quick recap of Friday’s activity shows that despite Wednesdays and Thursday’s attempt to rally the EUR higher; it was clearly not enough to sustain a further advance. Prices tumbled during Friday’s sessions, erasing any gains the market accrued. As a result, a cut through and retest of psychological support 1.0700 was seen, sending this pair down to just above swap support coming in at 1.0636 by the week’s end.
In light of this morning’s steady open at 1.0638, and the fact that price remains trading around both a swap support level at 1.0636 and also a Quasimodo support at 1.0630, would we consider this to be a stable enough platform to buy from today? Well, considering that both these barriers are buried within a weekly range demand mentioned above at 1.0519-1.0798, yes we would. However, our team has pointed out that theyrequire lower timeframe confirmation before risking capital here, due to the possibility of fakeout, or a further decline down to the H4 demand below at 1.0569-1.0596 (also potential buy zone).
Levels to watch/live orders:
- Buys:1.0630/1.0636 [Tentative – confirmation required] (Stop loss: dependent on where one confirms this small area) 1.0569-1.0596 [Tentative – confirmation required] (Stop loss: dependent on where one confirms this area).
- Sells: Flat (Stop loss: N/A).
GBP/USD:
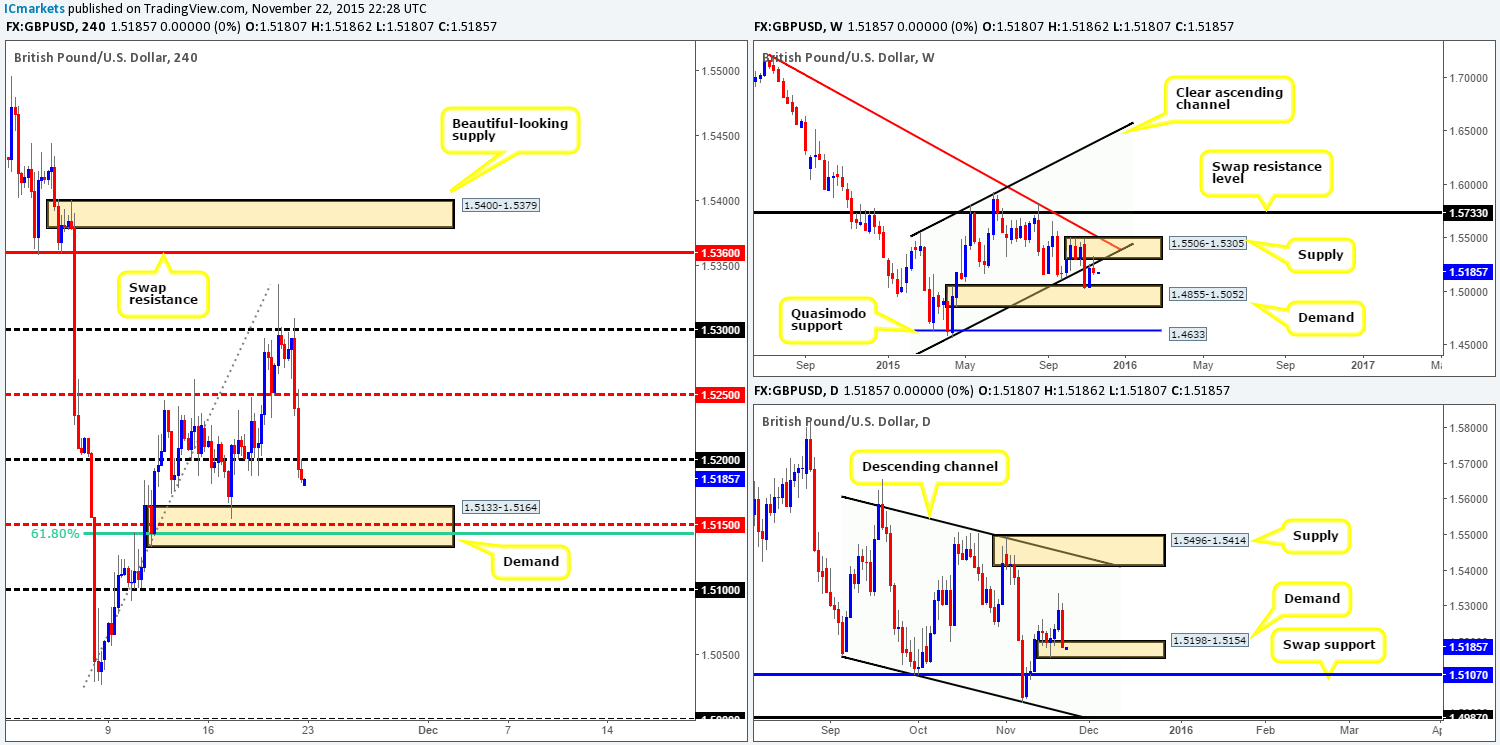
Weekly view:Last week’s action shows us that price rebounded beautifully from a solid supply zone seen at 1.5506-1.5305 (converges so nicely with the underside of a recently broken channel support [1.4564]). Not only did this cause this market to close the week forty or so pips in the red at 1.5185, it also painted a very clear bearish selling wick in the process. Should this encourage further selling this week, price will likely head lower to test demand at 1.4855-1.5052 for the second time.
Potential weekly levels to watch this week fall in at:1.5506-1.5305/1.4855-1.5052.
Daily view:From this angle, however, it’s clear to see that the Pound was in fact bullish right up until Thursday’s close last week. Friday wiped out the entire week’s gains and closed deep within demand visible at 1.5198-1.5154. Taking into account what we have just seen on the weekly chart, this current demand could very easily be taken out this week. Therefore, do keep an eye on the swap support seen below at 1.5107, and also the descending channel support just below it drawn from the low 1.5162.
Potential daily levels to watch this week fall in at:1.5198-1.5154/1.5107/Channel support.
H4 view:Consequent to Friday’s lemming-like stampede from psychological resistance 1.5300, we can see that both mid-level support 1.5250 and psychological support 1.5200 were wiped out by the week’s end.
Breaking into a new week, however, Cable opened calmly this morning at 1.5180, just five pips lower than the close. Now, given the points made above, areas that immediately jump out to us are as follows:
- Demand seen at 1.5133-1.5164. This area boasts both 61.8% Fibonacci support at 1.5144, mid-level support 1.5150 and, as you can see, has already proved itself once already back on the 17th of November at 1.5154. Nevertheless, we must take into account that it is located just below the above said daily demand, and by entering long from here, you would also potentially be going up against weekly flow (see above). This is not to say that a trade from here is out of the question. All we’re saying is not to expect much more than an intraday bounce at best.
- Psychological support-turned resistance 1.5200. Given that price is trading from weekly supply right now (see above), a retest of 1.5200 as resistance may give traders the opportunity to short here down to the above said demand at 1.5133-1.5164 (confirmation required).
- And finally, do keep an eye on psychological support 1.5100. This number may look like its floating in mid-air, but it actually merges beautifully with a daily swap support mentioned above at 1.5107. That being said though, simply placing a pending order to buy here may not be the best path to take. Reason being is fifty pips below this barrier sits a weekly demand mentioned above at 1.4855-1.5052. Therefore, a fakeout of some kind is highly likely – trade carefully!
Levels to watch/ live orders:
- Buys: 1.5133-1.5164 [Tentative – confirmation required] (Stop loss: dependent on where one confirms this area) 1.5100 [Tentative – confirmation required] (Stop loss: dependent on where one confirms this level).
- Sells: 1.5200 [Tentative – confirmation required] (Stop loss: dependent on where one confirms this level).
AUD/USD:
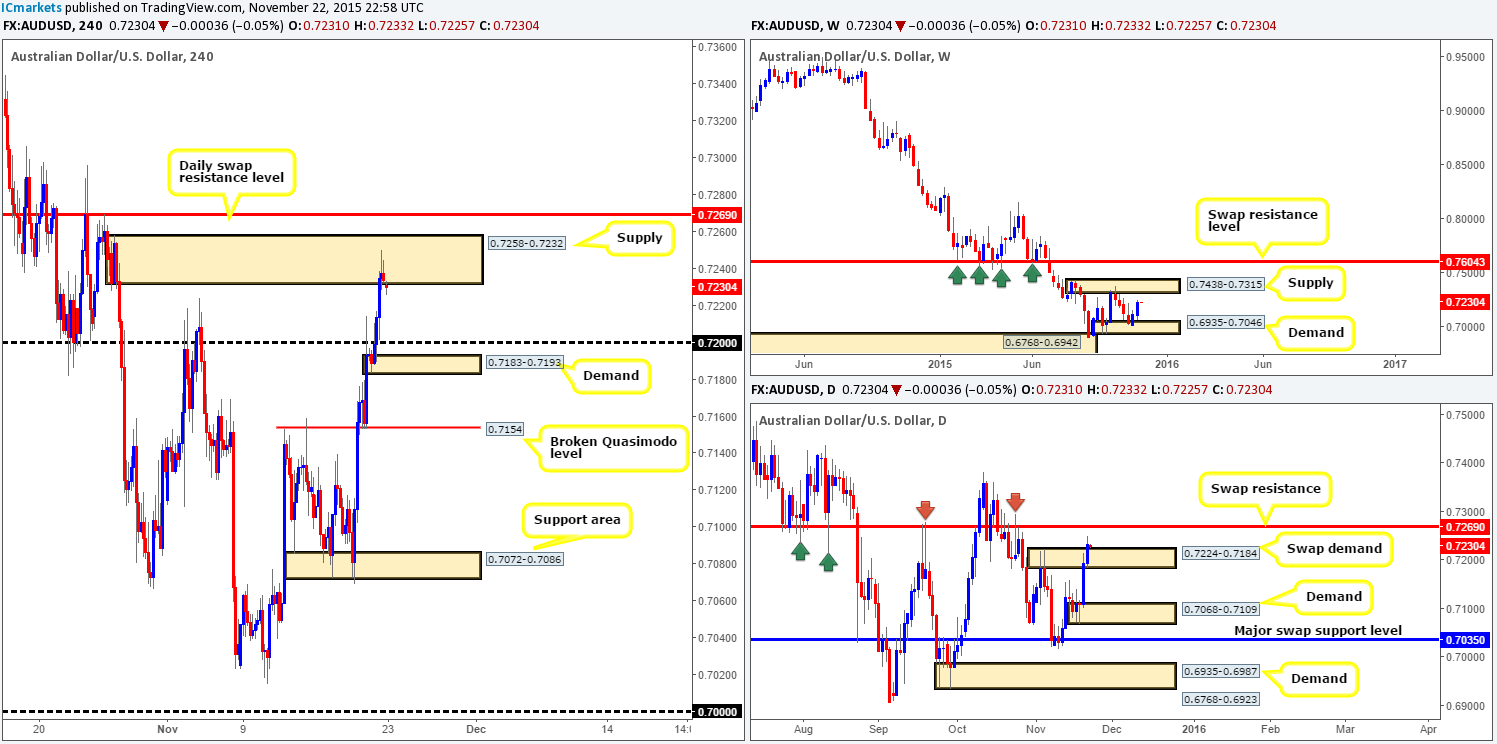
Weekly view:Following the bullish rebound from demand seen at 0.6935-0.7046, this market extended higher last week, gaining over 110 pips and closing at 0.7234. Should the bulls remain in control this week, it is very possible we may see price cross swords with supply seen at 0.7438-0.7315.
Potential weekly levels to watch this week fall in at:0.6935-0.7046/0.7438-0.7315.
Daily view:Moving down a level, recent trade on the daily timeframe shows that price closed above supply (now acting demand) at 0.7224-0.7184, which, in effect, signals prices may want to trade higher this week.
While this may agree with what we’ve just noted on the weekly timeframe, we have to take into consideration that a relatively strong-looking daily swap (resistance) level is seen just above current price at 0.7269 which could halt further buying. It will be interesting to see what the H4 timeframe has to say on the matter…
Potential daily levels to watch this week fall in at:0.7224-0.7184/0.7269.
H4 view: Despite the rebound from psychological resistance 0.7200, the Aussie dollar continued to advance on Friday, topping out within supply coming in at 0.7258-0.7232. Going forward, little difference has been seen to structure this morning as the market opened three pips lower at 0.7231.
Taking into account all of above, this is quite a tricky pair to read at the moment… With this, the only logical path we see for price today and possibly into mid-week is as follows:
A Sell-off from H4 supply will likely be seen down to psychological support 0.7200, or possibly demand just below it at 0.7183-0.7193. This region is, if you look across to the daily chart, located within the recently broken supply (now demand) at 0.7224-0.7184. Should we see prices hold firm around here, then it is likely going to provide a nice base in which to join both weekly and daily flow up to at least the above said daily swap resistance at 0.7269. Reason being is because the recent drive into H4 supply has likely consumed enough sellers to clear the path north. Whether you look to short the current H4 supply or buy from 0.7200 region, we would strongly advise only doing so only with the use of lower timeframe confirmation.
Levels to watch/ live orders:
- Buys: 0.7200/0.7183-0.7193 region [Tentative – confirmation required] (Stop loss: dependent on where one confirms this area).
- Sells:0.7258-0.7232[Tentative – confirmation required] (Stop loss: dependent on where one confirms this area).
USD/JPY:
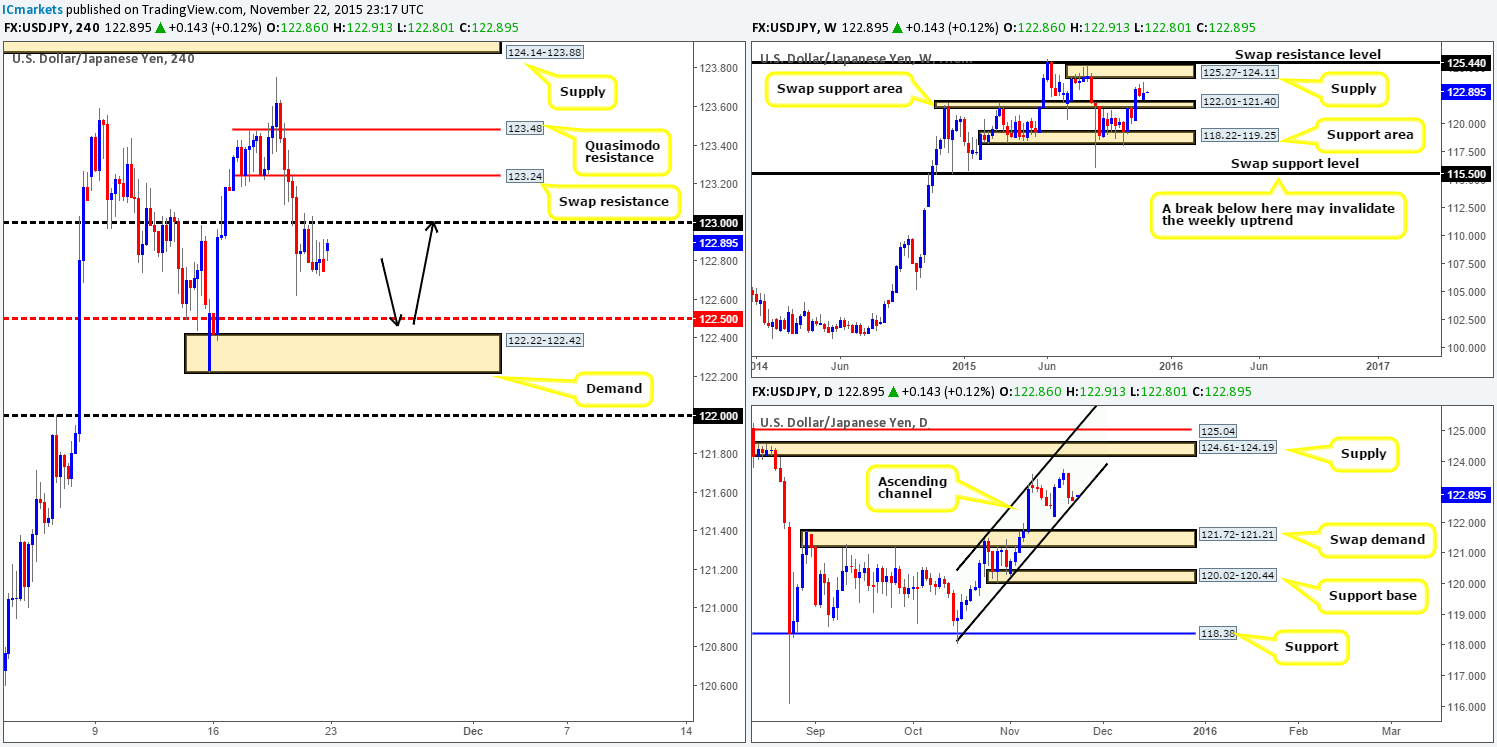
Weekly view:Little change has been seen over the past two weeks on this timeframe. Price remains loitering between a swap support area coming in at 122.01-121.40 and a supply area seen at 125.27-124.11. Other than the fact that price gained a mere 18 pips into the close 122.75, there is not much else to report… Let’s dive into the lower timeframes to see what we can find!
Potential weekly levels to watch this week fall in at:125.27-124.11/122.01-121.40.
Daily view:From this angle, price is currently confined within an ascending channel taken from 118.06/121.47, and, as you can see, closed the week flirting with the lower limits of this structure. The response seenfrom this boundary so far has not shown much buying interest. As such, in the event that this line fails,traders may want to keep a tab on last Monday’s low 122.22, followed by the swap demand at 121.72-121.21 (located around the aforementioned weekly swap [support] area).
Potential daily levels to watch this week fall in at: Channel support/122.22/121.72-121.21.
H4 view:In comparison to Thursday’s descent, Friday’s trade was relatively quiet. Offers at psychological resistance 123.00 held firm as did bids around intraday support drawn from 122.74. Moving into a new week, however, this morning’s open 122.86 painted an eleven-pip gap north, which traders wasted no time in filling.
Due to where price is currently positioned on the daily timeframe, our bias for the time being is long. Despite this, there is very little supportive structure on the H4 to consider a long from at this time. That being the case, what we’re ultimately looking to see is an aggressive whipsaw lower this week down to mid-level support 122.50/demand at 122.22-122.42, as per the black arrows. This will likely take out a ton of stops lingering below the above said intraday support and also below the daily ascending channel limit, thus giving well-funded traders the chance to enter long by buying into all these sell stops from the 122.50 region. This may not be a tradable move for us as if our analysis is correct, price will move too fast for us to lock in lower timeframe confirming price action. If we do manage to enter long, nonetheless, we’d expect more than an intraday bounce from here since at that point, we’re dealing with daily stops!
Levels to watch/ live orders:
- Buys:122.50/122.22-122.42 [Tentative – confirmation required] (Stop loss: dependent on where one confirms this area).
- Sells: Flat (Stop loss: N/A).
USD/CAD:
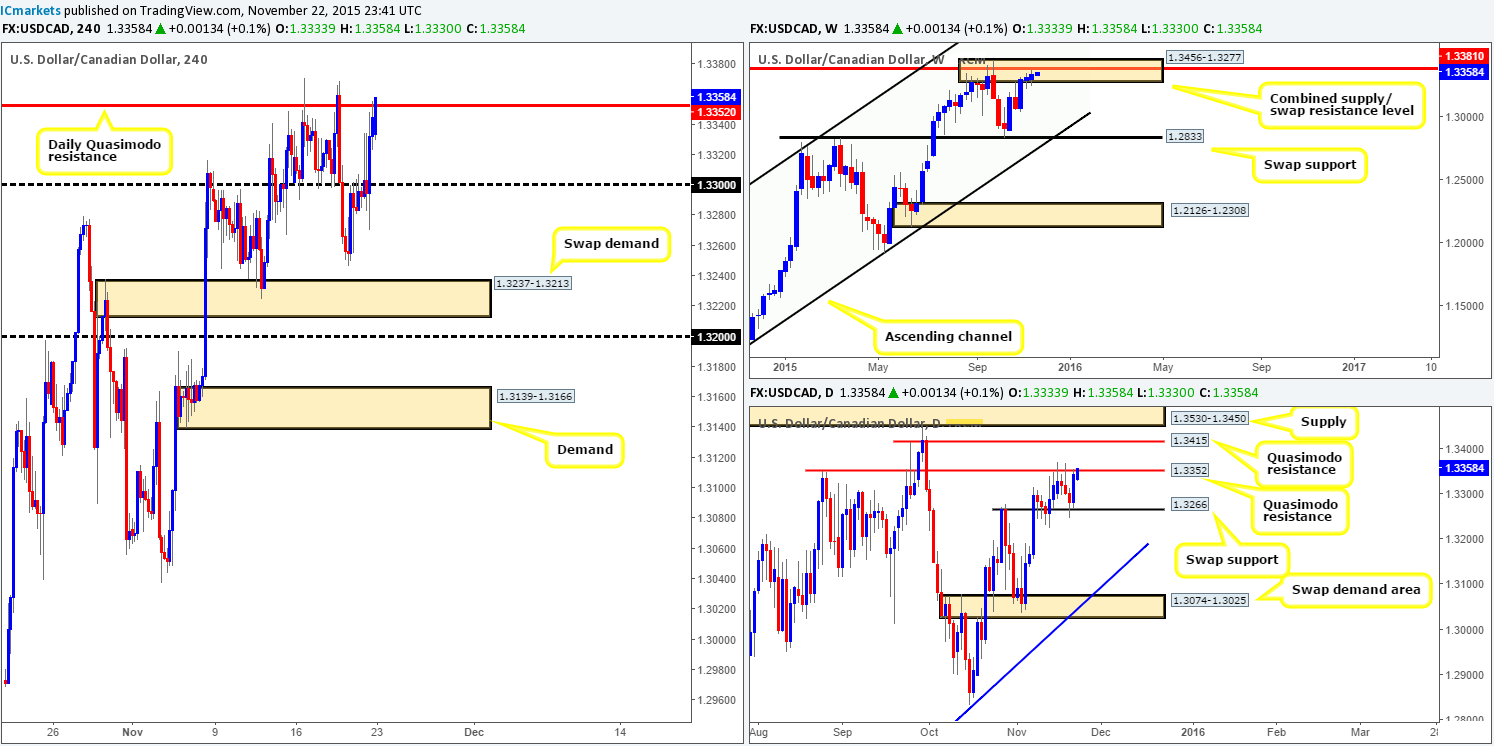
Weekly view:Although we can see that price remains lodged within a weekly supply/ swap resistance area at 1.3456-1.3277/1.3381, there has been little noteworthy selling. In fact, this is the third consecutive week the market closed (1.3345) higher. A sell-off from here is looking less and less likely considering the strength of the U.S. dollarat the moment. With this in mind, a break beyond this zone could send prices up to the supply area seen at 1.3818-1.3630. Before we discount the current area altogether though, let’s check out what the lower timeframes have on offer…
Potential weekly levels to watch this week fall in at:1.3456-1.3277-1.3381/1.3818-1.3630.
Daily view:Turning our attention to the daily timeframe, market action appears to be chiseling out a consolidation zone between a daily Quasimodo resistance level at 1.3352 and a swap support barrier coming in at 1.3266.As we can all see, price ended the week kissing the underside of the Quasimodo level, thus making it a key level to keep your eye on today. A break above from here will likely target the Quasimodo resistance level at 1.3415 (located within the 1.3456-1.3277/1.3381 weekly area), followed closely by supply at 1.3530-1.3450 (sits on top of the 1.3456-1.3277/1.3381 weekly area).
Potential daily levels to watch this week fall in at:1.3352/1.3416/1.3530-1.3450/1.3266/1.3074-1.3025.
H4 view:Consequent to the recent drive into the above said daily Quasimodo level, one can see what an awesome. Job this level has done so far of holding this market lower over the past week! The market opened this morning at 1.3333, and has so far seen a conservative wave of bids hit the line.
As we mentioned above in the daily section, this Quasimodo resistance line will be a key level to watch today. A rejection from this number (which we would consider shorting with lower timeframe confirmation) could send prices down to at least psychological support 1.3300. The reason for requiring confirmation at such a strong level is simply to avoid being stopped on a fakeout. One only has to look at last week’s reaction to see this in action.
Meanwhile, a break above could, as we mentioned in the daily section above, propel this market up to the next daily Quasimodo resistance level at 1.3415. This would be something we’d be interested in taking part in if price retested this barrier as support alongside lower timeframe confirming price action.
Levels to watch/ live orders:
- Buys:Watch for offers to be consumed at 1.3352 and then look to trade any retest seen at this level (confirmation required).
- Sells: 1.3352 [Tentative – confirmation required] (Stop loss: dependent on where one confirms this level).
USD/CHF:
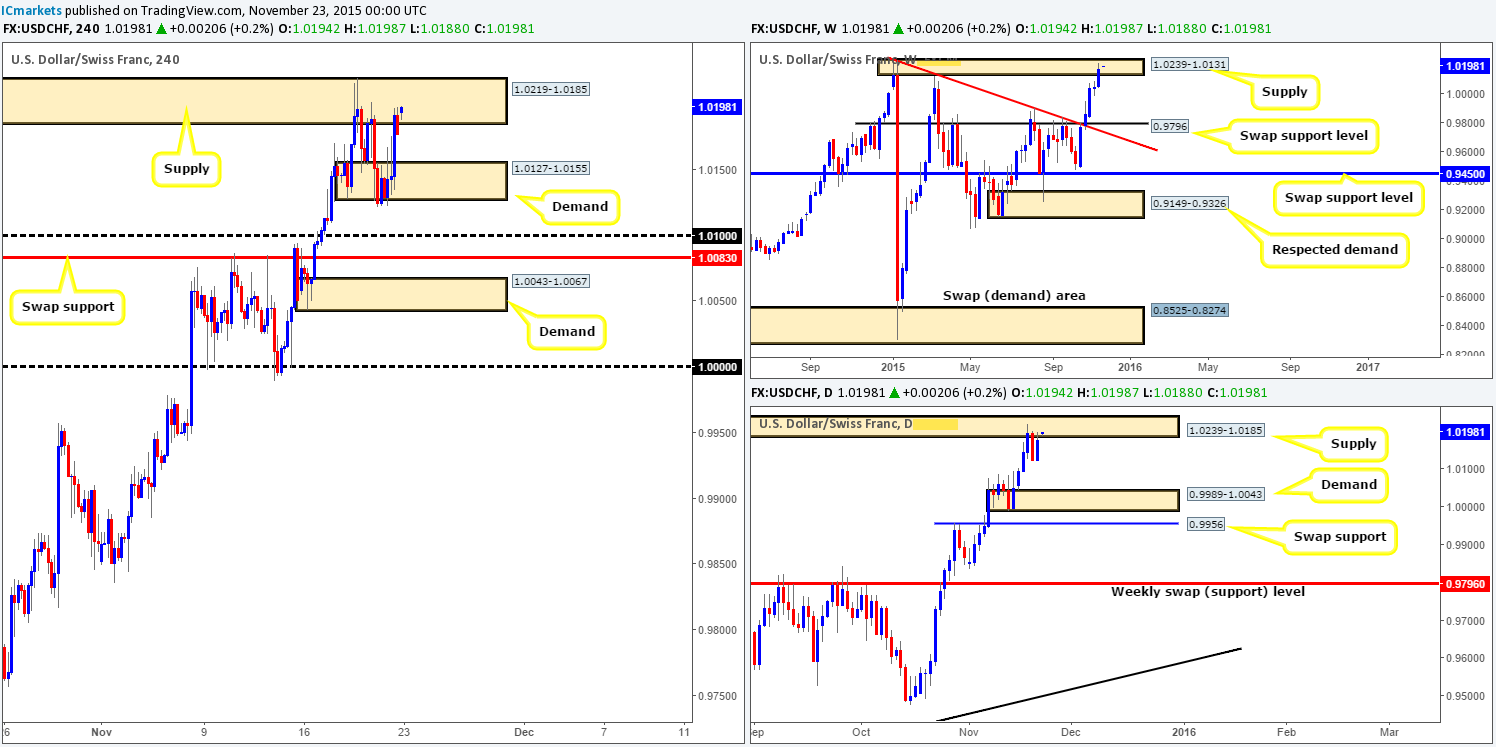
Weekly view: For the fifth consecutive week, the USD/CHF continued to flex its financial muscle as the market rallied a further 125 pips into the close 1.0177. This, as you can see, forced price to connect with supply coming in at 1.0239-1.0131. Should this zone be unableto stop this bullish stampede, the next area of interest comes in at 1.0626-1.0376.
Potential weekly levels to watch this week fall in at:1.0239-1.0131/1.0626-1.0376.
Daily view:As can be seen from this chart, price collided with the weekly’s partner supply on the daily timeframe at 1.0239-1.0185 Wednesday last week, which showedpromise during Thursday’s trade. However, Friday’s action put an end to that and drove prices back up to the underside of this daily area by the week’s end. In the event that we see this area give way, we see very little stopping this market from continuing its Bull Run up to a swap resistance level at 1.0388, which incidentally is positioned just within the weekly area mentioned above at 1.0626-1.0376. On the other hand, a bearish rejection from the current daily supply could pull this market down to test demand drawn from 0.9989-1.0043.
Potential daily levels to watch this week fall in at:1.0239-1.0185/1.0388/0.9989-1.0043.
H4 view: (Trade update: Taken out at breakeven – see previous report for details).
Following the break below demand at 1.0127-1.0155, price, as you can see, drove north connecting back up with supply coming in at 1.0219-1.0185. Now, seeing as this morning’s open 1.0194 made very little difference to current structure, our team is still biased to the downside for the time being… Believe us when we say that every emotion is telling us that this pair is heading long to continue to the trend north, but with price trading within overall supply from the weekly down to the H4 (see above), we just cannot ignore this! What we also like, however, is the fact that a ton of buyers have likely now been removed from the demand below at 1.0127-1.0155, thus potentially clearing the path down to at least psychological support 1.0100.
As a result, should we be able to spot a lower timeframe setup to sell into this market today (preferably from the 30/60 minute timeframe), we’ll be eyeing the base of demand at 1.0127 to take partial profits (in case of any residual orders left over from the recent break), and then look to close our full position around 1.0100.
Levels to watch/ live orders:
- Buys:Flat (Stop loss: N/A).
- Sells:1.0219-1.0185 [Tentative – confirmation required] (Stop loss: dependent on where one confirms this area).
DOW 30:
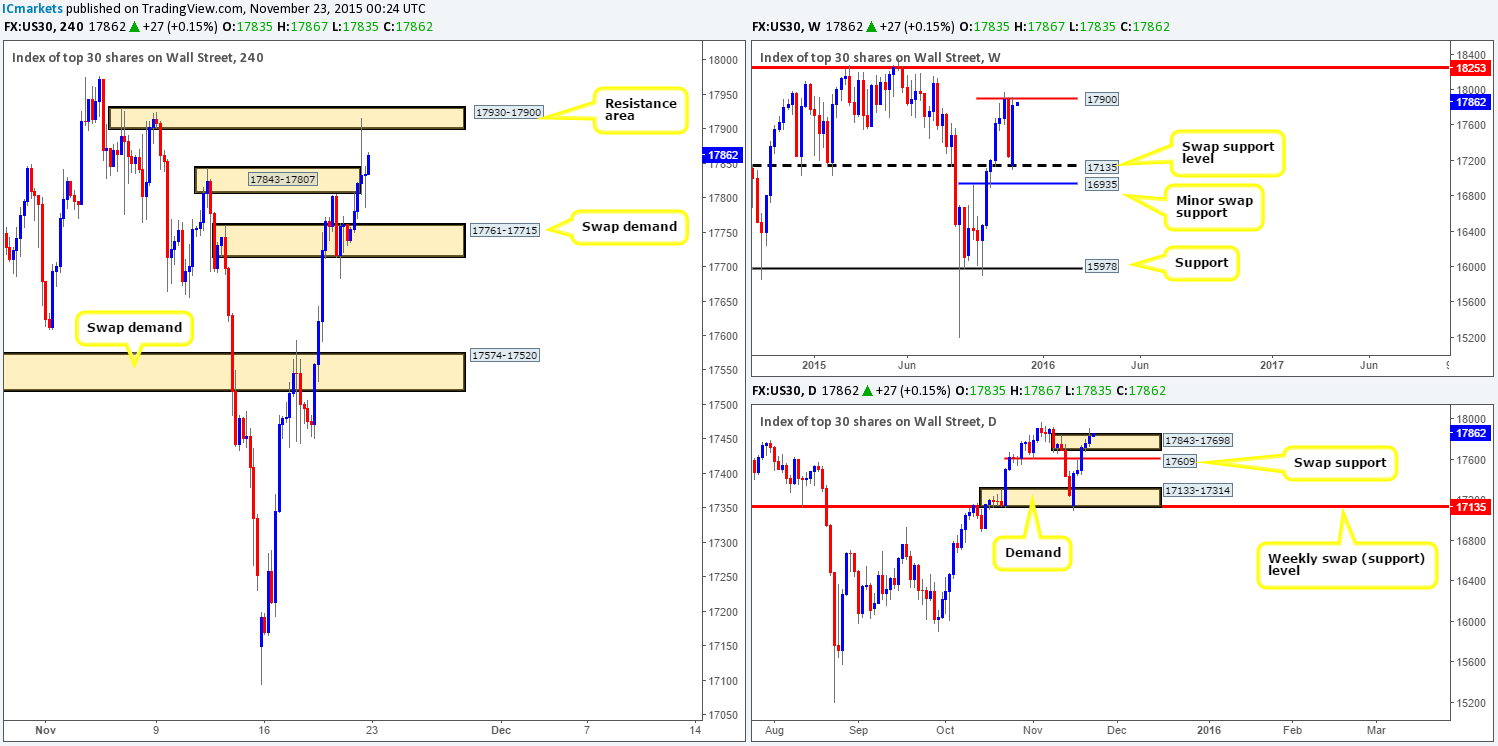
Weekly view: During the course of last week’s trade, the DOW rallied an impressive 580 points from the swap support level at 17135, consequently erasing all the prior week’s losses, and at the same time hitting 17900 into the close 17835. Of course, both 17900 and 17135 are levels to keep an eye on this week, but we are also interested in the zones sitting beyond these barriers. Note the clear resistance level lurking above at 18253, and the minor swap support level below at 16935.
Potential weekly levels to watch this week fall in at: 17900/17135/16935/18253.
Daily view:Last week’s buying saw not only a swap resistance level (now support) at 17609 get taken out, but also towards the end of the week, the supply area at 17843-17698 as well. Usually, with a spike this big above a supply, we would be looking for a continuation move higher. Nevertheless, seeing as weekly action is trading from resistance at 17900 at the moment, this daily spike may just be one large fakeout to drive prices back down to at least the above said swap support level, and possibly, given enough time, the demand area at 17133-17314 (sits on top of the weekly swap [support] mentioned above at 17135).
Potential daily levels to watch this week fall in at:17843-17698/17609/17133-17314.
H4 view:A quick look at Friday’s movement shows price aggressively spiked north surpassing supply at 17843-17807, and attacking offers sitting around the resistance area seen at 17930-17900. For those who read our previous report (http://www.icmarkets.com/blog/friday-20th-november-daily-technical-outlook-and-review/), this was in actual fact an area to watch for shorts. Unfortunately though, price moved too fast for us to be able to enter with lower timeframe confirmation.
Going into this morning’s open 17835, a small round of bids have entered the market pushing price once again above supply at 17843-17807. With sellers well and truly likely cleared out from this region now, we feel there is little stopping prices from rallying up to the resistance area mentioned above at 17930-17900. This is certainly an area we’d consider shorting (with confirmation) from due to it merging so nicely with the weekly level 17900. Conversely, should the DOW take a turn for the worst today, and head down towards the swap demand at 17761-17715. This is not really an area we’d consider a trade from due to there being no higher timeframe converging support. A close below the current H4 swap demand area together with a confirmed retest as supply could potentially open the doors to a very nice short trade down to the daily swap (support) level at 17609.
Levels to watch/ live orders:
- Buys:Flat (Stop loss: N/A).
- Sells:17930-17900 [Tentative – confirmation required] (Stop loss: dependent on where one confirms this area) watch for bids to be consumed at 17761-17715 and then look to trade any retest seen at this area (confirmation required).
XAU/USD: (Gold)
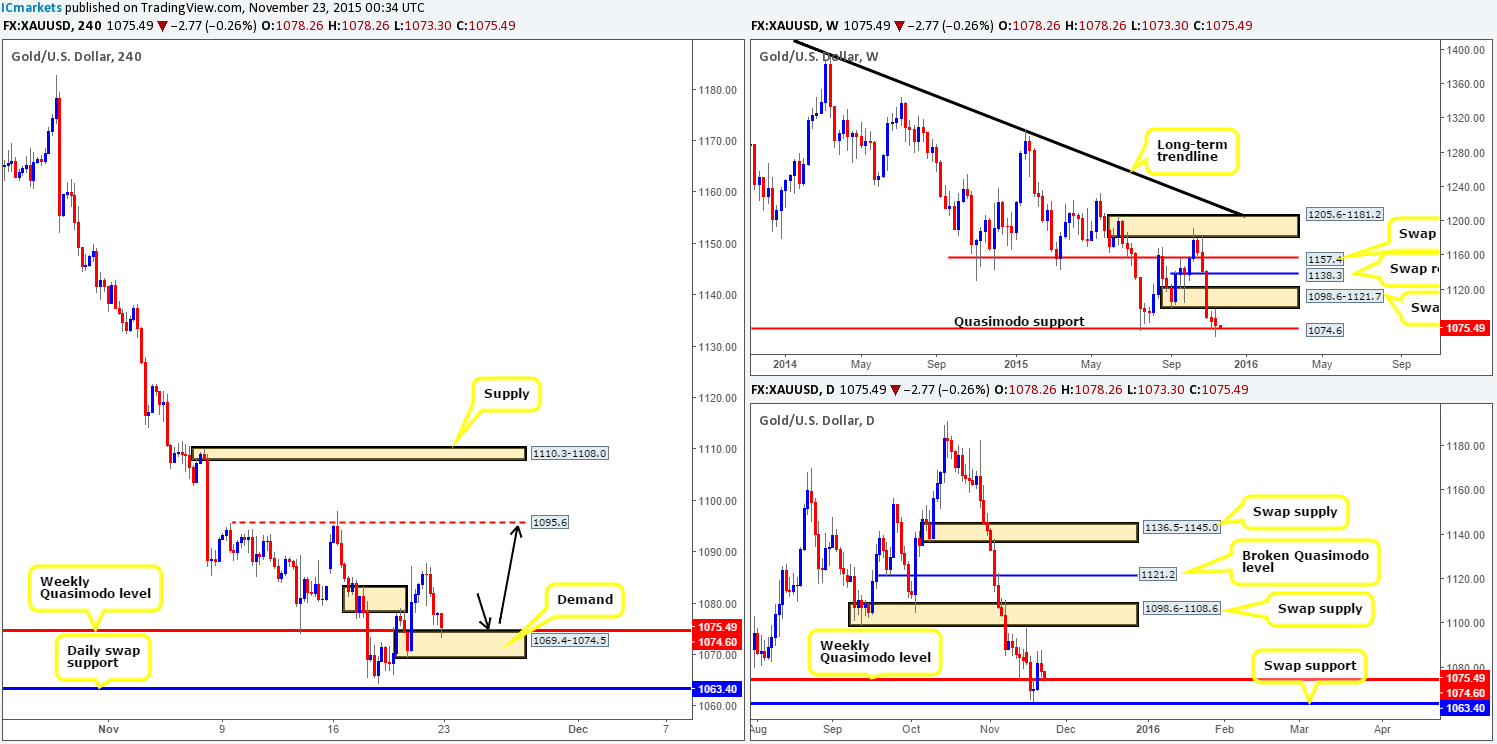
Weekly view:Since price fell from supply at 1205.6-1181.2 five weeks ago, several technical barriers have been taken out. However, over the past two weeks, downside momentum has diminished greatly since connecting with the Quasimodo support level coming in at 1074.6. Granted, last week’s action did still see a decline in value of around $5 at the close 1078.2, but all in all the bearish candles have certainly become less severe. As a result of this, we are beginning to see uncertainty in this market – note the two recent indecision candles that formed in between the aforementioned Quasimodo support and the swap supply zone lurking above at 1098.6-1121.7.
Potential weekly levels to watch this week fall in at: 1074.6/1098.6-1121.7.
Daily view:Wednesday’s rebound from just above the swap support level at 1063.4 last week saw price break back above the weekly hurdle 1074.6. To our way of seeing things right now, as long as the buyers can remain dominant above here this week, there’s little reason (technically) not to see a rally north up to the swap supply drawn from 1098.6-1108.6 (positioned within the above said weekly swap [supply]).
Potential daily levels to watch this week fall in at: 1074.6/1098.6-1108.6.
H4 view:Following the clear break above supply coming in at 1083.2-1078.4 on Friday, the runway north appears clear up to resistance seen at 1095.6 (lurking just below the aforementioned daily swap [supply] area). And taking into consideration that this morning’s opening candle 1078.2 has driven price into demand below at 1069.4-1074.5, which sits just beneath the weekly Quasimodo support (see above), we are relatively confident the price of Gold will likely appreciate from here.
As such, we’ve taken a long position at 1074.09, with a stop set below at 1068.25. Ultimately, we are targeting the aforementioned H4 resistance level, but we are looking to take partial profits around1082.3 area due to any residual orders being left over fromthe break above supply. It will be interesting to see how this pans out.
Levels to watch/live orders:
- Buys:1074.09 [LIVE] (Stop loss: 1068.25).
- Sells: Flat (Stop loss: N/A).


