A note on lower timeframe confirming price action…
Waiting for lower timeframe confirmation is our main tool to confirm strength within higher timeframe zones, andhas really been the key to our trading success. It takes a little time to understand the subtle nuances, however, as each trade is never the same, but once you master the rhythm so to speak, you will be saved from countless unnecessary losing trades. The following is a list of what we look for:
- A break/retest of supply or demand dependent on which way you’re trading.
- A trendline break/retest.
- Buying/selling tails – essentially we look for a cluster of very obvious spikes off of lower timeframe support and resistance levels within the higher timeframe zone.
- Candlestick patterns. We tend to only stick with pin bars and engulfing bars as these have proven to be the most effective.
For us, lower timeframe confirmation starts on the M15 and finishes up on the H1, since most of our higher timeframe areas begin with the H4.
EUR/USD:
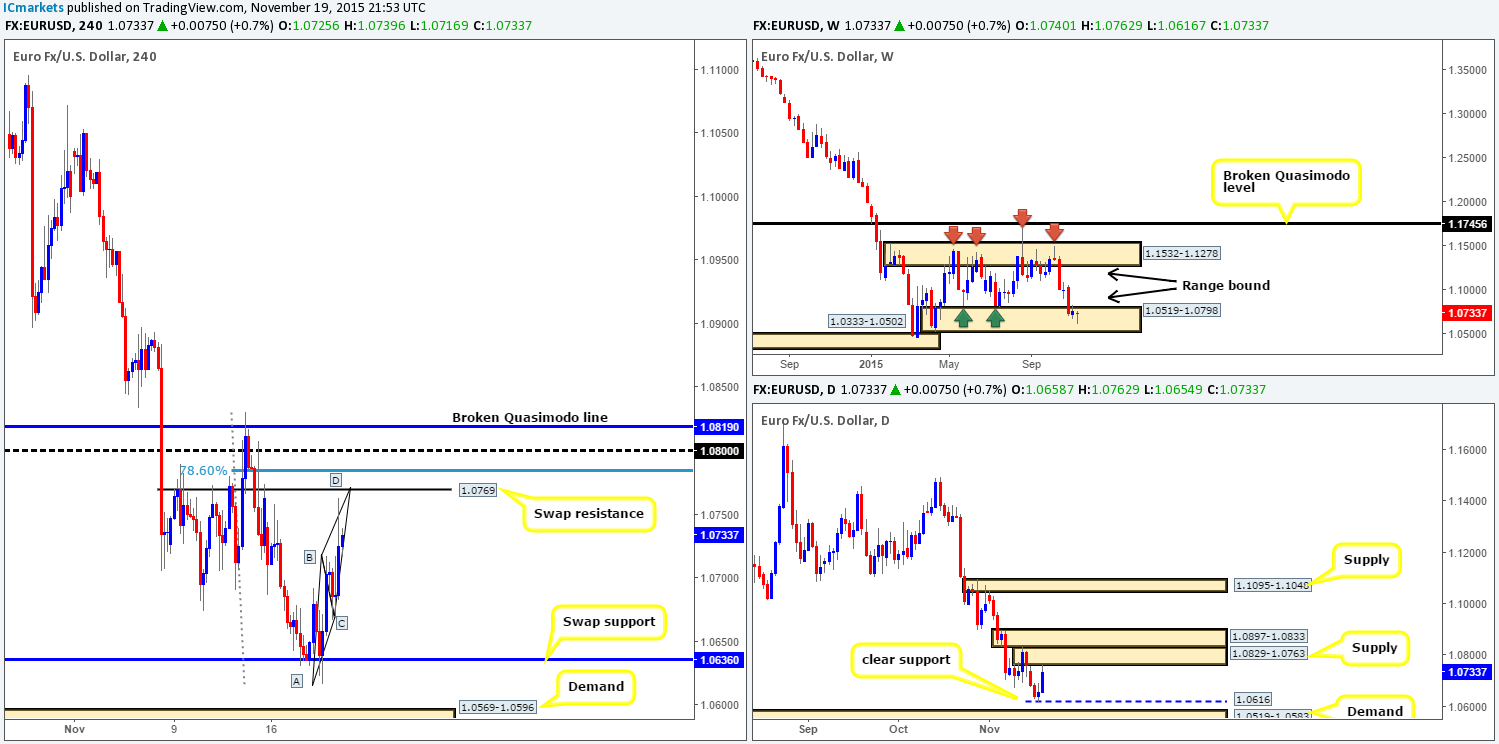
Beginning from the top this morning, weekly buyers are now in the process of forming a bullish pin-candle from within range demand seen at 1.0519-1.0798. However, down on the daily chart, price has connected with a supply zone drawn from 1.0829-1.0763, which could suppress this current weekly buying interest.
Moving down one more level into the H4 timeframe, we can see that recent trade rallied beautifully from the swap support level at 1.0630. This has, as you can see, almost completed a bearish AB=CD pattern that terminates perfectly around the swap resistance level drawn from 1.0769.
Given the above points, we are going to be looking to short this market today between the aforementioned swap resistance level and its merging78.6% Fibonacci resistance barrier just above it at 1.0784. The only drawback to this trade comes from price seen buried within weekly demand (see above). Therefore, our team will only be permitted to short this pair should lower timeframe resistances also be seen holding firm.
Levels to watch/live orders:
- Buys:Flat (Stop loss: N/A).
- Sells: 1.0769/1.0784 [Tentative – confirmation required] (Stop loss: dependent on where one confirms this area).
GBP/USD:
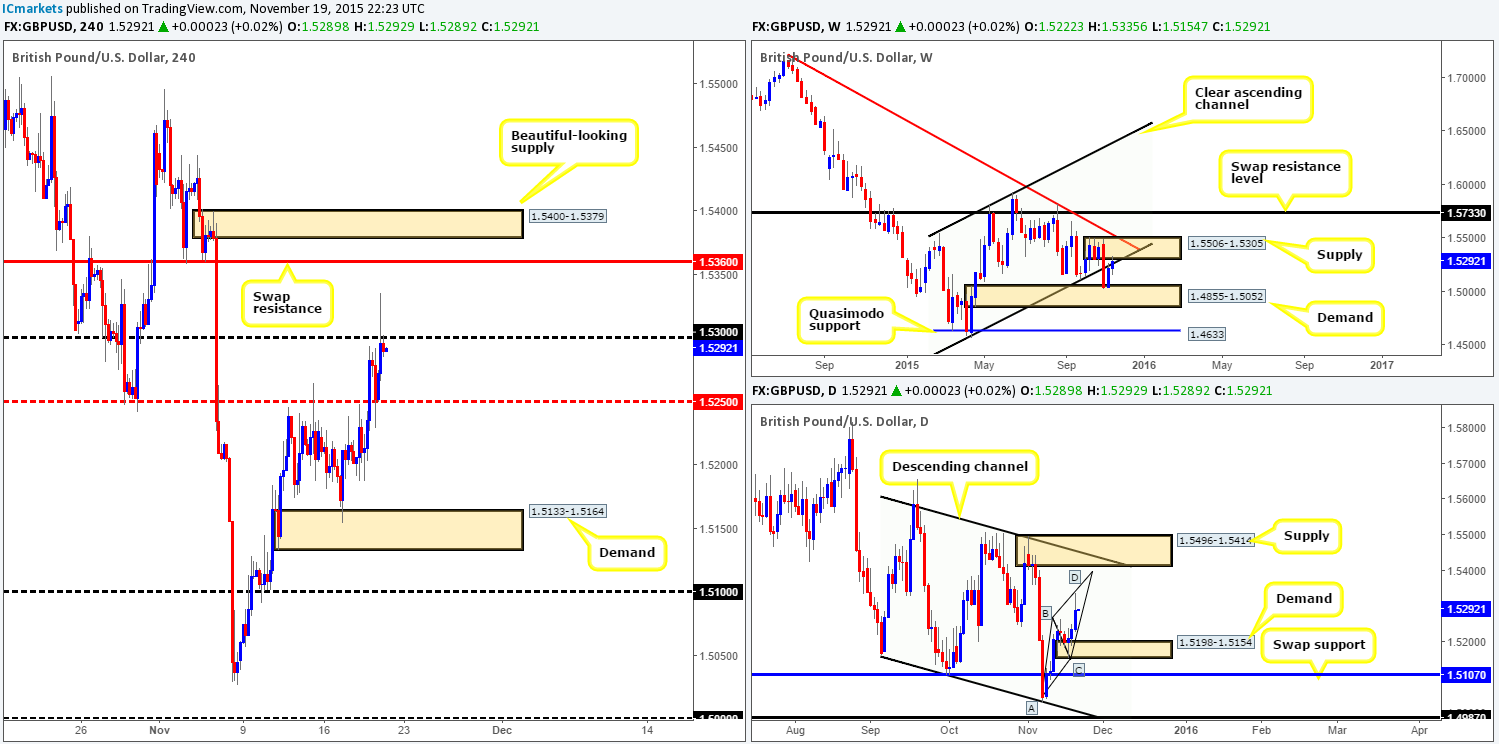
During the course of yesterday’s sessions we saw Cable explode north, breaking above and retesting mid-level resistance 1.5250, which followed with an aggressive attack on psychological resistance 1.5300.
Now, looking at the weekly structure, price is currently kissing the underside of a solid supply zone seen at 1.5506-1.5305. Meanwhile, however, down in the pits of the daily timeframe, the GBP appears to be in the process of completing the D-leg of an AB=CD bearish pattern which tops out around the 1.5393 mark.
Taking the above into account… here’s what we have noted down so far:
- One could look to short 1.5300 today back down to 1.5250, supported by price hitting weekly supply (see above). However, with the daily action showing room to move higher, we’ll pass on this.
- A break above and retest of 1.5300 could potentially be a nice trade should lower timeframe confirmation be seen, with a target objective seen at the swap resistance 1.5360.
- Ultimately though, this is what we’re really looking to see to sell into this market…. Price fake above the swap resistance at 1.5360 deep into supply at 1.5400-1.5379. The reasons for why is not only will price then be trading within a very nice-looking H4 supply, but it will also be crossing swords with the daily AB=CD top at 1.5393, and positioned deep within the above said weekly supply – an absolute perfect sell zone!
Levels to watch/ live orders:
- Buys: Watch for offers to be consumed at 1.5300 and then look to trade any retest seen at this number (confirmation required).
- Sells: 1.5300 [Tentative – confirmation required] (Stop loss: dependent on where one confirms this level) 1.5400-1.5379 (Stop loss: 1.5425).
AUD/USD:
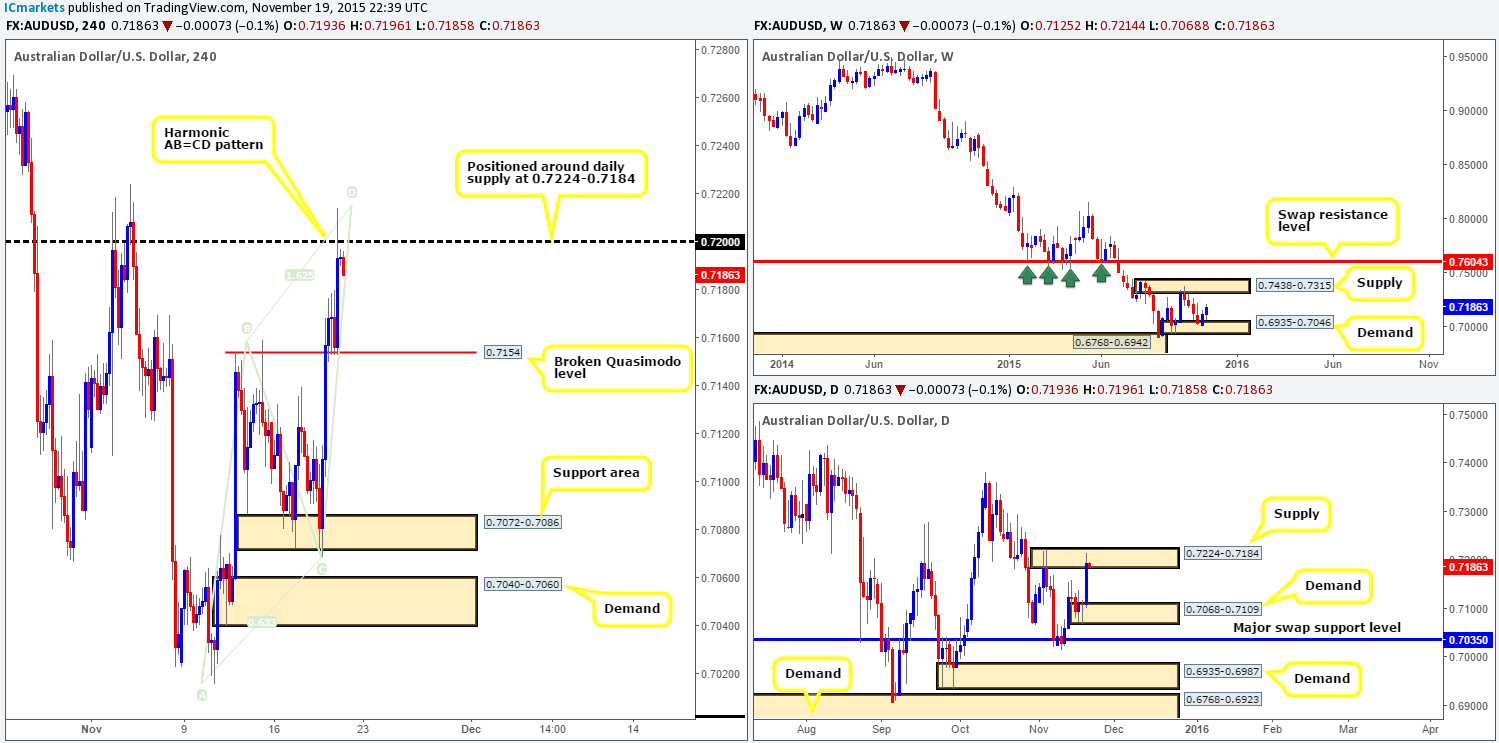
Following a break above and retest of the H4 Quasimodo level at 0.7154; the Aussie continued to advance north yesterday reaching highs of 0.7214 on the day. Consequent to this recent movement, a clear H4 (also seen just as clear on the daily timeframe) Harmonic AB=CD bearish pattern completed at around 0.7215. Not only this, price is now trading around both psychological resistance 0.7200 and also within daily supply coming in at 0.7224-0.7184. This is shaping up to be a perfect sell zone, right? Not quite. We still have to take into account that weekly action is trading from demand at 0.6935-0.7046.
However, this does not mean the market will not bounce lower from current prices. If we happen to see price retrace to collect any unfilled sell orders around the 0.7200 figure, we’ll begin looking for a confirmed short into this market, eyeing the broken Quasimodo level at 0.7154 as our immediate take-profit target.
Levels to watch/ live orders:
- Buys: Flat (Stop loss: N/A).
- Sells: Look for a retrace back up to 0.7200 to sell [Tentative – confirmation required] (Stop loss: dependent on where one confirms this level).
USD/JPY:
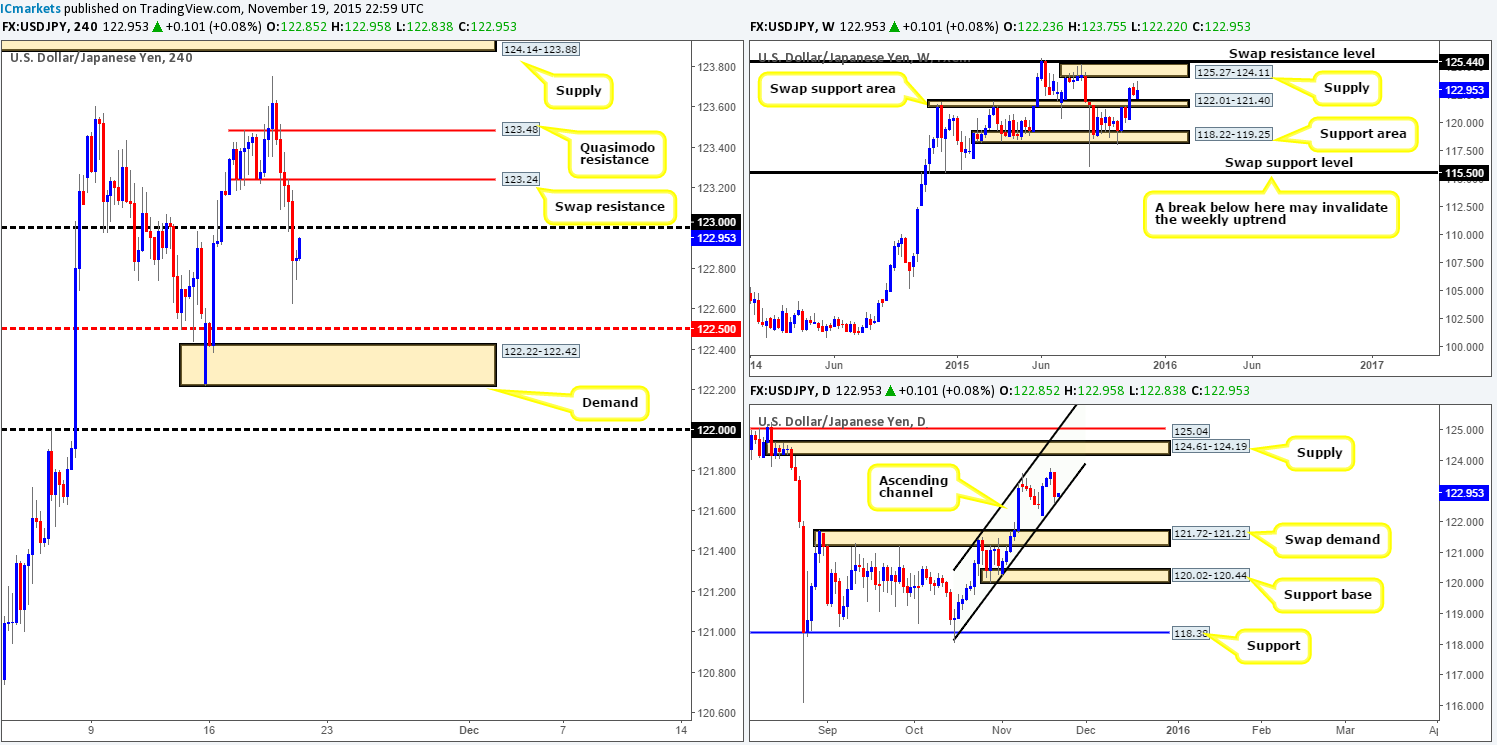
As can be seen from the H4 chart, the USD/JPY spent much of yesterday in the red. Psychological support 123.00 was wiped out, and price managed to reach lows of122.62 on the day. Despite this, current action shows this market pulling back to the underside of 123.00 as resistance – time to be looking to short?
From the weekly, we can see price still loitering between a swap support area coming in at 122.01-121.40 and a supply area seen at 125.27-124.11. However, down on the daily chart, price is enclosed within an ascending channel taken from 118.06/121.47, and, as you can see, is now flirting with the lower limits of this structure. Therefore, to answer the question above in bold, we would not feel comfortable selling from 123.00. In fact, we are going to be looking for it to break and potentially give us a confirmed buying opportunity on the retest. In the event that our analysis is correct and we do manage to spot a confirming setup long on the lower timeframes, we’ll be looking to close partial profits at 123.24, followed by the Quasimodo resistance level at 123.48.
Levels to watch/ live orders:
- Buys:Watch for offers to be consumed at 123.00 and then look to trade any retest seen at this level (confirmation required).
- Sells: Flat (Stop loss: N/A).
USD/CAD:
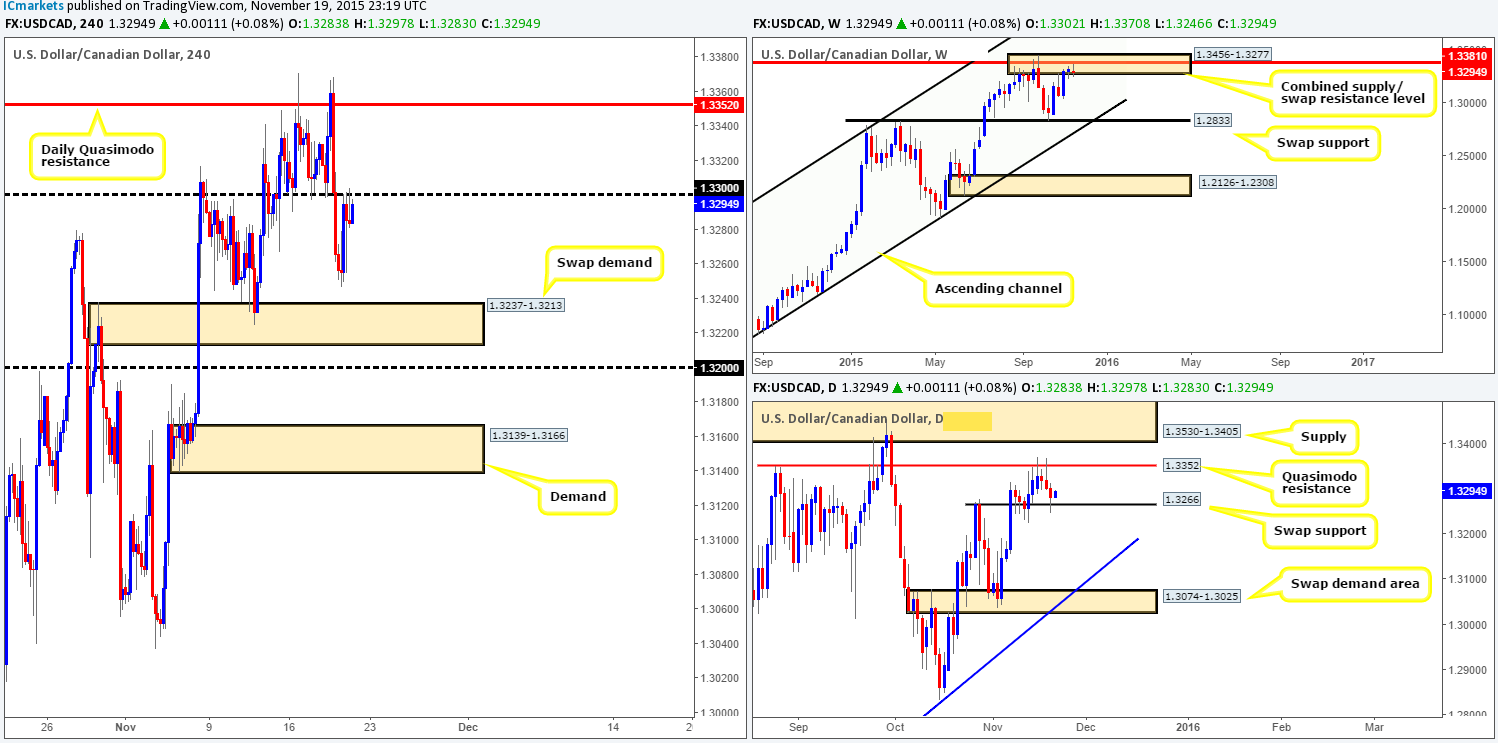
The USD/CAD pair, as you can see, failed to hold at psychological support 1.3300 as price aggressively headed south yesterday, reaching lows of 1.3246 on the day. It was from this point – the London open, did we see things begin to stabilize, and eventually rally north to retest the underside of 1.3300, which, at this point time, appears to be holding firm.
Now, the question is, will this level continue to hold and maybe push lower so that we can profit? Well, with the weekly action currently rebounding from a weekly supply/ swap resistance area seen at 1.3456-1.3277/1.3381, we would say yes. Nevertheless, looking down to the daily action, there is a troublesome swap support level drawn from 1.3266 presently holding this market higher.
To be honest, it is a tricky one! The only logical path we see is to let price action lead the way or just pass on this pair altogether. What we mean by letting price action lead the way is to watch how the action behaves on the 30/60 minute timeframe around 1.3300 today.If one is able to spot a lower timeframe short, then we would go ahead with shorts. Conversely, if a break above and retest of 1.3300 is seen alongside lower timeframe confirming price action, then we would say its best to follow and jump in long.
Levels to watch/ live orders:
- Buys:Watch for offers to be consumed at 1.3300 and then look to trade any retest seen at this level (confirmation required).
- Sells: 1.3300 [Tentative – confirmation required] (Stop loss: dependent on where one confirms this level).
USD/CHF:
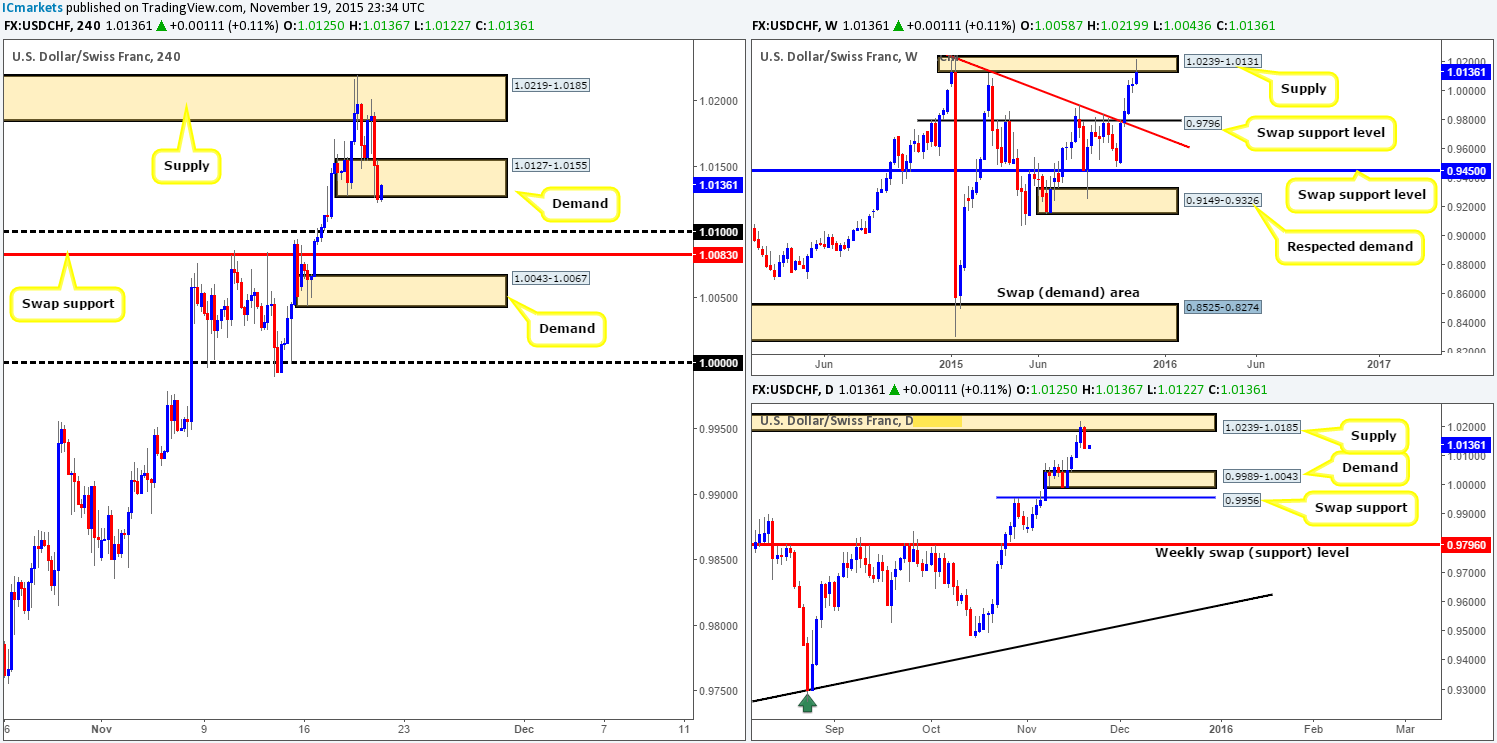
In our previous report (http://www.icmarkets.com/blog/thursday-19th-november-daily-technical-outlook-and-review/), we noted that we were (and still are) short from 1.01882. Price quickly hit our first take-profit target – H4 demand at 1.0127-1.0155, where we took 50% of our position off the table. Following this, price reversed back up to breakeven and then heavily sold off going into U.S. trade, consequently closing below the above said demand.
With a number of stops likely being taken out from the recent drive below demand, we feel, barring any news of course, that the path is now free down towards psychological support 1.0100. Due to the current events, our stop has been moved to breakeven, and we’re now waiting for price to hit its second take-profit target – 1.0100. Ultimately, with price trading around both weekly supply (1.0239-1.0131) and daily supply (1.0239-1.0185) at the moment, this market could depreciate much further, thus we are quite happy to leave our position open over the weekend.
In the event that price does take us out at breakeven, however, this is certainly not the end! We would be confident to begin looking to short this market once again due to where price is positioned on the higher timeframe structures (see above).
Levels to watch/ live orders:
- Buys:Flat (Stop loss: N/A).
- Sells:1.01882 [LIVE] (Stop loss: Breakeven).
DOW 30:
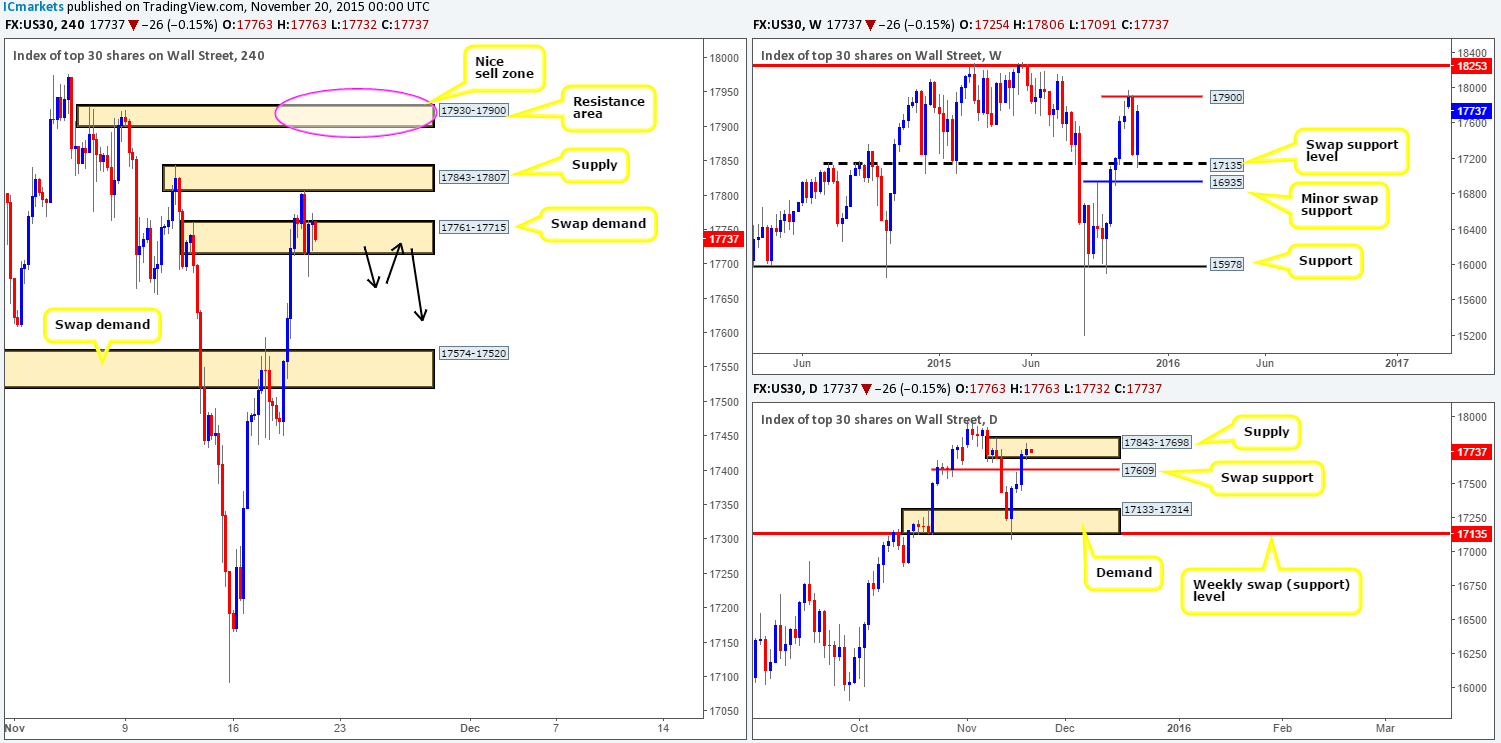
Following the close above H4 supply (now demand) at 17761-17715, the DOW advanced higher to connect with the underside of H4 supply at 17843-17807, which, as you can see, pushed price back down deep into the aforementioned swap demand by the day’s end. With price seen holding firm at this area right now, where do we see this market heading today?
Well, before looking to today’s possible movement, let’s take a quick peek at the higher timeframe picture… Up on the weekly chart, price continues to press forward following the rebound from swap support at 17135. Should this upside momentum remain firm, it is likely we’ll see price touch gloves with 17900 very soon. Down on the daily chart, however, the buyers and sellers are seen battling for position within supply coming in at 17843-17698.
As such, similar to yesterday’s analysis, we would still consider taking a short trade (alongside lower timeframe confirmation) from the current H4 supply if price retested it for a second time today (we missed yesterday’s move altogether). With that being said though, right now we’d much rather trade the following:
- Look for confirmed shorts around the H4 resistance area above at 17930-17900. Granted, it is positioned a little above the current daily supply, but it merges so nicely with the weekly level 17900.
- A close below the current H4 swap demand area alongside a retest as supply could potentially open the doors to a very nice short trade down to the daily swap (support) level at 17609 (see black arrows). We would recommend waiting for the lower timeframes to confirm selling strength exists on the retest since there is nothing worse than getting caught on the wrong side of a fakeout!
Levels to watch/ live orders:
- Buys:Flat (Stop loss: N/A).
- Sells:17843-17807 [Tentative – confirmation required] (Stop loss: dependent on where one confirms this area) 17930-17900 [Tentative – confirmation required] (Stop loss: dependent on where one confirms this area) watch for bids to be consumed at 17761-17715 and then look to trade any retest seen at this area (confirmation required).
XAU/USD: (Gold)
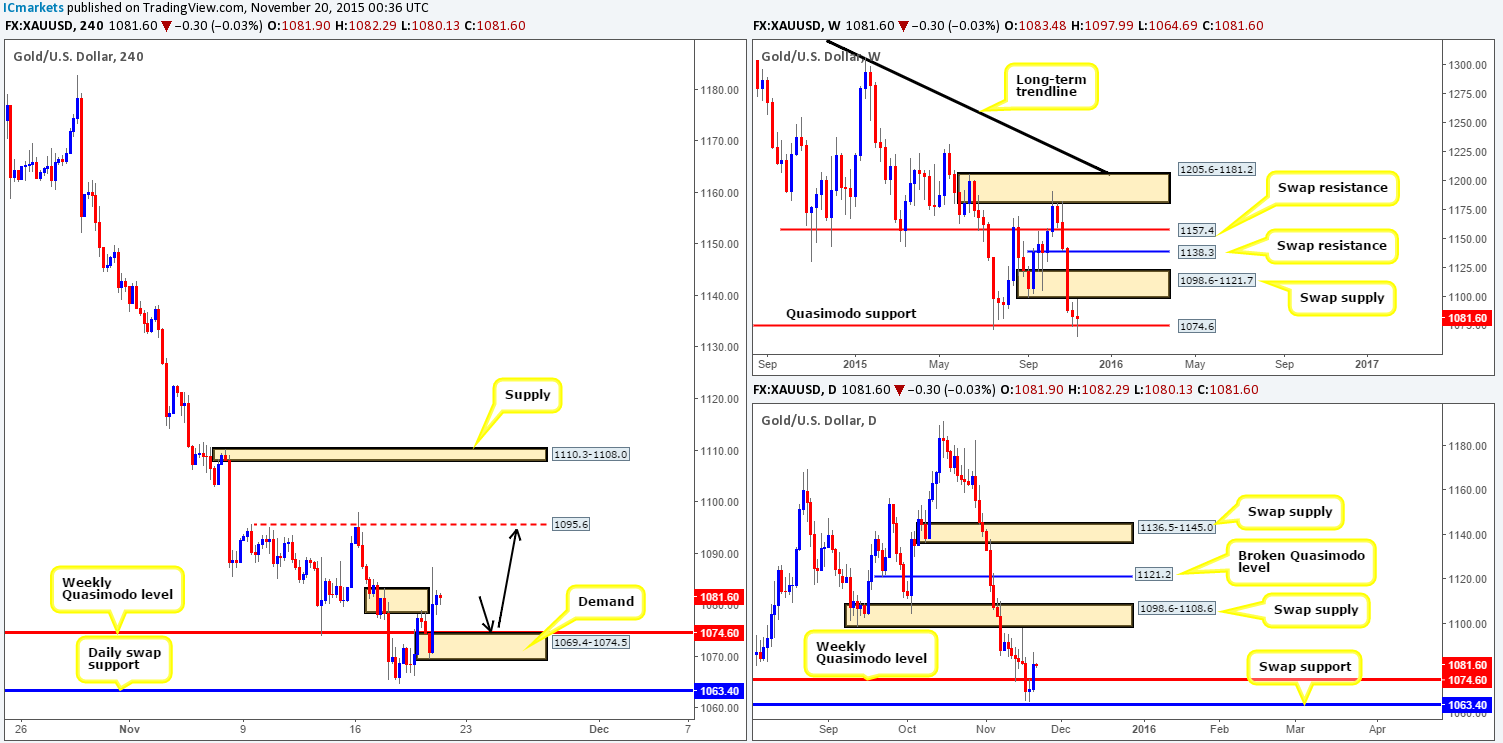
Beginning this morning’s analysis with a look at the weekly timeframe shows that even though price was able to penetrate the Quasimodo support level at 1074.6, buying pressure drove price back above this level, thus suggesting bid strength for the time being. This momentum can be clearly seen on the daily timeframe, with price rallying from just above the swap support barrier coming in at 1063.4. As long as the buyers can remain dominant above the weekly hurdle 1074.6, there’s little reason (technically) not to see a rally north up to the swap supply drawn from 1098.6-1108.6.
Turning our attention to the H4 timeframe, we can see that this recent surge in buying aggressively took out supply at 1083.2-1078.4, reaching highs of 1087.3 on the day. Consequent to this, the path north appears clear up to resistance seen at 1095.6 (lurking just below the aforementioned daily swap [supply] area). For this reason, our plan of attack today will consist of waiting to see if price can retest and hold above 1074.6 (which is also H4 demand at 1069.4-1074.5). If price does indeed hit this H4 demand, depending on what news is due at that time, we’d have no hesitation to enter long at market here.
Levels to watch/live orders:
- Buys:1069.4-1074.5 (Stop loss: 1068.2).
- Sells: Flat (Stop loss: N/A).