
A note on lower timeframe confirming price action…
Waiting for lower timeframe confirmation is our main tool to confirm strength within higher timeframe zones, and has really been the key to our trading success. It takes a little time to understand the subtle nuances, however, as each trade is never the same, but once you master the rhythm so to speak, you will be saved from countless unnecessary losing trades. The following is a list of what we look for:
- A break/retest of supply or demand dependent on which way you’re trading.
- A trendline break/retest.
- Buying/selling tails/wicks – essentially we look for a cluster of very obvious spikes off of lower timeframe support and resistance levels within the higher timeframe zone.
- Candlestick patterns. We tend to only stick with pin bars and engulfing bars as these have proven to be the most effective.
We search for lower timeframe confirmation between the M15 the H1 timeframes, since most of our higher-timeframe areas begin with the H4. Stops are usually placed 5-10 pips beyond confirming structures.
EUR/USD:
Weekly gain/loss: – 96 pips
Weekly closing price: 1.1217
Weekly opening price: 1.1206
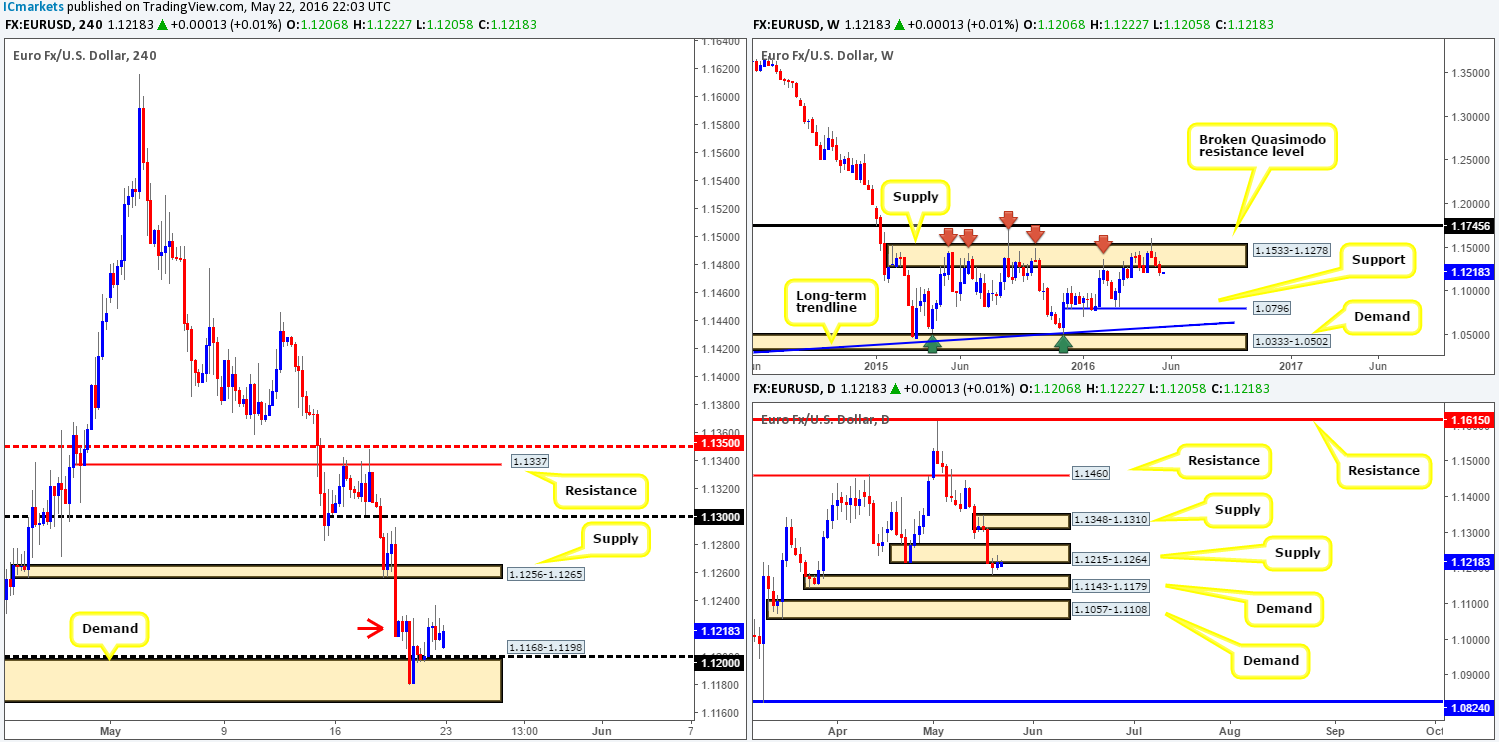
Weekly view: Last week’s 100-pip decline marks third consecutive bearish week for this pair. The big question for us now is how long can the sellers continue pushing this market lower? Well, with the single currency trading from a major area of weekly supply drawn from 1.1533-1.1278 that has capped this market since May 2015, further selling could be possible down to support coming in at 1.0796.
Daily view: Moving down to the daily chart, however, we can see that price is now sandwiched between supply logged in at 1.1215-1.1264 and a demand base formed at 1.1143-1.1179. A break higher would likely clear the rubble for a try at the supply zone seen at 1.1348-1.1310, whereas a push lower would likely place demand at 1.1057-1.1108 in the firing range.
H4 view: A quick recap of Friday’s events on the H4 chart show that the EUR was relatively well-bid from demand at 1.1168-1.1198, which saw price aggressively spike above supply seen marked with a red arrow at 1.1229-1.1211. This spike has likely cleared out a truckload of stops above the aforementioned supply and cleared the path north for this market to challenge supply coming in at 1.1256-1.1265. Looking at this purely from a H4 chart it would seem there is a buying opportunity from around the 1.12 region. Nevertheless, taking into account the higher-timeframe picture (see above in bold) we would not feel comfortable buying right now despite what the H4 chart suggests.
Our suggestions: Watch for price to take out the current H4 demand since this would likely open the gates for a challenge of H4 demand seen at 1.1057-1.1096 (sits within the extremes of daily demand at 1.1057-1.1108). A short trade could be a possibility for our team if price retests 1.1168-1.1198 as supply alongside a lower timeframe sell setup (for ways to enter the market at higher-timeframe zones please see the top of this report).
Levels to watch/live orders:
- Buys: Flat (Stop loss: N/A).
- Sells: Watch for price to consume 1.1168-1.1198 and look to trade any retest seen thereafter (lower timeframe confirmation required).
GBP/USD:
Weekly gain/loss: + 145 pips
Weekly closing price: 1.4495
Weekly opening price: 1.4503
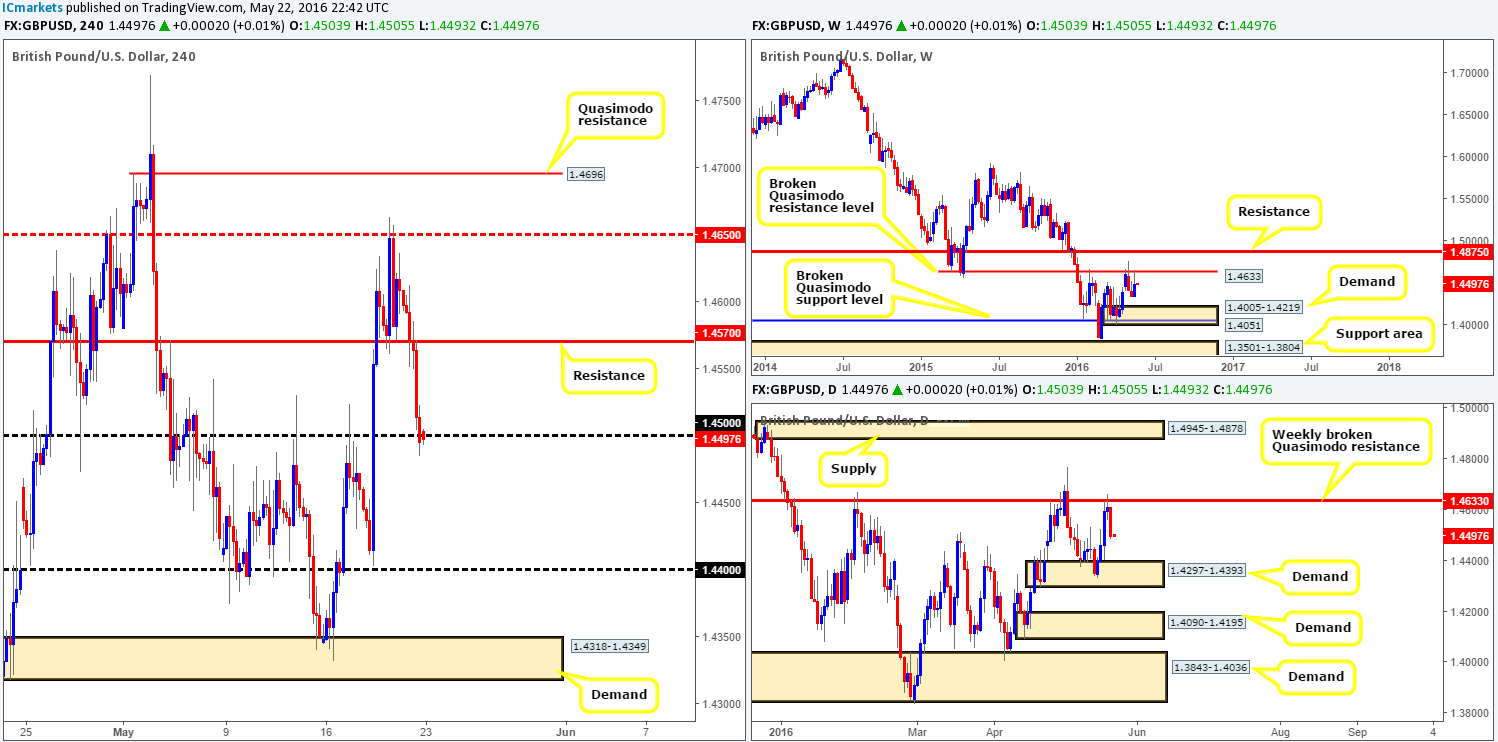
Weekly view: The past week saw the GBP connect with the broken Quasimodo resistance line at 1.4633 for third time this year, which, as you can see, resulted in price selling off going into the week’s end. As long as the sellers remain in good shape from here, we see little structure stopping this pair from hitting demand carved from 1.4005-1.4219. If the sellers fail to defend 1.4633 on the other hand, keep an eyeball on the resistance level above at 1.4875 as this will likely be the next objective to reach.
Daily view: From the daily scale, this market shows room for price to continue trading lower this week down to demand seen at 1.4297-1.4393. This area has already managed to hold this pair higher from the last sell-off from the aforementioned weekly broken Quasimodo resistance, so this daily demand base will be a KEY zone to watch this week!
H4 view: Looking over to the H4 chart, Friday’s action saw Cable plummet following four consecutive days of buying. Support at 1.4570 was taken out during this bearish assault, which saw price end the week closing around the 1.45 mark. With this market gapping eight pips higher this morning and is now seen to be trading below 1.45 we believe there’s a possible opportunity to sell.
Our suggestions: Should price close below and retest the 1.45 boundary today, a short trade could be up for grabs down to the 1.44 handle, which is essentially the top-side of daily demand mentioned above at 1.4297-1.4393. Although both the weekly and daily timeframes suggest lower prices could be on the horizon right now (see above), do take into account that the H4 chart over on Silver (a highly correlating market to the Pound) is holding above support at 16.313. Therefore, we would only recommend taking a short from 1.45 if and only if lower timeframe confirmation is present. A break/retest of demand, a trendline break/retest or simply a cluster of selling wicks around the 1.45 region would be sufficient enough for us. Stops are usually placed 5-10 pips beyond confirming structures.
Levels to watch/live orders:
- Buys: Flat (Stop loss: N/A).
- Sells: Watch for price to consume 1.45 and look to trade any retest seen thereafter (lower timeframe confirmation required).
AUD/USD:
Weekly gain/loss: – 48 pips
Weekly closing price: 0.7217
Weekly opening price: 0.7217
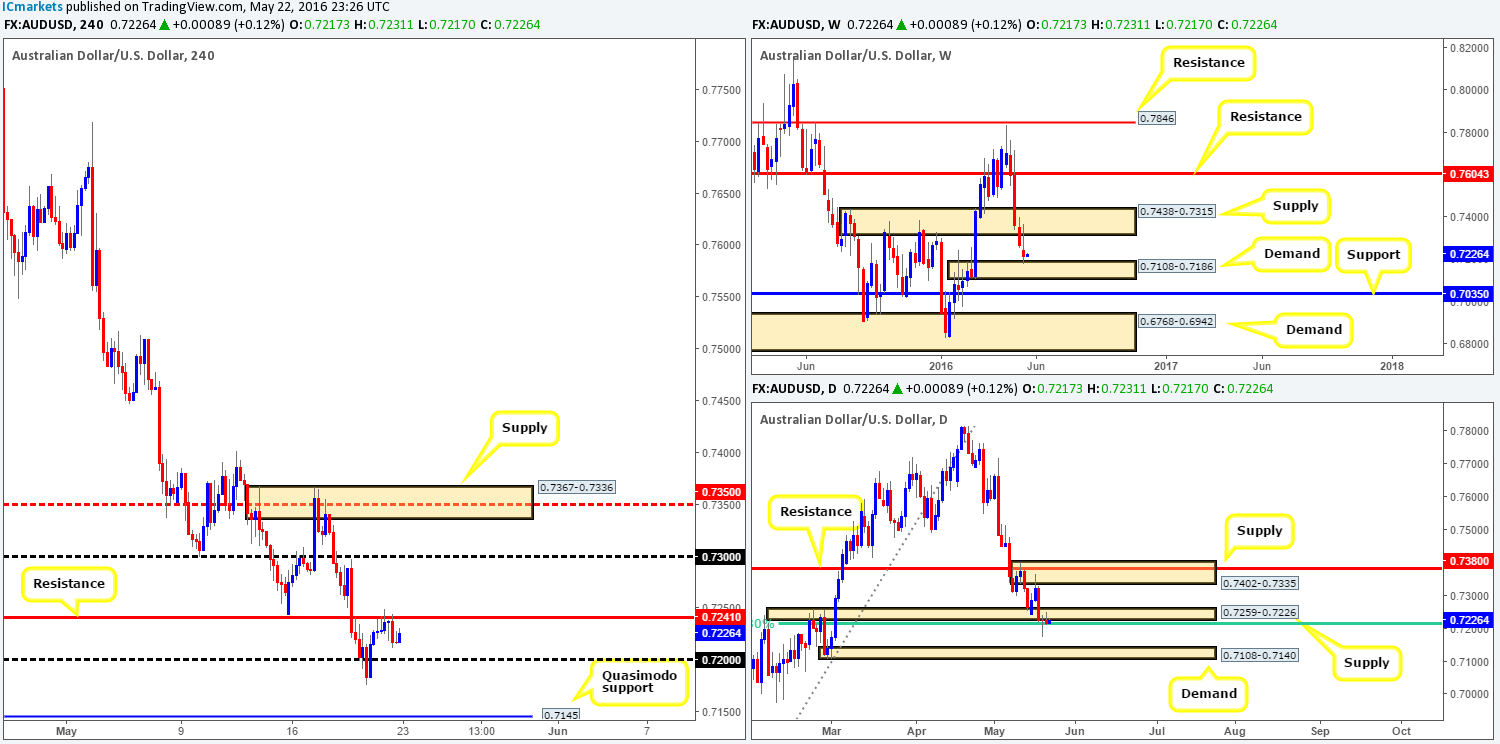
Weekly view: After retesting the underside of supply at 0.7438-0.7315 the Aussie continued to trade lower last week, posting its fourth consecutive loss. With the pair now trading from demand coming in at 0.7108-0.7186, we may see the bulls dig in and start clawing higher to recover some of the recent losses. Be that as it may, should the bears continue to weigh down on this pair, keep a tab on support drawn from 0.7035, followed closely by demand at 0.6768-0.6942 as these areas will likely be next on the hit list.
Daily view: Turning our attention to the daily chart, the buyers and sellers continue to battle for position between support derived from a 61.8% Fibonacci support at 0.7210 and near-term supply at 0.7259-0.7226. In the event of a breakdown through 0.7210, further downside could be seen to demand at 0.7108-0.7140 (sits within the extremes of the above said weekly demand), meanwhile, a push above the current supply would likely place supply at 0.7402-0.7335 (converges nicely with resistance at 0.7380) back in the limelight.
H4 view: After a relatively quiet day’s trading on Friday price is now seen loitering beneath resistance at 0.7241. Solely from this chart one could say, given how aggressive the bears have been over the past four weeks, selling from this resistance is the way to go. We would agree with this if we were not looking at multiple timeframes. Selling right now would place one against not only daily buyers from the daily Fib support at 0.7210 but also against weekly buyers from demand at 0.7108-0.7186!
Our suggestions: WAIT for price to close below the 0.72 handle before looking to sell this market. Granted, this would not clear weekly buyers from the picture, but it would, assuming price retested 0.72 as resistance and held, likely weaken daily buyers so that a push lower could possibly be seen to 0.7145 – a H4 Quasimodo support that sits just above daily demand at 0.7108-0.7140. For us personally, this trade would require a lower timeframe sell setup to form following the retest of 0.72, since going up against potential weekly strength is not something we’d be comfortable with simply by entering at market (for ways to enter the market at higher-timeframe zones please see the top of this report).
Levels to watch/live orders:
- Buys: Flat (Stop loss: N/A).
- Sells: Watch for price to consume 0.72 and look to trade any retest seen thereafter (lower timeframe confirmation required).
USD/JPY:
Weekly gain/loss: + 149 pips
Weekly closing price: 110.09
Weekly opening price: 110.10
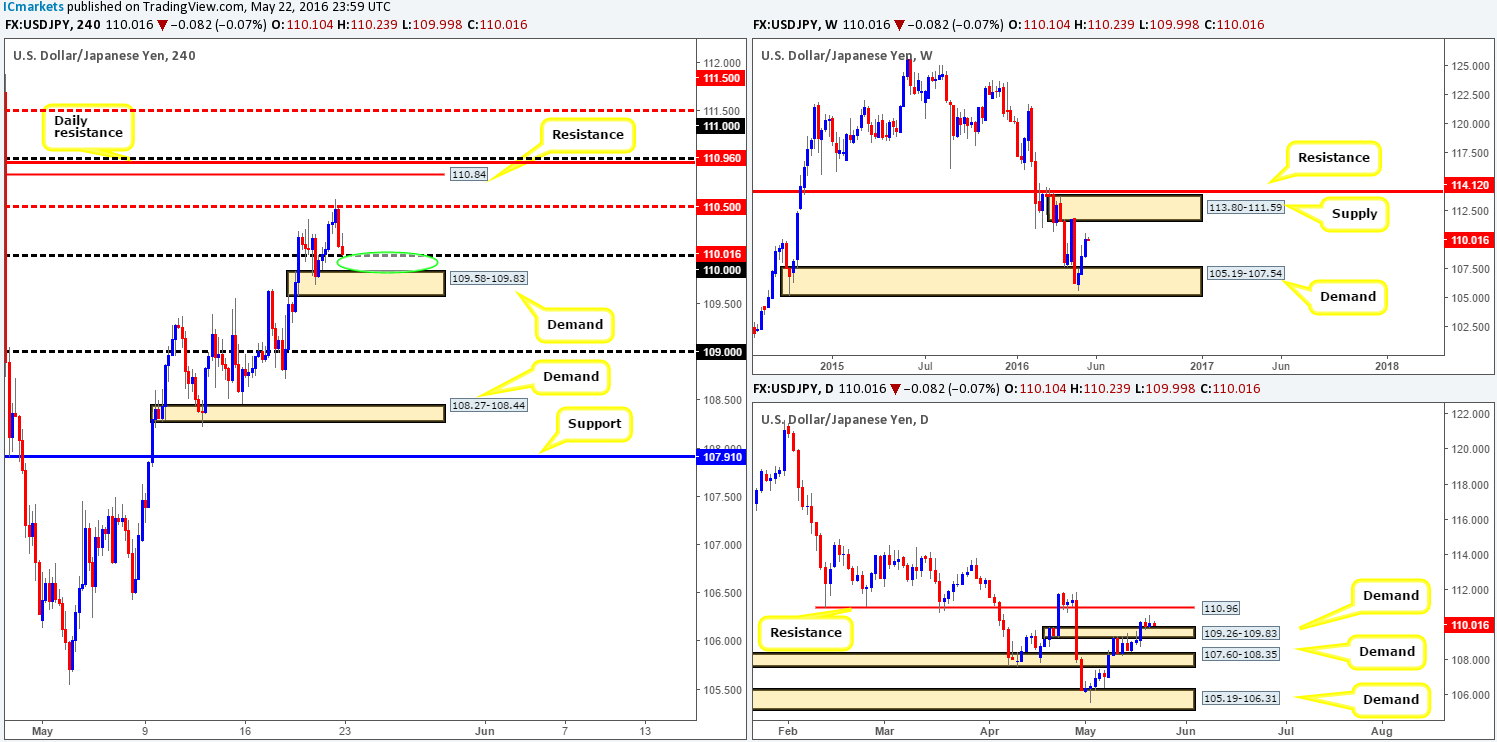
Weekly view: The USD/JPY had another relatively successful week last week, posting its third consecutive weekly gain since connecting with demand chalked up at 105.19-107.54. From a technical standpoint, there is, as far as we can see, scope for further upside in this market this week to the supply zone sitting at 113.80-111.59.
Daily view: Turning over a page to the daily chart, traders will likely see that following the break above supply at 109.26-109.83 on Wednesday, this barrier has held as demand ever since. From this angle, however, the next upside target to be aware of this week falls in at 110.96 – a medium-term resistance line.
H4 view: Consequent to Friday’s rally from demand at 109.58-109.83 (sits within daily demand at 109.26-109.83) and a stable open this morning, price is now lurking a few pips above the 110 handle. Now, with the majority of stops above the mid-way resistance line at 110.50 likely consumed by Friday’s high, trading long from between the aforementioned demand and 110 support (green circle) is certainly something we’ll be watching for on the lower timeframes today (for ways to enter the market at higher-timeframe zones please see the top of this report).
Our suggestions: With both the higher-timeframe charts suggesting that this pair wants higher prices (see above), a long from the 109.83/110 region could rally as high as the 111.00/110.84 zone which would make for a nice first take-profit target (round-number 111.00, daily resistance at 110.96 and H4 resistance at 110.84). Of course price could rally as high as 111.50 as this closely represents the underside of weekly supply discussed above at 113.80-111.59, so do bear this in mind if you’re also considering longs from our buy zone.
Levels to watch/live orders:
- Buys: 109.83/110 region [Tentative – confirmation required] (Stop loss: dependent on where one confirms this area).
- Sells: Flat (Stop loss: N/A).
USD/CAD:
Weekly gain/loss: + 173 pips
Weekly closing price: 1.3107
Weekly opening price: 1.3111
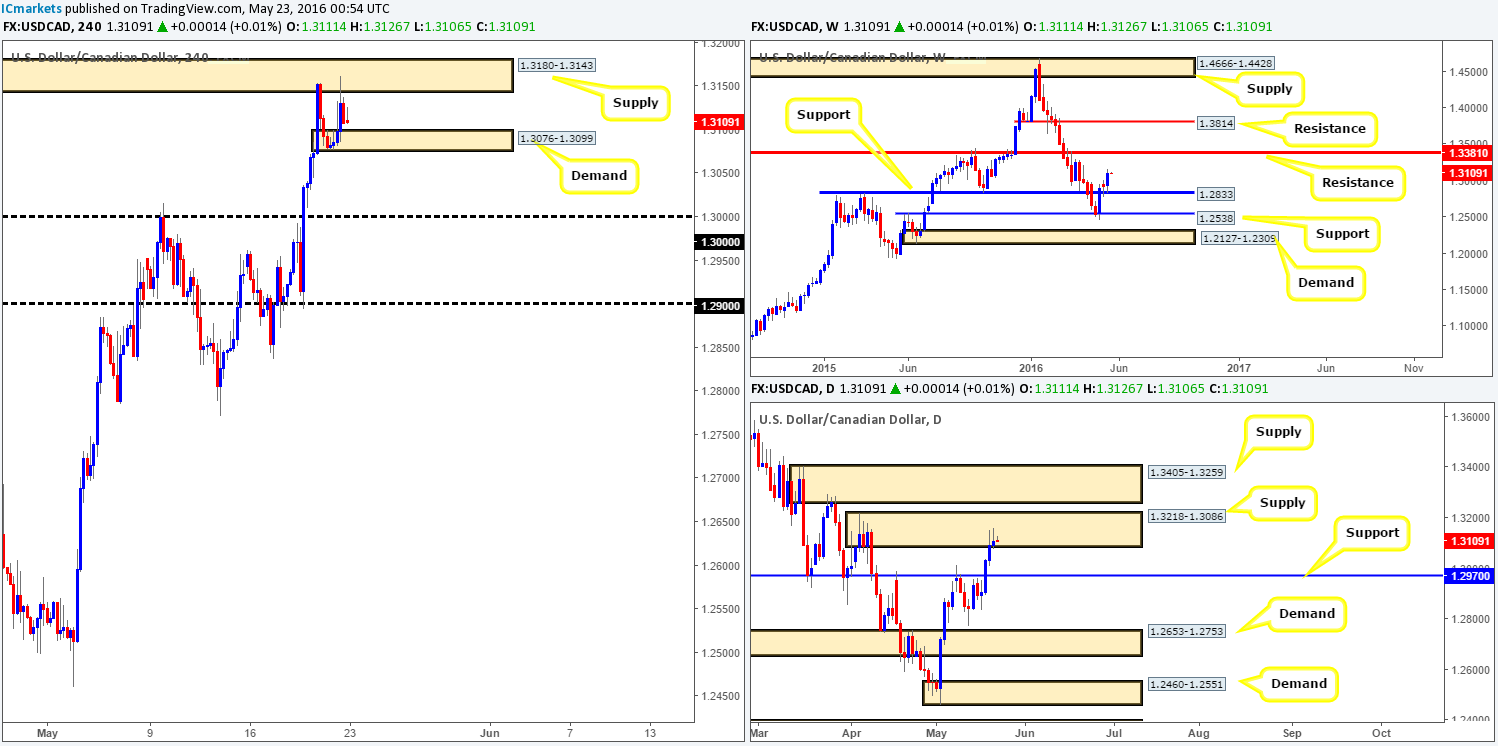
Weekly view: As we can all see from the weekly chart this morning the Loonie extended its bounce from support at 1.2833 last week, registering a positive close of 1.3107 by the week’s end. In the event that bids continue to support this market, it’s possible we’ll see price shake hands with resistance penciled in at 1.3381 sometime soon.
Daily view: By contrast, daily price is currently seen trading from supply at 1.3218-1.3086 – in fact, Friday’s session formed what looks to be a beautiful selling wick. A sell-off from this base could bring prices down into the jaws of support carved from 1.2970 whilst a break above this supply would land this market within supply coming in at 1.3405-1.3259 (encapsulates the aforementioned weekly resistance level).
H4 view: Over on the H4 chart the day started at 1.3111, a few pips above Friday’s close. To our way of seeing things at the moment the balance of bids to offers here appear even right now. We have supply capping the upside at 1.3180-1.3143, and demand capping downside at 1.3076-1.3099. There is, as you can see, very little space seen in between these two zones to consider playing this range unless you find entries with small stops, so our team is looking beyond these barriers right now.
Our suggestions: Watch for a close above the current H4 supply and look to trade any retest seen thereafter. Assuming we’re able to pin down a lower timeframe entry following the retest, we’d be looking to target the H4 supply above at 1.3295-1.3255 (located within daily supply at 1.3405-1.3259). By entering long here you would be buying into daily supply at 1.3218-1.3086, we admit, but at the same time you’d be joining weekly flow from a major weekly support (see above).
On the flip side, one can also keep an eye out for a close beyond the current H4 demand and look to trade any retest seen thereafter. Similar to above, assuming we were able to pin down a lower timeframe entry following the retest, we’d be looking to target the 1.30 handle due to this being a large psychological number and is also positioned just above daily support at 1.2970. Here, however, you’d be trading against weekly flow from support but in-line with daily flow from the current daily supply (see above).
In closing, we would recommend only trading the above setups WITH sound lower timeframe price action. This, at least for us, gives us added confidence that price will likely move in our favor (for ways to enter the market at higher-timeframe zones please see the top of this report).
Levels to watch/live orders:
- Buys: Watch for price to consume 1.3180-1.3143 and look to trade any retest seen thereafter (lower timeframe confirmation required).
- Sells: Watch for price to consume 1.3076-1.3099 and look to trade any retest seen thereafter (lower timeframe confirmation required).
USD/CHF:
Weekly gain/loss: +145 pips
Weekly closing price: 0.9897
Weekly opening price: 0.9909
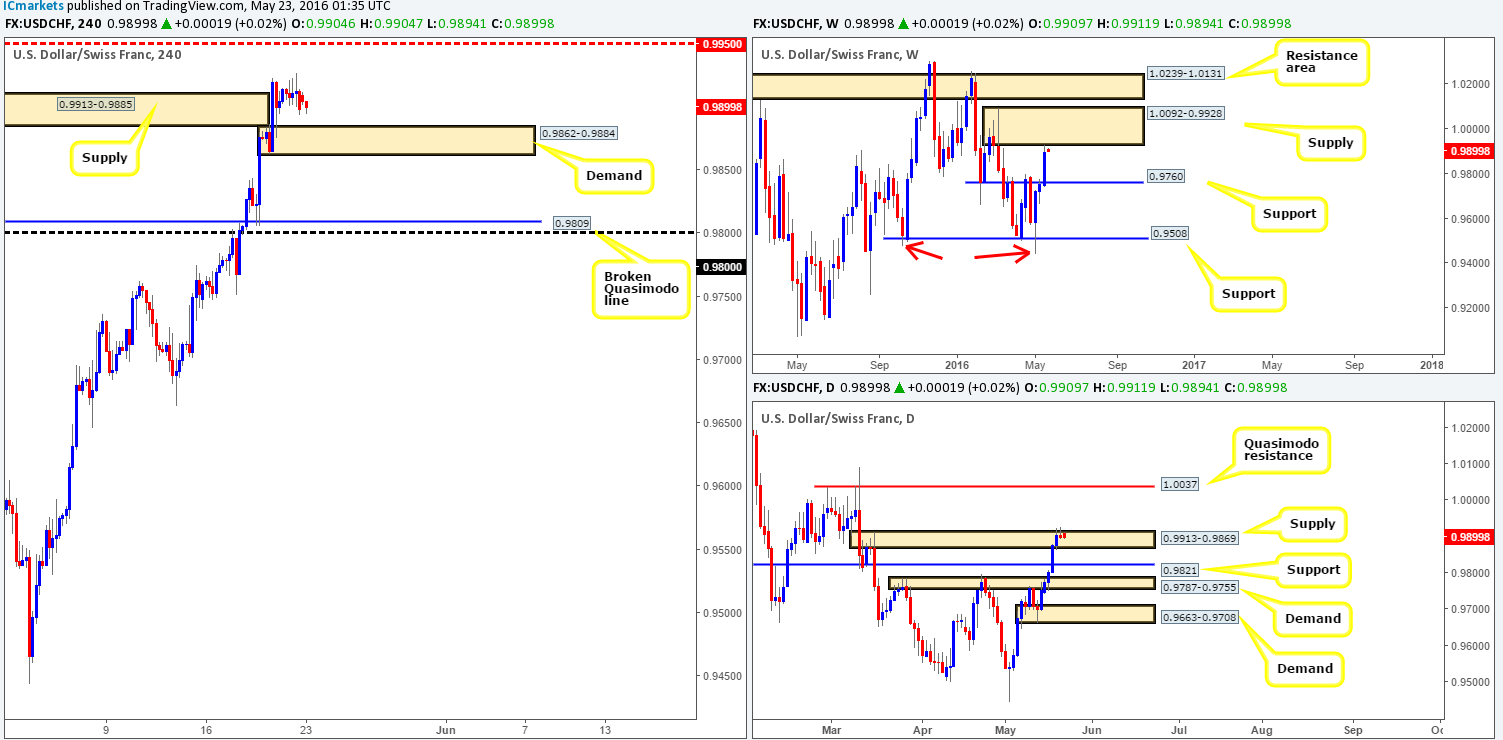
Weekly view: Last week’s sharp run to the upside brought this pair within two pips of supply chalked in at 1.0092-0.9928, recording its third consecutive weekly gain. Technically, we feel this pair will decline in value from the current supply zone due to price painting fresh lows three weeks ago (see red arrows). Therefore, the expectation is for a new lower low to eventually form. However, due to the size of this weekly supply price could drive higher before we see weakness come into the market.
Daily view: Thanks to Friday’s spike above supply at 0.9913-0.9869, a truckload of stops were likely taken out from above this zone. In the event that bids now outweigh offers here, it is likely we’ll see price gravitate to the next point of resistance – a Quasimodo line drawn from 1.0037 (lodged within the extremes of the current weekly supply). So this level is certainly somewhere to keep an eyeball on this week!
H4 view: In light of Friday’s sessions seeing very little action and this morning’s open not making much of a difference to the overall structure, here is what we have logged going forward:
- H4 supply at 0.9913-0.9885 is, in our opinion, now consumed.
- H4 demand at 0.9862-0.9884 is fresh and has ‘trade me’ written all over it!
- Upside targets from this H4 demand can be seen at the mid-way resistance 0.9950, followed closely by parity (1.0000).
Our suggestions: With the current daily supply looking weak and the H4 structure in mind (see above) our team is bullish this pair at least until parity comes into view. Therefore, if one is able to spot a lower timeframe buy setup from the current H4 demand, it may be worth a shot, targeting 0.9950 and closing the remainder at parity (for confirming techniques please see the top of this report). The reason for requiring confirmation here is simply due to weekly price now tickling the underside of weekly supply (see above). In regards to selling this market, we really like the daily Quasimodo resistance at 1.0037 coupled with parity as a sell zone, which let’s not forget is also housed within the extremes of the above said weekly supply. Therefore, it may be an idea to note this zone down for future use.
Levels to watch/live orders:
- Buys: 0.9862-0.9884 [Tentative – confirmation required] (Stop loss: dependent on where one confirms this area).
- Sells: 1.0037/1.0000 [Tentative – confirmation required] (Stop loss: dependent on where one confirms this area).
DOW 30:
Weekly gain/loss: – 29 points
Weekly closing price: 17511
Weekly opening price: 17511
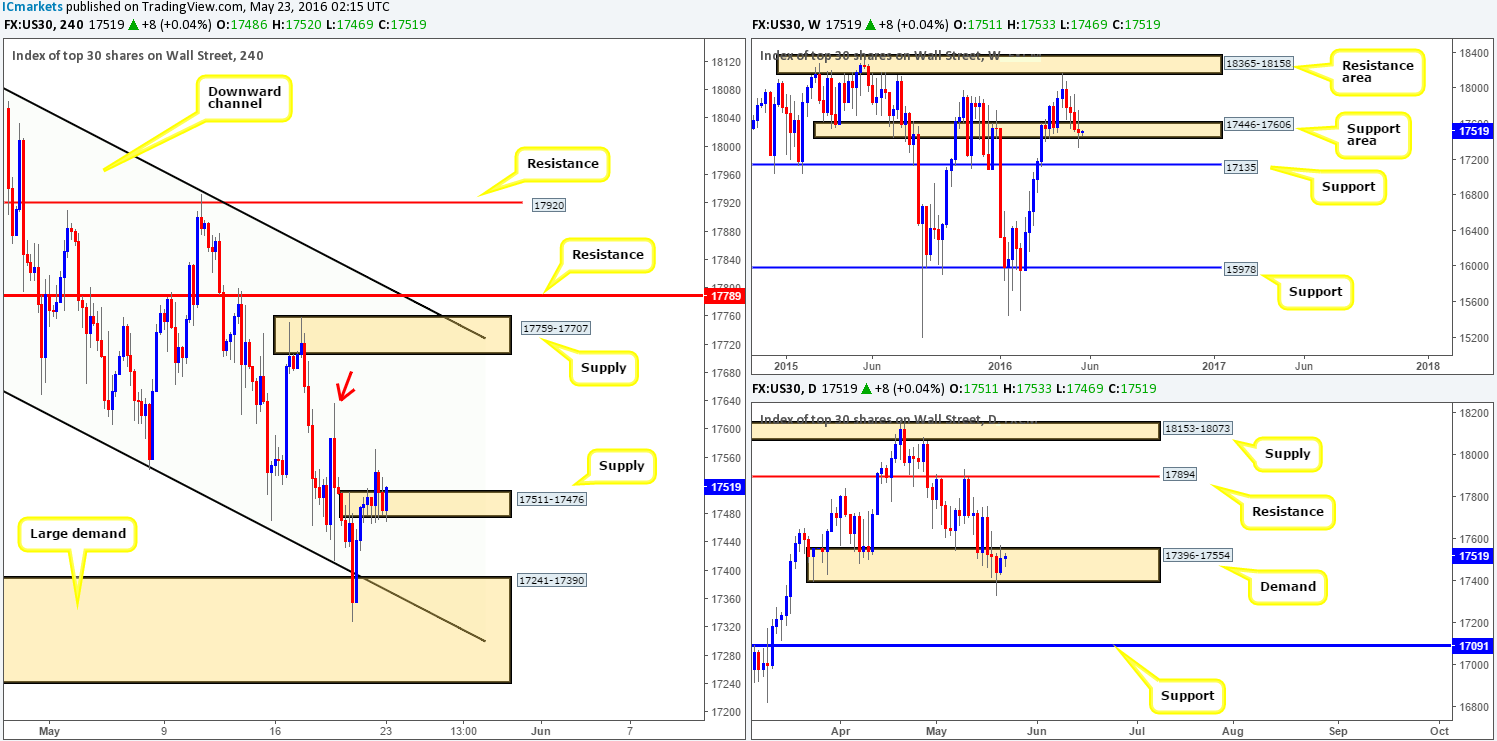
Weekly view: Since the Dow connected with supply at 18365-18158, this index has been grinding lower week-by-week. Recent price action, however, suggests that there’s an air of uncertainty (see the indecision candle) around the current support area carved from 17446-17606. Therefore, traders need to be prepared for the possibility that this support area may cave in and price may head lower to touch gloves with support fixed at 17135.
Daily view: With an indecisive week’s trading last week, daily action remains trading within demand seen at 17396-17554, despite spiking to new lows on Thursday. From our perspective, upside potential from this base looks fairly limited with a lot of wood to chop through around the 17705/17533 region. Below the current demand, nevertheless, downside potential looks clean until support comes into view at 17091.
H4 view: After a rather lackluster day’s trading on Friday, and a stable open this morning, here is what we see on the H4 at present…
Following Thursday’s rally higher, price went on to engulf supply at 17511-17476 on Friday. This, as we mentioned in Friday’s report, would, at least for us, be considered a bullish signal to enter long around the top-side of the H4 demand at 17241-17390 with a stop below it at 17235.
Our suggestions: Now, given the weakness being seen around the weekly support area and with daily demand not really having a good time at the moment (see above), we will now only consider a long from the current H4 demand if and only if lower timeframe confirmation presents itself. And due to this demand being a rather large zone, we will only be looking for confirming entries between the M30 and M60 timeframes (for ways to enter the market at higher-timeframe zones please see the top of this report). In the event that above setup comes to fruition, we’ll be looking to target logical H4 supply formed on approach to our buy zone as a first take-profit area, likely followed by the H4 high seen marked with a red arrow at 17637 and then H4 supply at 17759-17707.
Levels to watch/live orders:
- Buys: 17241-17390 [Tentative – confirmation required] (Stop loss: dependent on where one confirms this area).
- Sells: Flat (Stop loss: N/A).
GOLD:
Weekly gain/loss: – $21
Weekly closing price: 1251.8
Weekly opening price: 1251.8
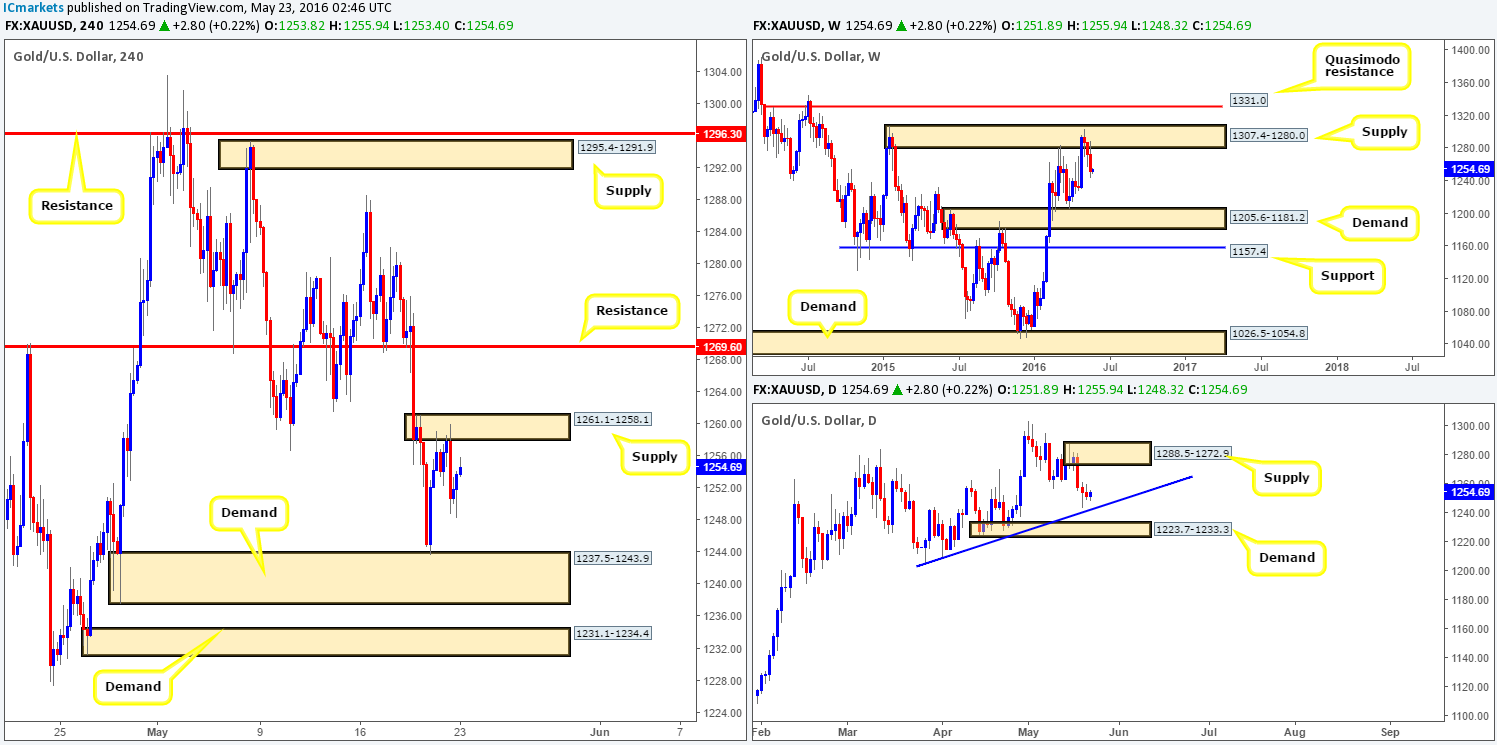
Weekly view: Beginning with the weekly timeframe this morning, we can see that price, once again, was hammered lower last week, reaching lows of 1243.7. Some will very likely disagree with us when we say that we think the yellow metal still has potential to decline further over the coming weeks. We firmly believe the next downside target sits around demand coming in at 1205.6-1181.2 which has already bounced price twice already (22/02/16 – 28/03/16). It will be interesting to see what the lower timeframes have to offer…
Daily view: From this viewpoint, gold spent Thursday and Friday’s sessions trading in a relatively tight range, just ahead of trendline support extended from the low 1205.4. Directly below this line also stands a demand base drawn from 1223.7-1233.3, which held this market higher once already back in April. Both of these barriers could very well bounce price this week, but to say that either is a reversal point is not really something we would agree with due to what we’ve seen weekly price do over the past three weeks (see above).
H4 view: Stepping across to the H4 chart, it is relatively clear to see that market participants are now capped between supply seen at 1261.1-1258.1 and demand fixed from 1237.5-1243.9. With all three timeframes in mind, our team can see that the current H4 demand fuses beautifully with the aforementioned daily trendline. Furthermore, the smaller H4 demand zone seen below at 1231.1-1234.4 also sits within daily demand coming in at 1223.7-1233.3.
Our suggestions: Although we believe this market is headed lower, price can and will likely bounce from both of the above said H4 demand zones due to each joining together with higher-timeframe zones (see above). Therefore, for now, our team will be watching both of these H4 areas for potential trades into this market. However, please bear in mind that WE ARE NOT placing pending orders at these zones and will only enter from either base upon satisfactory lower timeframe price action. This could be either a lower timeframe supply engulf and return, a trendline break/retest or simply a collection of buying tails around lower timeframe support or better still at the extremes of the higher-timeframe zone itself.
Levels to watch/live orders:
- Buys: 1237.5-1243.9 [Tentative – confirmation required] (Stop loss: dependent on where one confirms this area). 1231.1-1234.4 [Tentative – confirmation required] (Stop loss: dependent on where one confirms this area).
- Sells: Flat (Stop loss: N/A).


