
A note on lower timeframe confirming price action…
Waiting for lower timeframe confirmation is our main tool to confirm strength within higher timeframe zones, and has really been the key to our trading success. It takes a little time to understand the subtle nuances, however, as each trade is never the same, but once you master the rhythm so to speak, you will be saved from countless unnecessary losing trades. The following is a list of what we look for:
- A break/retest of supply or demand dependent on which way you’re trading.
- A trendline break/retest.
- Buying/selling tails/wicks – essentially we look for a cluster of very obvious spikes off of lower timeframe support and resistance levels within the higher timeframe zone.
- Candlestick patterns. We tend to stick with pin bars and engulfing bars as these have proven to be the most effective.
We search for lower timeframe confirmation between the M15 and H1 timeframes, since most of our higher-timeframe areas begin with the H4. Stops are usually placed 3-5 pips beyond confirming structures.
EUR/USD:
Weekly gain/loss: + 59 pips
Weekly closing price: 1.0698
Since crossing swords with the weekly support area coming in at 1.0333-1.0502, the single currency has closed in the green for five consecutive weeks. From our perspective, the weekly candles look poised to continue higher this week, with the crosshairs likely fixed on the long-term weekly trendline resistance extended from the low 0.8231, followed closely by weekly resistance seen at 1.0819.
Daily resistance at 1.0710, as you can see, capped upside during Wednesday’s segment last week. The downside move from this barrier, nonetheless, was a relatively short-lived one. The major popped to lows of 1.0589, before pulling back and ending the week retesting the level for a second time, indicating somewhat of a bullish stance. If 1.0710 is taken out this week, the daily resistance level coming in at 1.0850 would likely be the next limit to reach.
A quick recap of Friday’s trade on the H4 chart shows that Trump’s inauguration and speech failed to set the markets on fire. The pair bottomed going into London lunch around the 1.0625 mark, and rallied as the US began opening their doors for business, concluding the day just two pips ahead of the 1.07 psychological handle.
Our suggestions: While we cannot rule out the possibility of another bearish response seen from 1.07 today/this week (owing to its connection with daily resistance mentioned above at 1.0710), our team remains biased to the upside.
Ultimately, a daily close above the aforementioned daily resistance would be needed before the team would consider becoming buyers in this market. Should this come to fruition, there’s space seen on all three timeframes (weekly/daily/H4) to advance higher. A retest of 1.07 followed by a reasonably sized H4 bull candle, in our book, would be sufficient enough to buy the major.
The closest resistance, nevertheless, sits around the 1.08 region, and would be the ideal take-profit target for any longs beyond 1.07. What makes it so is the fact that it’s also a high-probability reversal zone for shorts as well. Not only does 1.08 sit nearby a H4 Quasimodo resistance level at 1.0796, it also boasts a deep 88.6% Fib resistance at 1.0809 and is planted nearby the above noted weekly resistance at 1.0819.
Data points to consider: ECB President Draghi speaks today at 11.30pm GMT.

Levels to watch/live orders:
- Buys: Watch for a daily close to be seen above daily resistance at 1.0710 and then look to trade any H4 retest of 1.07 ([a reasonably sized H4 bull candle is required following the retest before a trade can be executed] stop loss: ideally beyond the trigger candle).
- Sells: 1.08 region ([dependent on the time of day, this is an area we would consider trading without confirmation] stop loss: 1.0825 [aggressive stop] 1.0875 [conservative stop]).
GBP/USD:
Weekly gain/loss: + 182 pips
Weekly closing price: 1.2373
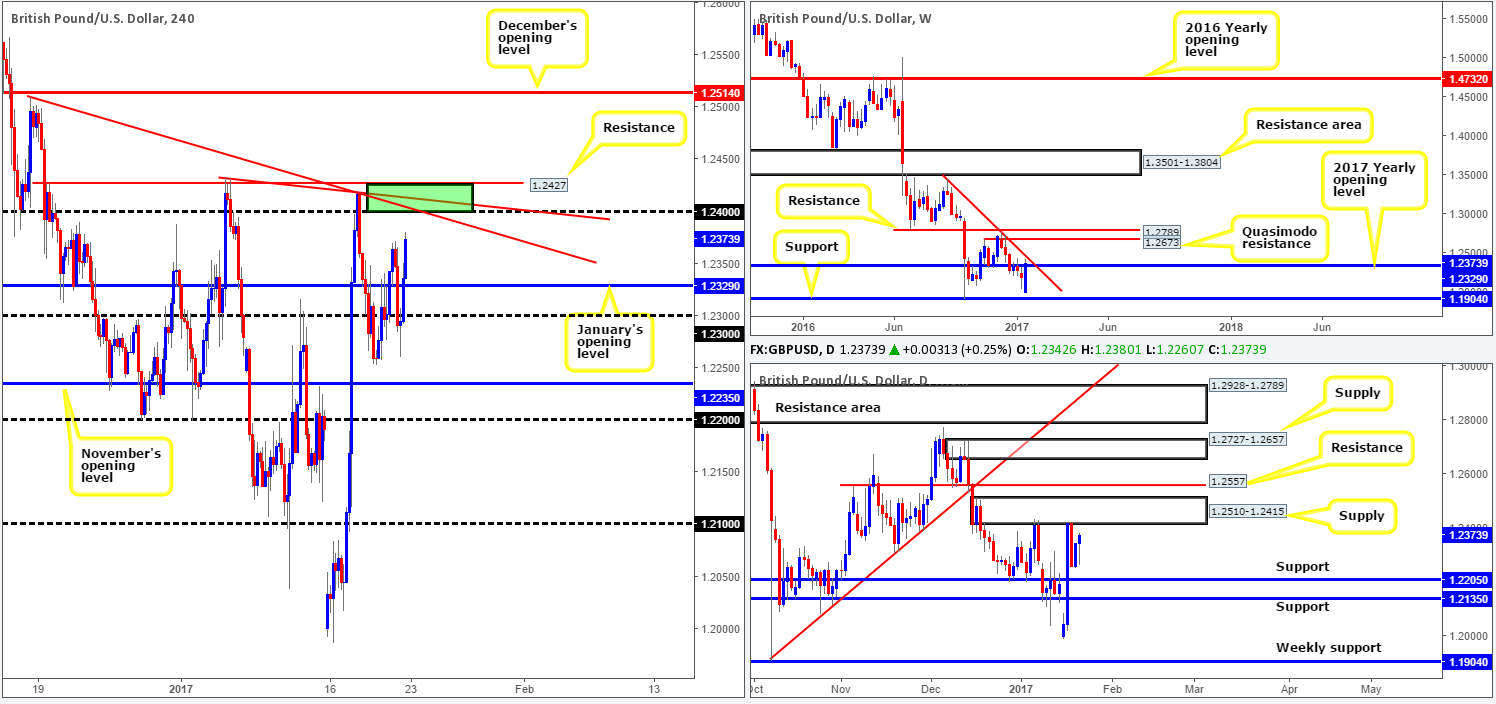
Over the last week, a strong succession of bids flowed into this market. This, as can be seen on the weekly chart, formed a strong-looking weekly bullish engulfing candle and ended the week nudging above the 2017 yearly opening level at 1.2329. Providing that the bulls remain in the driving seat this week, and the pair is able to contend with the weekly trendline resistance pegged from the high 1.3445, we see very little on this timeframe stopping price from reaching the weekly Quasimodo resistance drawn in at 1.2673.
Daily supply at 1.2510-1.2415 capped upside on the 6th Jan, and also on Wednesday last week. The response from the zone so far has been somewhat sluggish, but given that it blends nicely with the aforementioned weekly trendline resistance, further selling from here is a real possibility. The next daily support target on tap falls in at 1.2205.
Over on the H4 candles, we can clearly see that there was little volatility drawn from Trump’s inauguration and speech on Friday. Sterling advanced against its US counterpart as the US session opened, munching through offers at both the psychological handle 1.23 and January’s opening base 1.2329. Still, of particular interest here is the market’s closing point. Price wrapped up the week 25 or so pips ahead of a nice-looking H4 sell zone. A H4 resistance level at 1.2427 coupled with the round number 1.24 and two adjoining H4 trendline resistances (1.2510/1.2432), translates into a reasonably strong barrier, in our opinion.
Our suggestions: In light of the technical confluence seen around the 1.2427/1.24 neighborhood on the H4 chart, and taking into account that it’s bolstered by a daily supply at 1.2510-1.2415, we’ll be looking to sell from here today. Aggressive traders will likely place a pending order at 1.24 with stops a few pips beyond 1.2427, whereas conservative traders may want to consider waiting for lower-timeframe confirmation to form (see the top of this report) before pulling the trigger.
Data points to consider: There are no scheduled high-impacting news events on the docket today relating to these two markets.
Levels to watch/live orders:
- Buys: Flat (stop loss: N/A).
- Sells: 1.2427/1.24 ([dependent on the time of day, this is an area we would consider trading without confirmation] stop loss: 1.2431).
AUD/USD:
Weekly gain/loss: + 58 pips
Weekly closing price: 0.7551
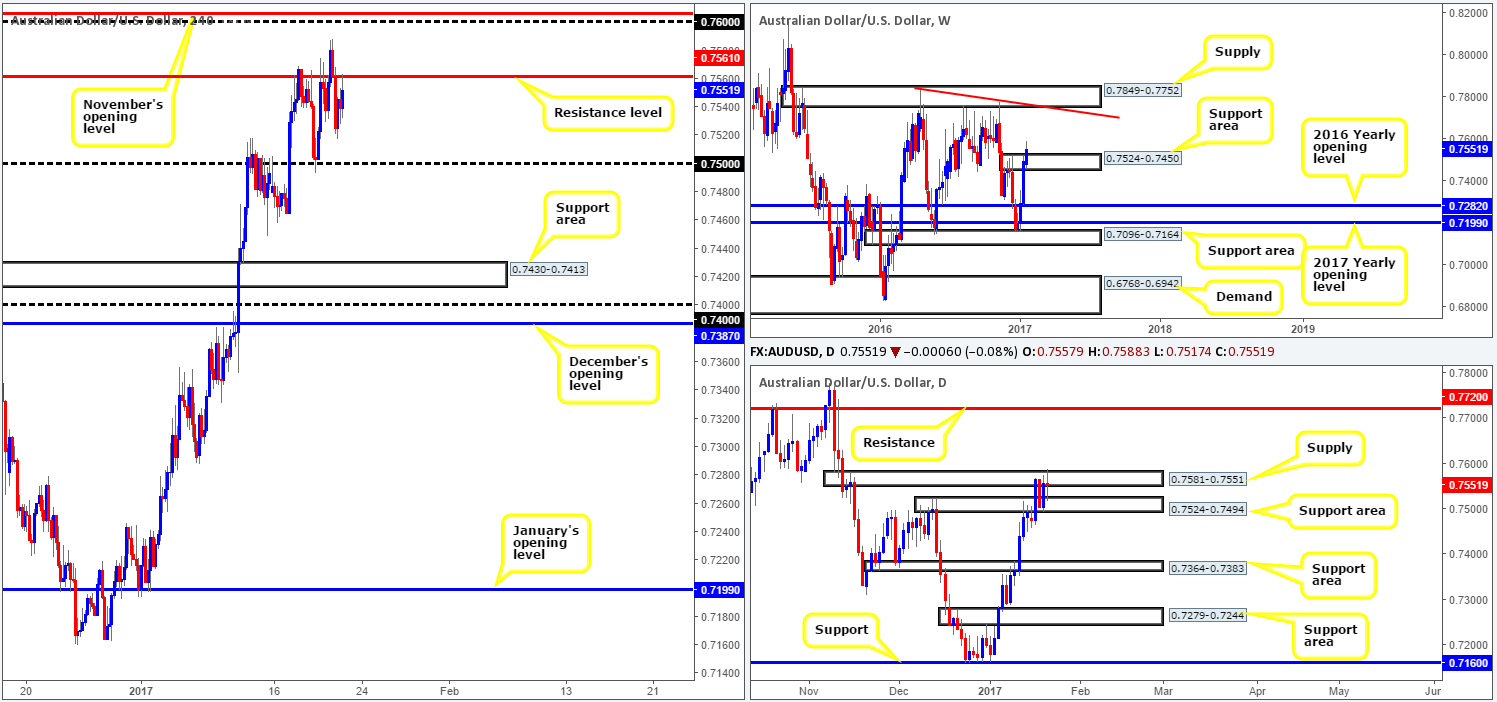
As we can all see from the weekly chart the commodity currency had another relatively respectable week, boasting a fourth consecutive weekly gain! On top of this, price conquered the weekly supply zone sitting at 0.7524-0.7450 (now acting support area), and has potentially opened the trapdoor for the unit to test weekly supply penciled in at 0.7849-0.7752, which happens to merge with a weekly trendline resistance extended from the high 0.7835.
Despite weekly action closing beyond weekly supply, daily movement remains sandwiched between a daily supply zone seen at 0.7581-0.7551 and a daily support area marked at 0.7524-0.7494. In order for our desk to become buyers, a decisive close beyond the daily supply zone will need to take place, thus confirming the weekly close above weekly supply.
The H4 resistance at 0.7561 remained firm on Friday, in spite of the rather brutal H4 two-candle whipsaw seen through this barrier during the early hours of the day. As we hope is demonstrated on the H4 chart, even with a H4 close above this H4 resistance level and the daily supply base mentioned above, H4 buyers still have to compete with nearby resistance at 0.7606 (November’s opening level) and the 0.76 handle.
Our suggestions: In view of the H4 structure, our desk has come to a general consensus that not only is a daily close above the current daily supply needed to become buyers, but also a H4 close above November’s opening level. Until this happens, we have absolutely no interest in chasing longs in this market.
Owing to the recent weekly close above weekly supply, we would strongly advise against selling for the time being. Yes, a sell could still very well work out and the close above weekly supply may turn out to be a deep-seated fakeout. Yet, being the conservative traders that we are, this is a risk we’re not willing to take.
Data points to consider: There are no scheduled high-impacting news events on the docket today relating to these two markets.
Levels to watch/live orders:
- Buys: Flat (stop loss: N/A).
- Sells: Flat (stop loss: N/A).
USD/JPY:
Weekly gain/loss: + 14 pips
Weekly closing price: 114.56
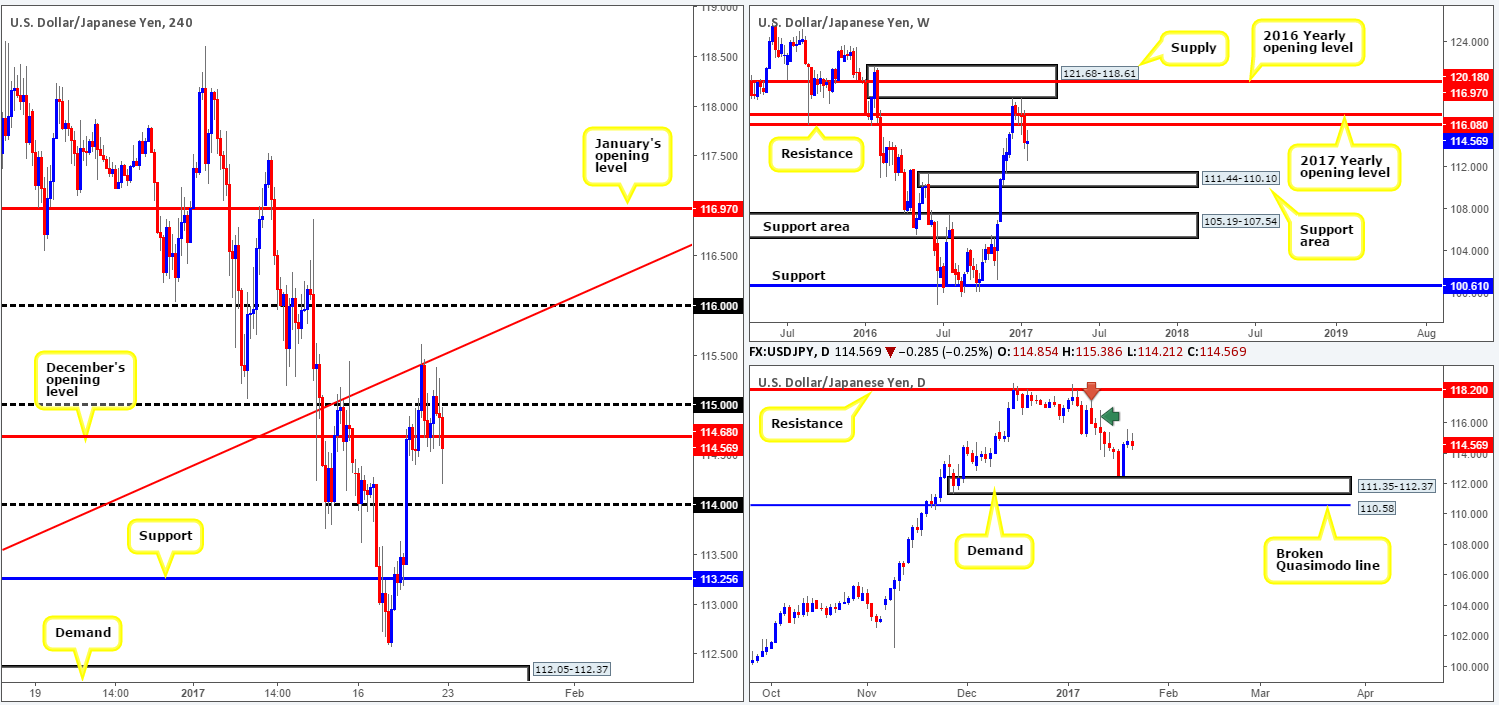
Although the USD/JPY ranged over 300 pips last week, the pair was little changed by the closing bell. This, as is evident from the weekly chart, formed a clear-cut weekly indecision candle. Weekly resistance levels we have our eye on this week are 116.08, followed closely by the 2017 yearly opening level at 116.97. As for weekly supports, the support area chiseled in at 111.44-110.10 appears to be next obvious downside target on this scale.
Turning our attention to the daily chart, there’s very little active supply seen on the horizon until the daily resistance hurdle at 118.20 comes into play. Our reasoning behind this thinking comes from seeing the daily wick marked with a green arrow at 116.87 that drove deep into daily supply marked with a red arrow at 117.53-116.00. This has likely consumed the majority of offers within this zone and thereby likely weakened the area. To the downside, we are watching the daily demand base fixed at 111.35-112.37 that’s shadowed closely by a daily broken Quasimodo line at 110.58.
Analyzing Friday’s sessions on the H4 chart shows that the pair failed to muster enough strength to sustain gains beyond the 115 handle. Trump’s inauguration and speech did little to upset the markets, causing price action to marginally selloff and wipe out December’s opening base at 114.68.
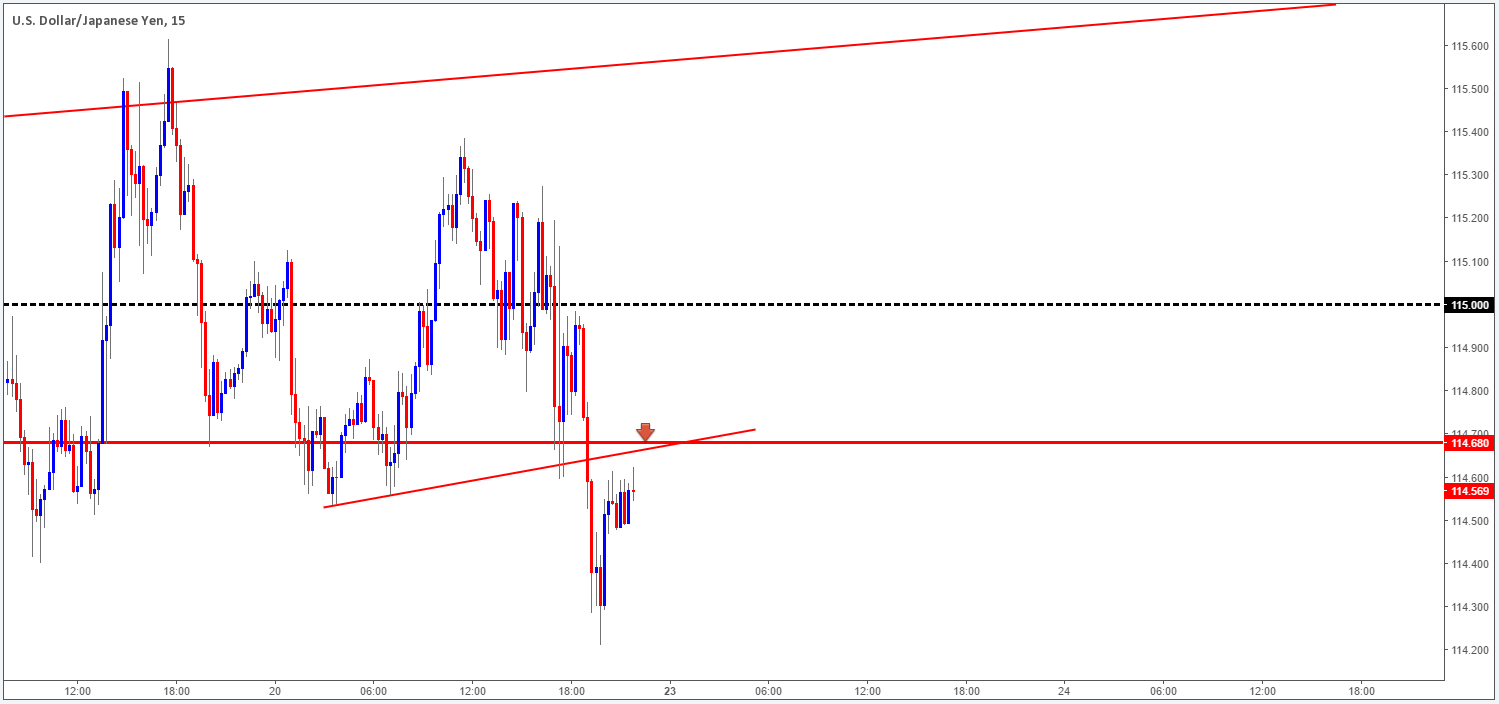
Our suggestions: With the understanding that the H4 candles remain below December’s opening level today, it is likely price will shake hands with the 114 handle. Now, how does one look to take advantage of this possible move? Check out the M15 timeframe (added below), see how there is a minor M15 trendline resistance taken from the low 114.53 that converges beautifully with the monthly level. This, for us at least, is enough confirmation to permit an entry here today. However, we’d strongly advise waiting for the markets to open first so you can assess weekend trading, before making a final decision.
Data points to consider: There are no scheduled high-impacting news events on the docket today relating to these two markets.
Levels to watch/live orders:
- Buys: Flat (stop loss: N/A).
- Sells: Dependent on where the market opens, a short from the underside of the December’s opening level at 114.68 could be something to consider (stop loss: ideally planted 3-5 pips above the M15 trendline resistance discussed above).
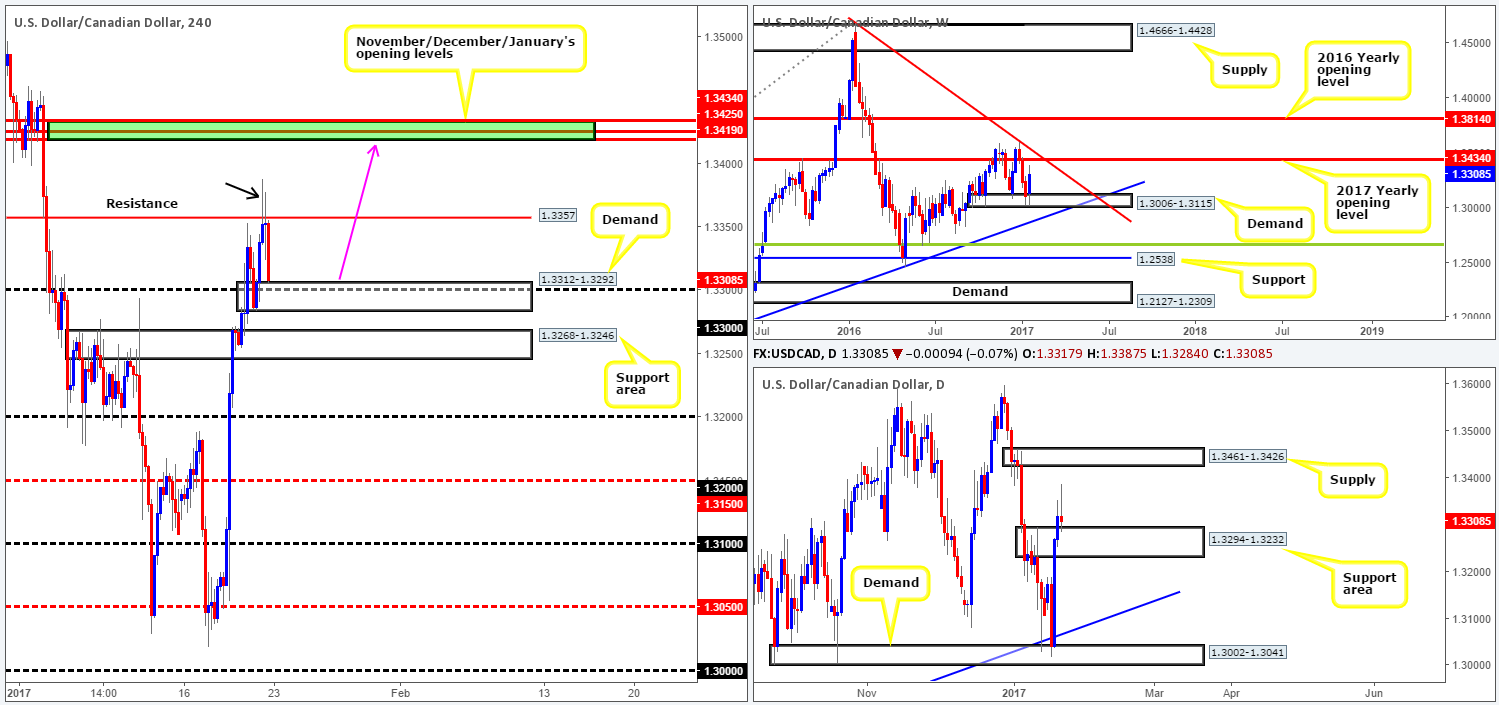
USD/CAD:
Weekly gain/loss: + 201 pips
Weekly closing price: 1.3308
Following three consecutive losing weeks, the USD/CAD corrected sharply higher from weekly demand coming in at 1.3006-1.3115 last week, forming a bullish engulfing candle in the process. As sexy as this sounds, it may be worth noting that just a little over 100 pips (not a great deal when talking weekly structure) ahead of the week’s closing point is the 2017 yearly opening level at 1.3434, which blends reasonably well with a weekly trendline resistance taken from the high 1.4689.
In conjunction with the weekly timeframe, the daily candles closed above a daily supply at 1.3294-1.3232 on Thursday and retested this area as support on Friday. While this could portend further buying in this market, as the weekly timeframe suggests, we’re a little concerned by Friday’s bearish selling wick. A firm rejection off of this daily support zone, nonetheless, could lead to a rally up to daily supply sitting at 1.3461-1.3426 that happens to encapsulate the 2017 yearly opening level mentioned above.
Lower-than-expected Canadian inflation data along with poor retail sales saw the H4 candles spike to highs of 1.3387 on Friday. The US dollar, however, failed to sustain gains beyond this point, helped by the H4 resistance at 1.3357, and went on to drive to lows of 1.3305 and touch gloves with a H4 demand area at 1.3312-1.3292 (houses the round number 1.33) by the week’s end.
Our suggestions: In that weekly action suggests further buying (if only for 100 or so pips), and daily movement recently retested an area of support at 1.3294-1.3232, the current H4 demand zone at 1.3312-1.3292 could very well hold firm today. This – coupled with the possibility that stop-loss orders above the H4 resistance at 1.3357 (see black arrow) have likely been consumed (thus weakening the level), we could see the pair rally up to November/December/January’s opening levels (1.3434/1.3419) from here as per the pink arrow. Still, given Friday’s daily candle, we would only consider the H4 demand zone a valid buy area should we manage to pin down a lower-timeframe buy signal (see the top of this report).
Data points to consider: There are no scheduled high-impacting news events on the docket today relating to these two markets.
Levels to watch/live orders:
- Buys: 1.3312-1.3292 ([lower-timeframe confirmation is required here before a trade can be executed] stop loss: depends on where one confirms the zone).
- Sells: Flat (stop loss: N/A).
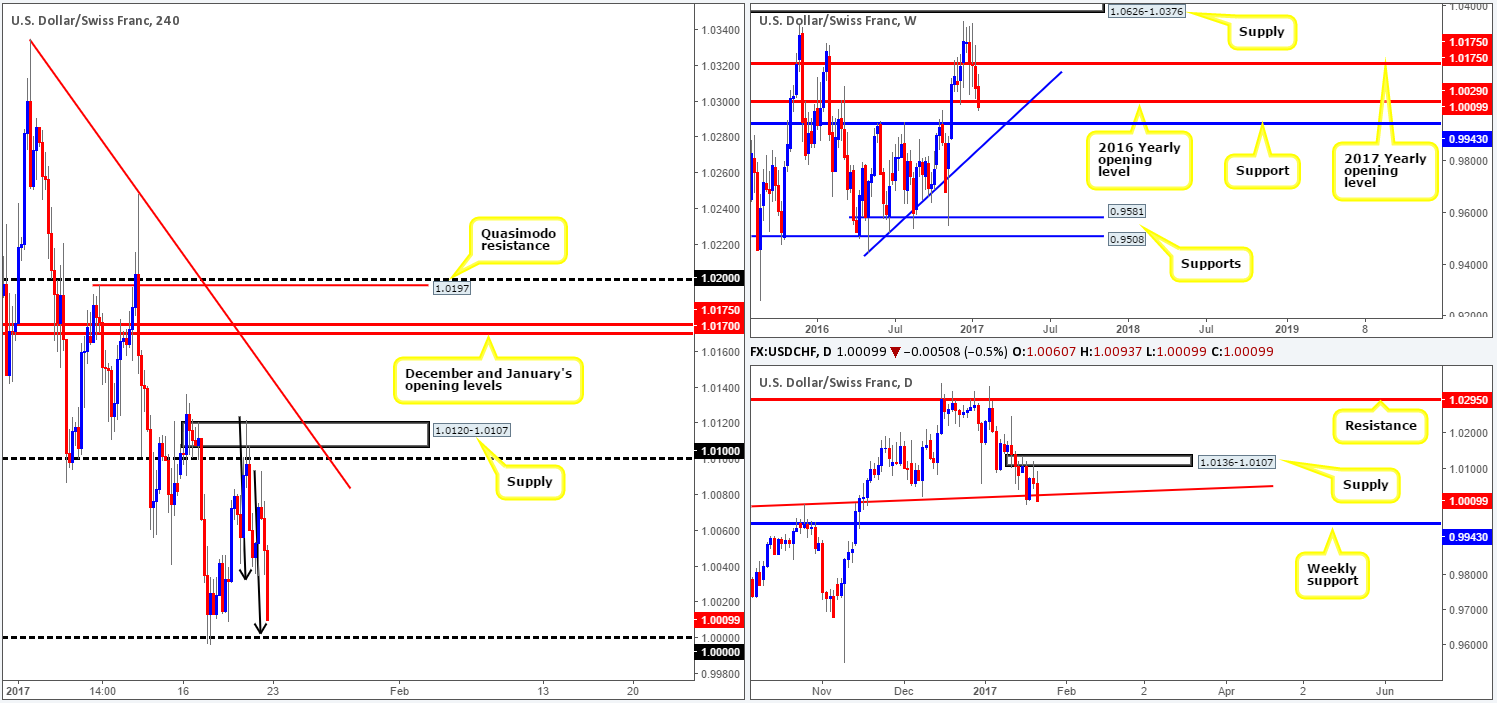
USD/CHF:
Weekly gain/loss: – 73 pips
Weekly closing price: 1.0009
The recently closed weekly candle, as can be seen from the weekly chart, sustained further losses last week with the unit slipping below bids at the 2016 yearly opening level drawn from 1.0029. As a consequence of this, and assuming that the bears can defend this level as resistance, the next downside objective in the firing range is a weekly support carved from 0.9934.
Zooming in and looking at the daily candles, daily sellers printed a nice-looking bearish candle on Friday that closed below a daily trendline support drawn from the high 0.9956. As far as we’re can see, this movement further confirms downside to the weekly support hurdle mentioned above at 0.9943.
With Trump’s inauguration and speech lacking substance, the H4 candles ended the day closing just ahead of parity (1.0000). What is quite notable from a technical perspective is the approach towards this major psychological boundary: a H4 AB=CD bullish pattern – see black arrows. Despite this being a technically sound level with a favorable approach, we’re cautious here. As per our EUR/USD charts above (an inversely correlated market), we’ve noted that the desk remains biased to the upside. On top of this, let’s not forget that both the weekly and daily timeframes on the Swissy point to further selling this week (see above).
Our suggestions: While a bounce will likely be seen from 1.0000, it’s difficult to imagine, owing to the higher-timeframe structure, that the move will be anything to get excited about. With that being the case, we’re looking for a H4 close beyond 1.0000 today, followed up with a retest and a lower-timeframe sell signal (see the top of this report). Should this come into view, a short trade can be taken with the first-take profit target set at 0.9948: a mid-range H4 Quasimodo support (positioned a few pips above weekly support at 0.9943).
Data points to consider: There are no scheduled high-impacting news events on the docket today relating to these two markets.
Levels to watch/live orders:
- Buys: Flat (stop loss: N/A).
- Sells: Watch for a H4 close beyond 1.0000 and then look to trade any retest seen thereafter ([a lower-timeframe sell signal will need to be seen following the retest before a trade can be executed] stop loss: dependent on where one confirms this level – generally we set stops 3-5 pips beyond confirming structures).
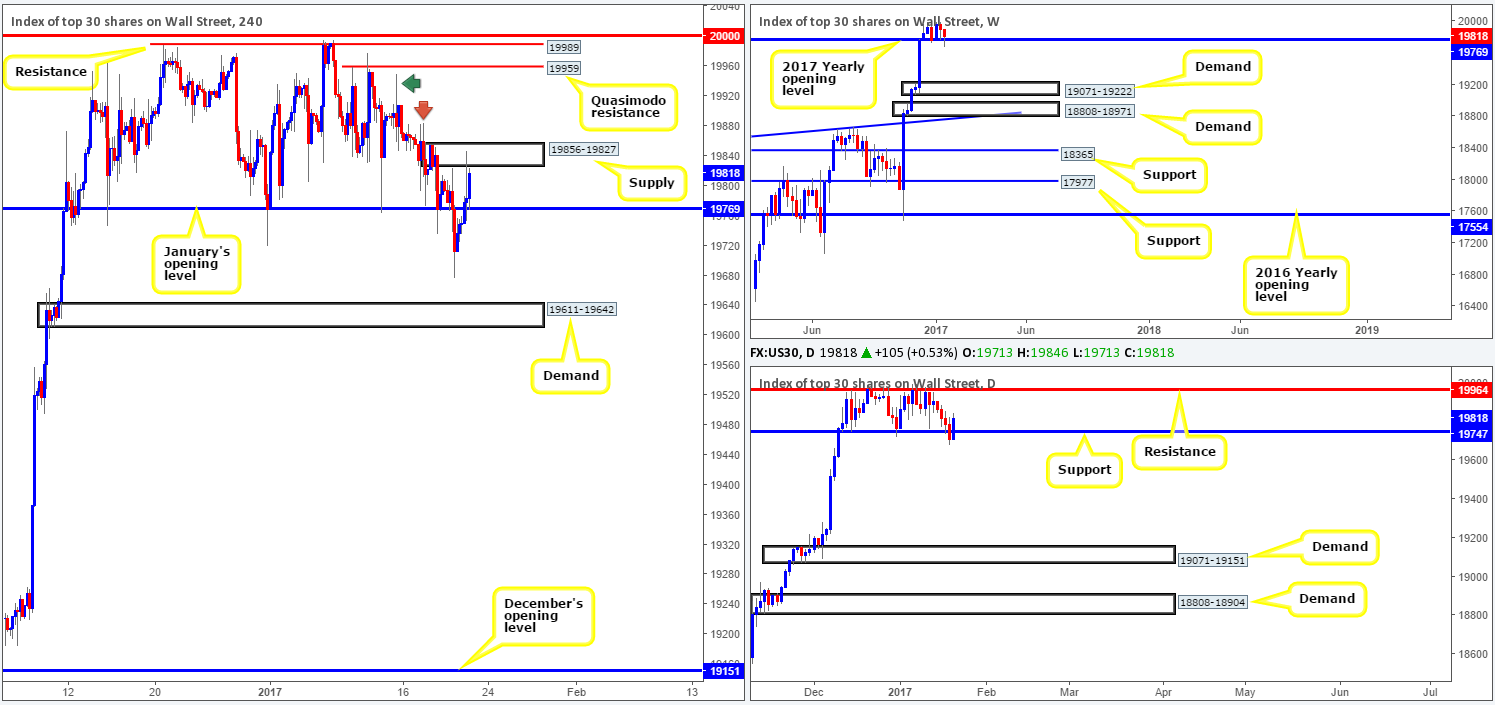
DOW 30:
Weekly gain/loss: – 91 points
Weekly closing price: 19818
Although the DOW managed to clock a fresh low of 19677 during the course of last week’s session, the market remains afloat above the 2017 yearly opening level at 19769. How long this barrier will hold out for is anyone’s guess! However, if a bearish close does form beneath this boundary in the week ahead, this could signal that the market will likely go on to erase the majority of December’s gains, since the next area of interest is seen at a weekly demand base pegged from 19071-19222.
Since mid-December, the daily candles have been consolidating between a daily resistance level at 19964 and a daily support barrier coming in at 19747. Thursday’s candle action shows price broke through and eventually closed beyond the lower edge of this range. While this was the deepest the bears have been this year, the bulls managed to recover relatively quickly on Friday, erasing both Wednesday and Thursday’s losses into the close.
As already noted, Friday’s action was reasonably well-bid. The H4 candles managed to reclaim January’s opening base at 19769 and cross swords with H4 supply at 19856-19827 by the week’s end. In order for our team to regain faith in the bulls here, nonetheless, we’d need to see the H4 supply at 19856-19827 engulfed. The path beyond this area is reasonably clear up to the H4 Quasimodo resistance level visible at 19959 (located only a few points from the daily resistance at 19964), due to the H4 supply consumption wicks seen marked with the red and green arrows at 19950/19884.
Our suggestions: Put simply, watch for a H4 close to form above the current H4 supply zone. In the event that this comes to fruition, and price retests the top edge of the broken area as support followed by a reasonably sized H4 bull candle, we feel one could comfortably take a long position based on this, targeting the above said H4 Quasimodo resistance.
Data points to consider: There are no scheduled high-impacting news events on the docket today that will likely affect the US equity market.
Levels to watch/live orders:
- Buys: Watch for a H4 close beyond the H4 supply at 19856-19827 and then look to trade any retest seen thereafter ([a reasonably sized H4 bull candle will need to be seen following the retest before a trade can be executed] stop loss: ideally beyond the trigger candle).
- Sells: Flat (stop loss: N/A).
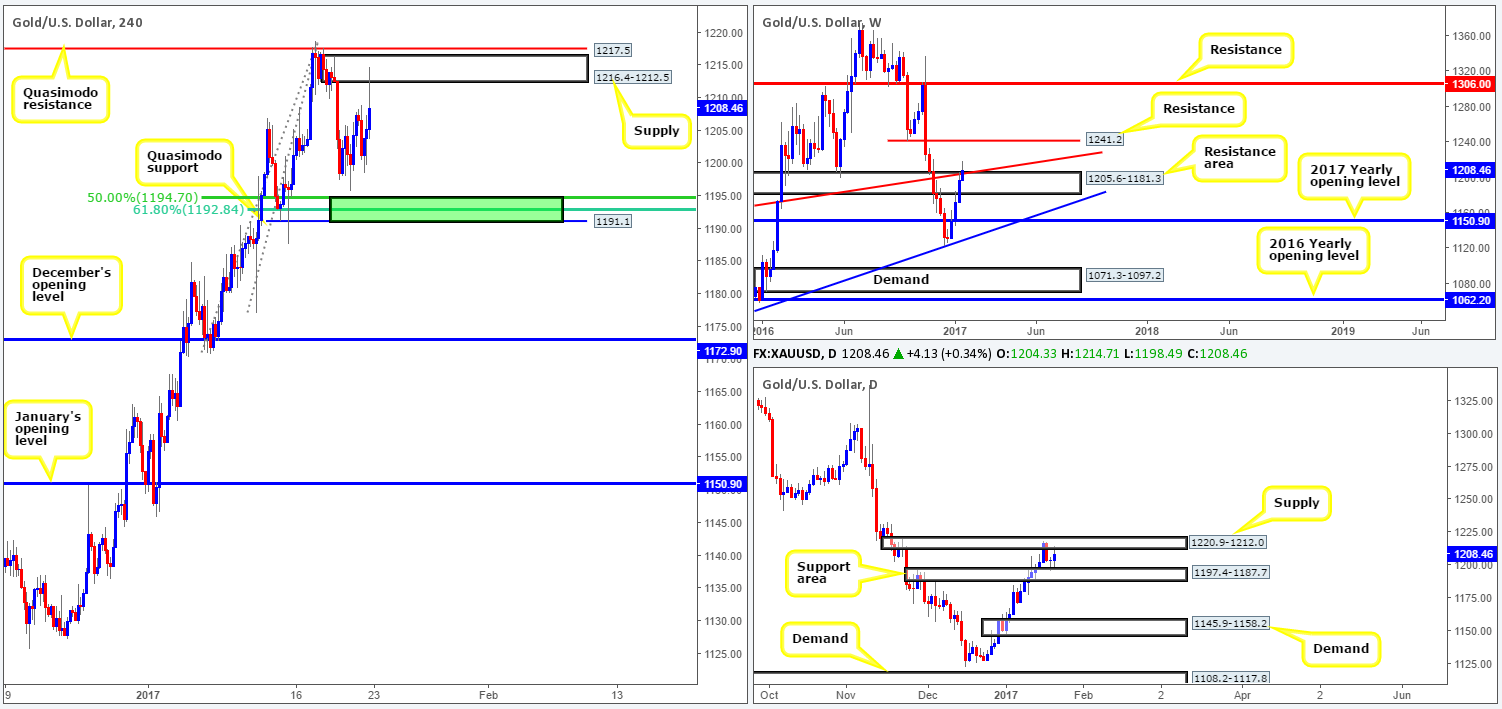
GOLD:
Weekly gain/loss: + $11.6
Weekly closing price: 1208.4
With the US dollar suffering further losses last week, it was no surprise to see the safe-haven metal benefit from this. Buyers printed their fourth consecutive weekly candle, which, as you can see, ended the week marginally closing above the weekly resistance area at 1205.6-1181.3 and its neighboring weekly trendline resistance drawn from the low 1130.1. Our team has also noted that due to the close being relatively minor, we’ll leave 1205.6-1181.3 marked as a resistance area for the time being since it may still be active.
The story on the daily chart, however, is a slightly different one. Price is currently seen ranging between a daily supply zone penciled in at 1220.9-1212.0 and a daily support area formed by 1197.4-1187.7. Therefore, in order for the weekly close above the weekly resistance area to be confirmed, a daily close above the current daily supply would be ideal.
Stepping across to the H4 candles, we can see that very little has changed since Thursday. Additionally, Trump’s inauguration and speech did not manage to excite investors, other than forcing price to attack the H4 supply area coming in at 1216.4-1212.5.
Our suggestions: As of current price, looking to trade from either the H4 supply or the H4 resistance level sitting just above it at 1217.5 is risky owing to the recent weekly closing candle (see above). On a similar note, trading long from the H4 Quasimodo support at 1191.1 is just as risky due to the possibility that the weekly resistance area may still be in play. However, with the long supported by the above noted daily support area 1197.4-1187.7, along with additional support from a cluster of H4 Fib supports at 1192.8/1194.7 (green zone), a bounce may still be possible here with a lower-timeframe confirming buy setup.
Levels to watch/live orders:
- Buys: 1191.1/1194.7 ([lower-timeframe confirmation is required here before a trade can be executed] stop loss: depends on where one confirms the zone).
- Sells: Flat (stop loss: N/A).


