
Key risk events today:
Canada GDP m/m; US Durable Goods Orders m/m; Core Durable Goods Orders m/m.
EUR/USD:
Weekly gain/loss: -0.39%
Weekly close: 1.1075
Weekly perspective:
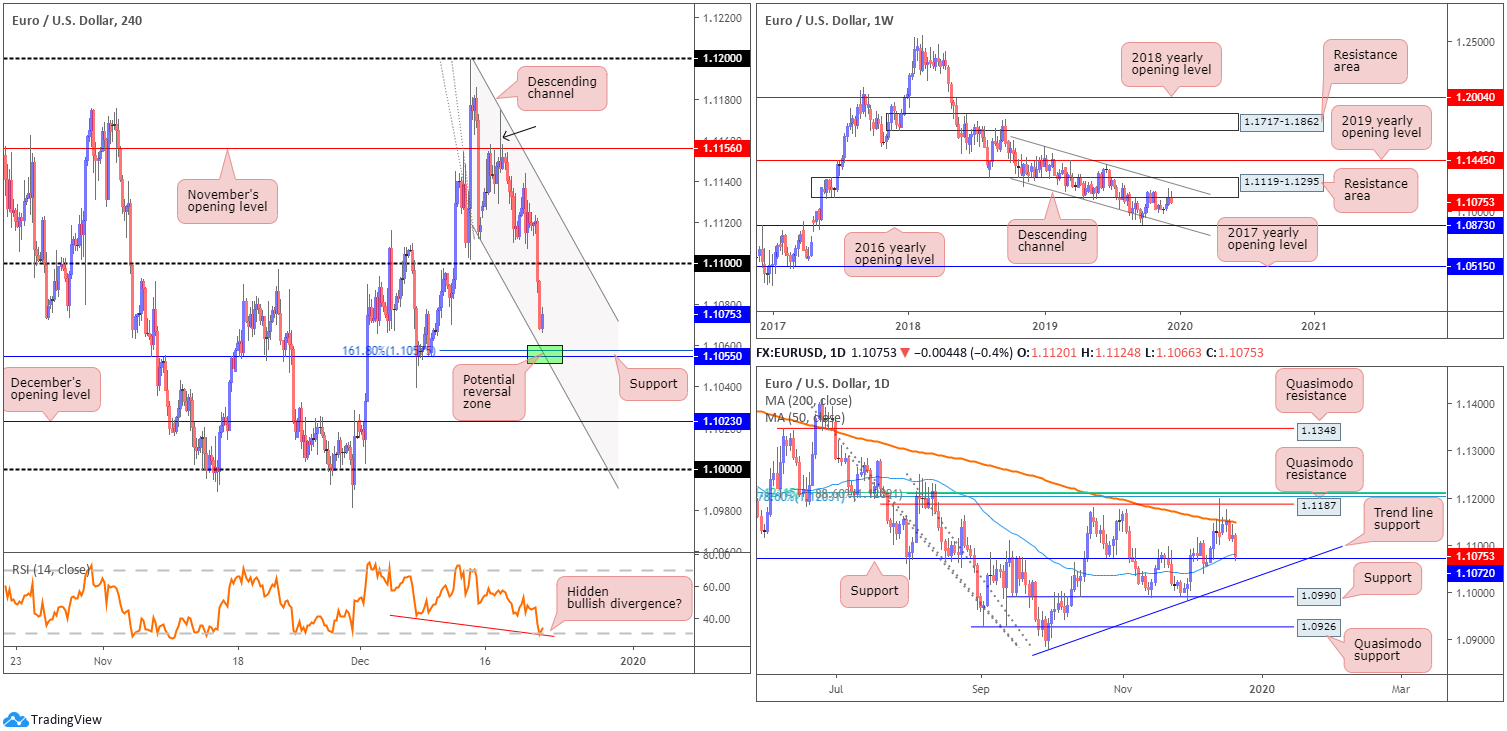
Europe’s single currency, though confined within the prior week’s range (1.1199/1.1053), twisted lower vs. the buck in recent trade, consequently snapping a two-week bullish phase.
Technical research has weekly movement capped south of a long-standing resistance area at 1.1119-1.1295, which intersects closely with channel resistance, extended from the high 1.1569. Visible downside objectives on this timeframe fall in at the 2016 yearly opening level at 1.0873 and channel support, taken from the low 1.1109.
Daily perspective:
A closer reading of price action on the daily timeframe reveals the 200-day SMA (orange – 1.1148) held price lower last week. Interestingly, the week prior witnessed a whipsaw through the said SMA to connect with Quasimodo resistance at 1.1187, positioned a few points south of a Fibonacci cluster around the 1.1206 neighbourhood.
Based on daily analytics, EUR/USD settled recent trade at support drawn from 1.1072, which aligns closely with a 50-day SMA (1.1080). Levels beyond this base are visible at a trend line support, etched from the low 1.0942, support at 1.0990 and Quasimodo support at 1.0926.
H4 perspective:
A combination of reasonably upbeat macroeconomic data out of the US and a daily ABCD bullish pattern completing at 96.62 the week prior saw the dollar index, or DXY, resume its upward trajectory Friday.
EUR/USD H4 action, nonetheless, wrapped up Friday north of support at 1.1055, following a pivotal move through the 1.11 handle. In addition to the current support, technician’s likely have eyes on the 161.8% Fibonacci extension at 1.1057 and channel support, pencilled in from the low 1.1112 (green). Indicator-based traders may also want to note the relative strength index (RSI) is seen pencilling in potential hidden bullish divergence (red line) nearby oversold territory.
Areas of consideration:
Well done to any readers who managed to short November’s opening level at 1.1156 on Tuesday, based on the H4 shooting star pattern (black arrow). In excess of a 100-point gain, sellers likely close out the week with a smile as daily support highlighted above at 1.1072 was set as the take-profit target.
Going forward into potentially holiday-thinned trade, traders may find use in the H4 support discussed above at 1.1055. Knowing we’re trading at daily support, 1.1055, along with its local confluence (green), is likely to bounce price higher this week should a test of the area occur, targeting H4 channel resistance, taken from the high 1.1174. Conservative traders wishing to add a little more confirmation to the mix may choose to wait and see if a bullish candlestick signal emerges before pulling the trigger (entry and risk levels can be determined according to the pattern’s rules of engagement).
GBP/USD:
Weekly gain/loss: -2.50%
Weekly close: 1.2994
Weekly perspective:
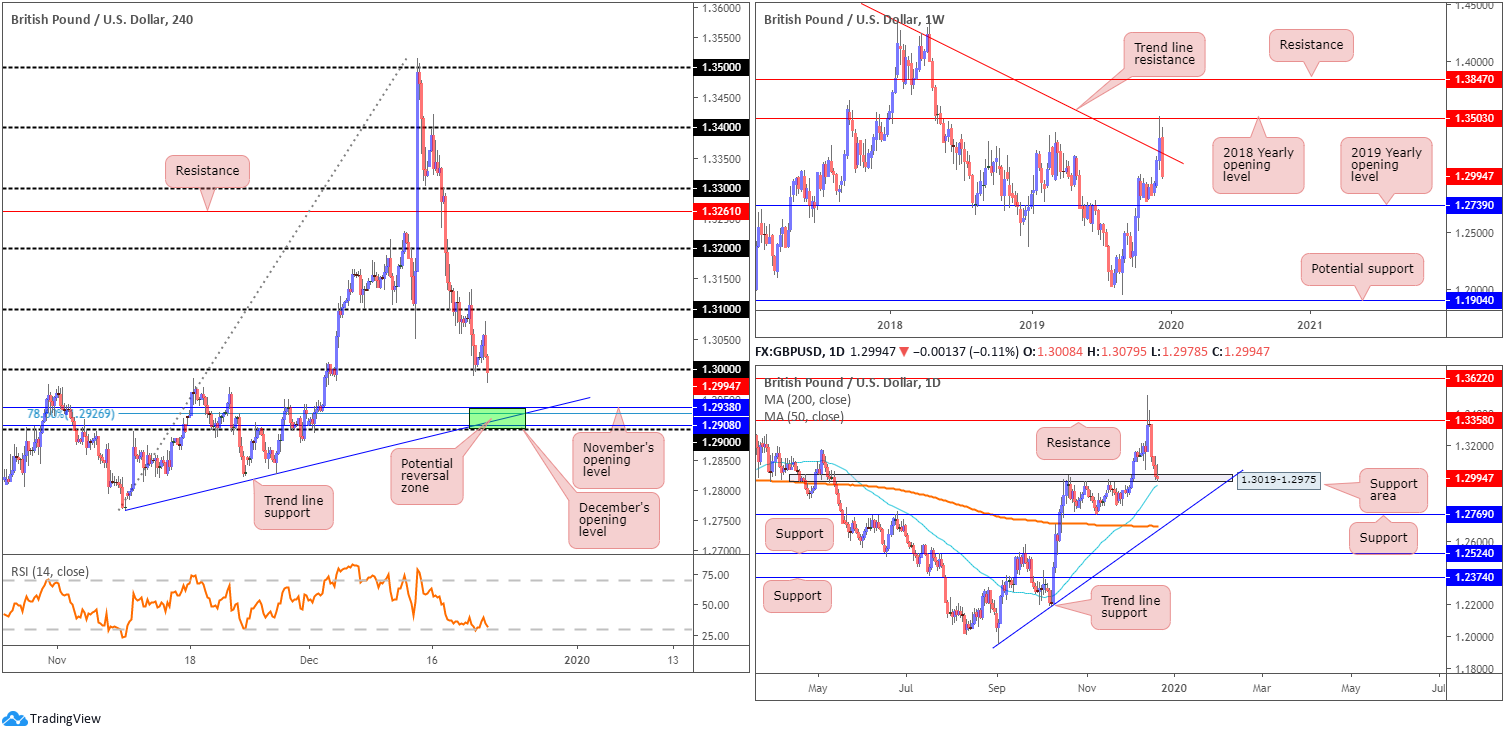
Sterling decisively reclaimed GE-related gains last week as sellers strengthened their grip and snapped a three-week winning streak. After topping at the 2018 yearly opening level drawn from 1.3503 the week prior, price crossed back through long-standing trend line resistance, pencilled in from the high 1.5930. Down more than 300 points, the move highlights a possible approach towards the 2019 yearly opening level at 1.2739.
Daily perspective:
Technical movement on the daily timeframe concluded the week testing a familiar support area at 1.3019-1.2975. Traders may also have their crosshairs fixed on the 50-day SMA (blue – 1.2948). Recently crossing above the 200-day SMA (orange – 1.2693), this dynamic value currently lurks a few points south of the daily zone.
Further selling this week may lead to support at 1.2769 entering the fray, sited close by a trend line support, taken from the low 1.1958 and the 200-day SMA (orange – 1.2693). A rejection off current structure, however, may prompt a revisit at resistance fixed from 1.3358.
H4 perspective:
Amid London hours Friday, GBP/USD extended recovery gains with the aid better than forecast data in the guise of final Q3 GDP that was tweaked higher, albeit modestly. According to the Office for National Statistics, UK gross domestic product (GDP) in volume terms was estimated to have increased by 0.4% in Quarter 3 (July to Sept) 2019, revised upwards by 0.1 percentage points from the first quarterly estimate.
Going into US hours, however, GBP/USD was heavily offered off highs at 1.3079. Aided on the back of reasonably upbeat macroeconomic data out of the US, the dollar index ended the week in strong fashion, testing highs at 97.76.
Consequently, the pound marginally surpassed the key figure 1.30 and took a swipe at sell stops lurking beneath the level. With the majority of buyers’ stop-loss orders filled, and breakout sellers’ orders now active, a run to November’s opening level at 1.2938 may be seen this week.
What’s notable from a technical perspective is the surrounding confluence 1.2938 brings with it (1.29/1.2938). Comprised of December’s opening level at 1.2908, a Fibonacci retracement ratio at 1.2926, a trend line support, taken from the low 1.2768, and a round number at 1.29, this area likely contains enough ‘oomph’ to hold price higher this week. Also of interest, the 50-day SMA applied to the daily timeframe is seen lurking just north of the said H4 zone.
Areas of consideration:
A decisive push through 1.30 this week opens the door to potential bearish scenarios, targeting 1.29/1.2938. Conservative traders will likely opt to wait and see if a retest at the underside of 1.30 materialises before committing funds. Although this can get traders in at unfavourable levels, it helps avoid whipsaws, which are common.
A bounce from 1.29/1.2938 is also a likely scenario this week, with buyers possibly targeting 1.30 as the initial take-profit zone. With the area covering no more than 40 points, and the first take-profit target set 60 points away, risk/reward is considered favourable.
Volatility, however, may diminish as we enter holiday trade. Do bear this in mind before committing to a position.
AUD/USD:
Weekly gain/loss: +0.35%
Weekly close: 0.6897
Weekly perspective:
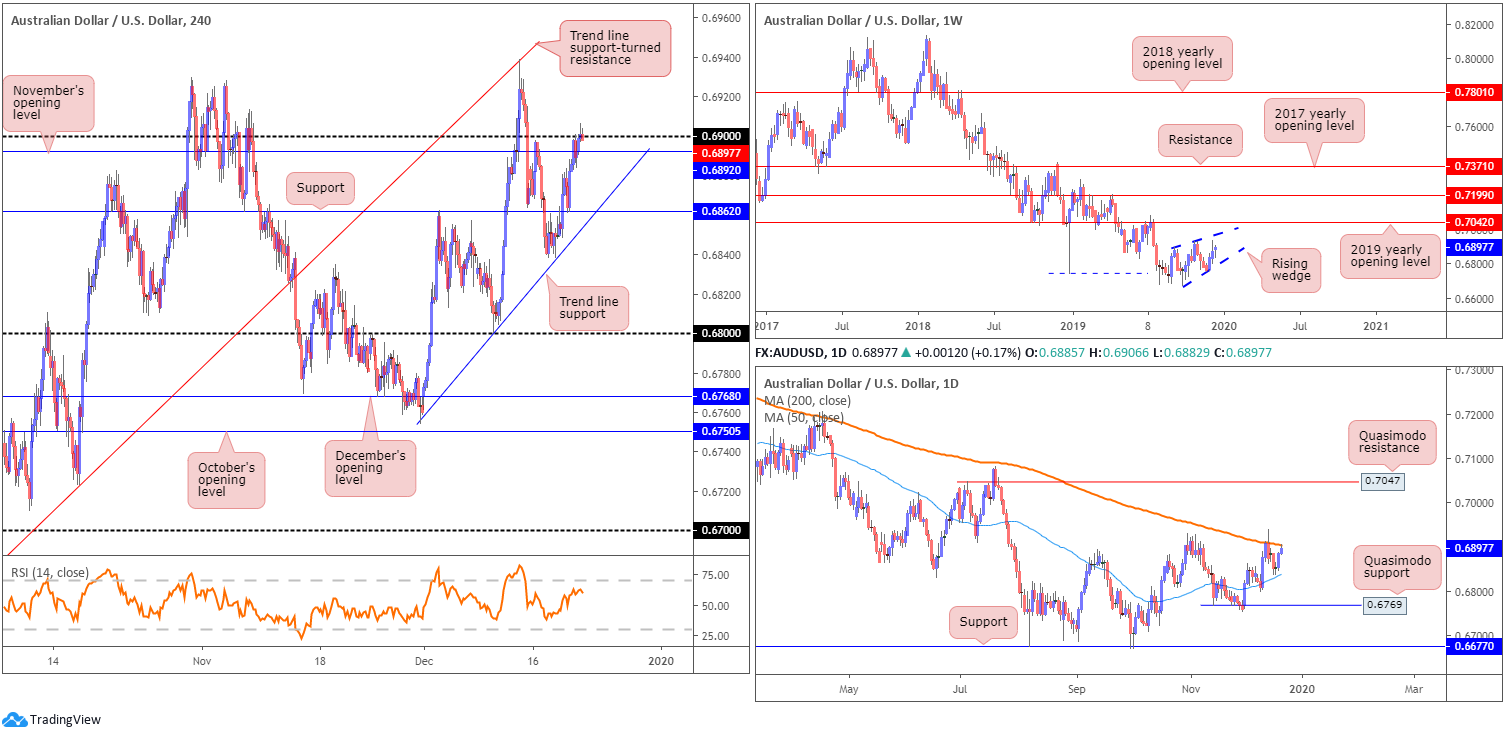
Since registering a bottom in late September at 0.6670, the weekly candles have been busy carving out what appears to be a rising wedge formation, typically considered a continuation pattern. As the 2019 yearly opening level at 0.7042 is seen fast approaching, the aforementioned rising wedge could potentially continue compressing until connecting with this angle.
The primary downtrend, visible from this timeframe, has also been in play since early 2018, consequently adding weight to a breakout south possibly emerging.
Daily perspective:
The story on the daily timeframe reveals the unit remains capped between the 200/50 SMAs (orange – 0.6904/blue – 0.6837). Given the pair has traded south of the said 200-day SMA since April 2019, a reaction from here may be on the menu this week.
Areas of interest outside of this range are seen at Quasimodo support 0.6769 and Quasimodo resistance at 0.7047.
H4 perspective:
Upside momentum persisted Friday in wake of Australia’s upbeat jobs report on Thursday, keeping AUD/USD afloat near 0.69 into the close. What’s interesting here, from a technical perspective, is the 200-day SMA (orange – 0.6904) coincides with 0.69. Regarding support, we have trend line support, extended from the low 0.6754 in view, closely shadowed by support at 0.6862.
Areas of consideration:
0.69 remains obvious resistance. The fact it merges closely with the 200-day SMA certainly adds weight to a reaction being observed. However, psychological levels are prone to whipsaws, as was seen Friday. This tends to be interpreted as a ‘stop run’. With the lack of H4 bearish candlestick signals seen off 0.69, traders are urged to consider waiting for a H4 close to form south of November’s opening level at 0.6892 before considering selling short. As for immediate downside targets, see above in bold.
Volatility, however, may diminish as we enter holiday trade. Do bear this in mind before committing to a position.
USD/JPY:
Weekly gain/loss: +0.11%
Weekly close: 109.43
Weekly perspective:
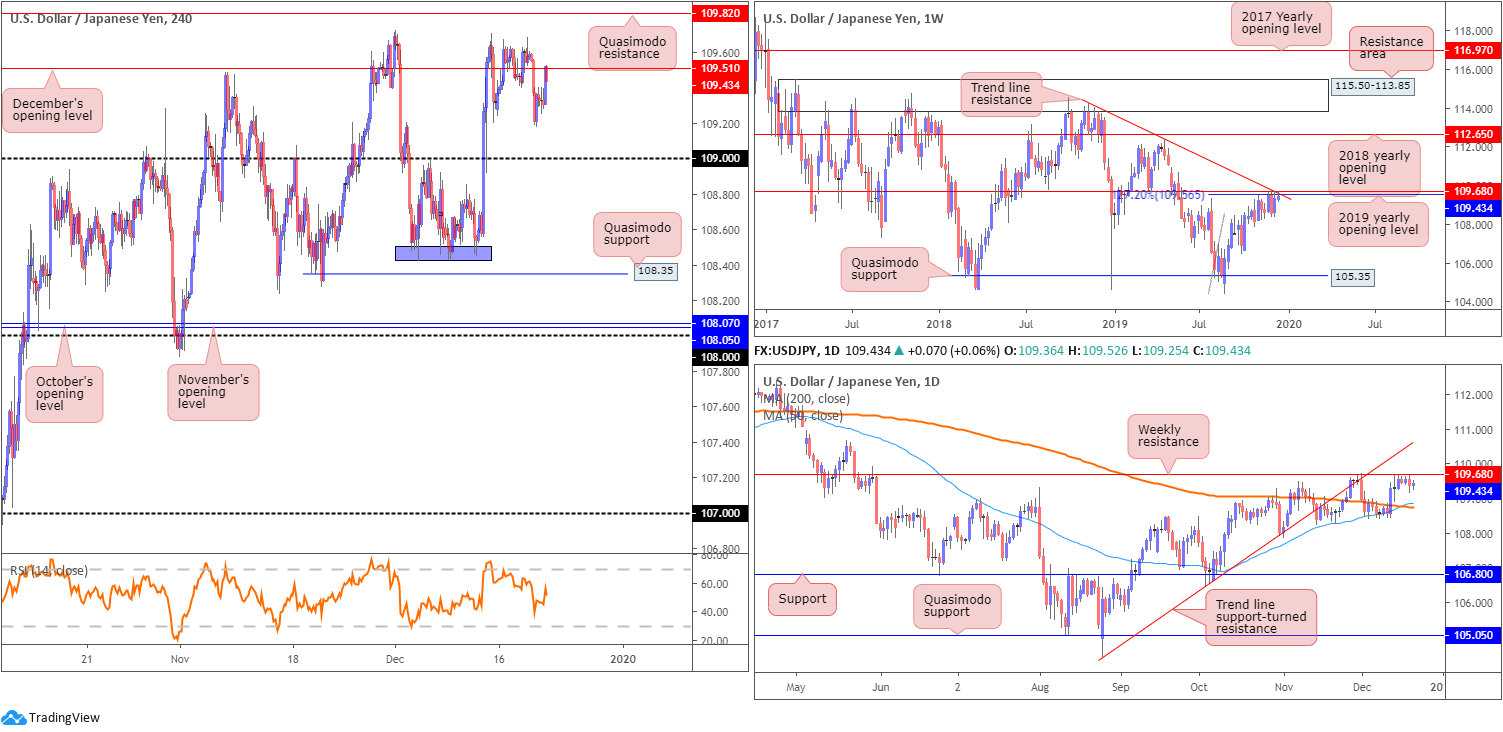
USD/JPY remains languishing south of notable resistances on the weekly timeframe, comprised of a 127.2% Fibonacci extension at 109.56 (taken from the low 104.44), the 2019 yearly opening level at 109.68 and trend line resistance, extended from the high 114.23. Aside from the 106.48 September 30 swing low, limited support is evident until shaking hands with Quasimodo support at 105.35. A break north, however, highlights the 2018 yearly opening level at 112.65 as the next possible layer of resistance.
In regards to the market’s primary trend, the pair has been entrenched within a long-term range since March 2017, spanning 115.50/105.35.
Daily perspective:
Daily action is also seen crossing swords with the said weekly resistances. The difference on this scale, nonetheless, is the downside targets. The 200/50-day SMAs (orange – 108.74/blue – 108.74) rest as potential support. Interestingly, the 50-day SMA crossed above the 200-day SMA in recent movement, generally viewed as a bullish indicator (a Golden Cross).
H4 perspective:
Friday observed modest upside, largely on the back of broad-based dollar bidding through relatively upbeat US macroeconomic data.
As evident from the H4 timeframe, USD/JPY finished Friday retesting the underside of December’s opening level at 109.51, approached in the shape of an intraday ABCD correction. While a selloff from the monthly opening value is certainly a possibility this week, Quasimodo resistance at 109.82 remains unchallenged.
Areas of consideration:
An obvious deduction from current structure would be to look for selling opportunities at December’s opening level drawn from 109.51, targeting the 109 handle. However, there’s little stopping price spiking through recent tops around 109.65 and testing H4 Quasimodo resistance mentioned above at 109.82. Conservative traders may opt to enter only if a H4 bearish candlestick formation develops. Not only will this help determine whether 109.82 or 109.51 are fit to trade, it provides entry and risk levels to work with.
Beyond 109, traders’ crosshairs are likely fixed on Quasimodo support at 108.35. Note not only is this considered another take-profit target from 109.82 or 109.51, it is also a location buyers will likely look to enter long from, given the sell stops that will be taken from the lows (purple) around 108.45.
Volatility, however, may diminish as we enter holiday trade. Do bear this in mind before committing to a position.
USD/CAD:
Weekly gain/loss: -0.18%
Weekly close: 1.3142
Weekly perspective:
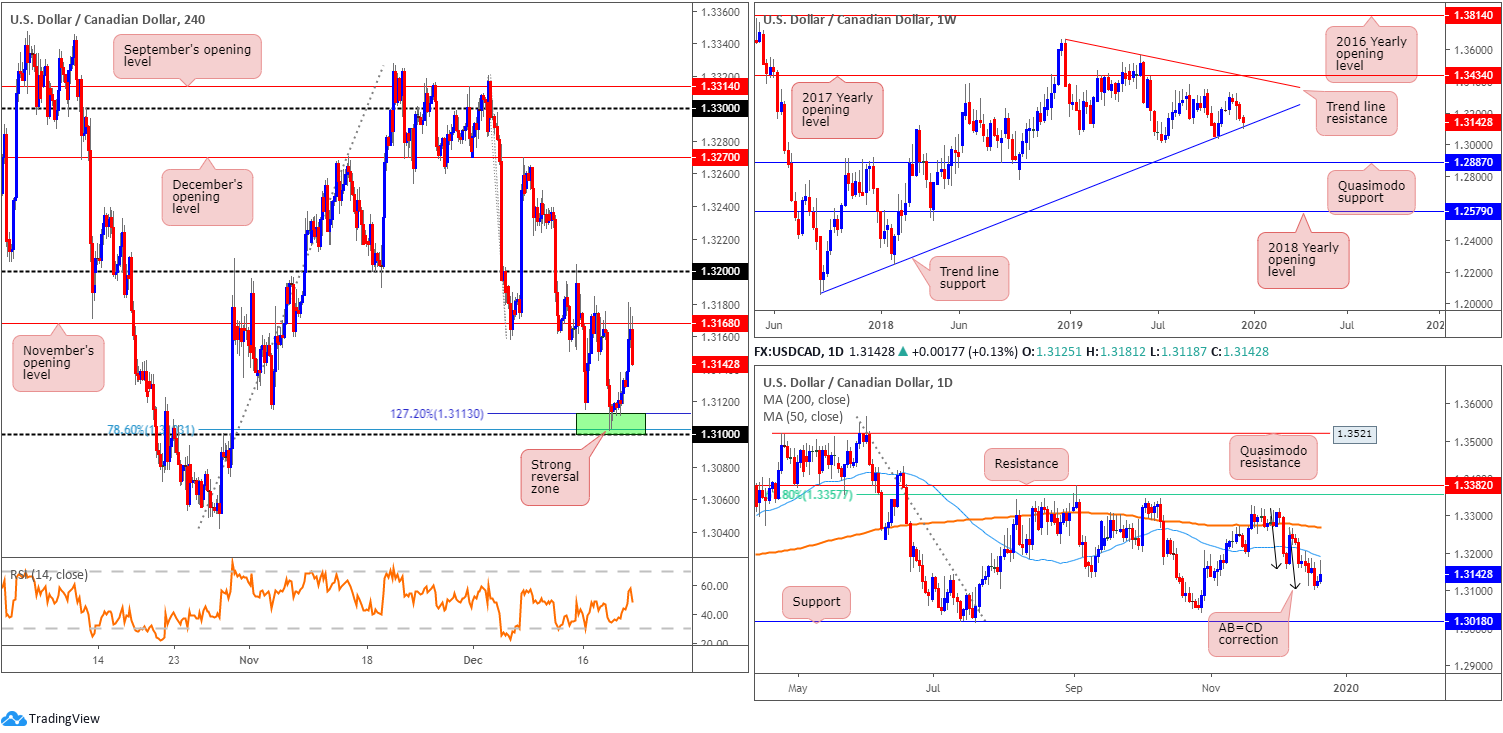
USD/CAD recorded its fourth successive losing week, declining more than 20 points on the session. Structurally, nonetheless, trend line support, extended from the low 1.2061, entered the fray which may prompt a round of short covering. Resistance points on the weekly scale are fixed around tops at 1.3320ish, the 2017 yearly opening level at 1.3434 and trend line resistance, taken from the peak at 1.3661.
A violation of the current ascending base could lead to Quasimodo support at 1.2887 eventually being brought into view. Overall, though, the immediate trend has faced north since bottoming in September 2017; however, this move could also be considered a deep pullback in a larger downtrend from the 1.4689 peak in early January 2016.
Daily perspective:
Interestingly, on the daily timeframe, price spent more than three weeks moulding an AB=CD correction (black arrows), which terminated at 1.3105 on Wednesday. Despite boasting limited support on this timeframe, the harmonic pattern held price higher into the close.
Upside objectives from this point are seen around the 50-day SMA (blue – 1.3192), followed by the 200-day SMA (orange – 1.3268). A move lower, on the other hand, has the 1.3042 October 29 low to target, shadowed closely by support at 1.3018.
H4 perspective:
Those who read Thursday’s report may recall the piece highlighting 1.31/1.3113 as a reasonably firm area of interest for possible long entries (green – comprised of the round number 1.31, a 78.6% Fibonacci ratio at 1.3103 and a 127.2% Fibonacci extension at 1.3113). The additional component here, also highlighted in previous analysis, is weekly price testing the current long-term trend line support.
Well done to any readers who managed to enter long from 1.31/1.3113; risk/reward offered favourable conditions to the first take-profit target at November’s opening level drawn from 1.3168, which was hit Friday. USD/CAD built on its steady ascent, surging above 1.3168 on dismal Canadian data. According to Statistics Canada, retail sales decreased 1.2% to $50.9 billion in October. The decline was primarily attributable to lower sales at motor vehicle and parts dealers and at building material and garden equipment and supplies dealers. Core retail sales (excluding automobiles) also fell short of market consensus, announcing a decline of 0.5% vs. 0.2%. In addition to this, weaker oil prices further bolstered upside movement.
Areas of consideration:
Traders long from 1.31/1.3113 likely took partial profit at 1.3168 Friday and reduced risk to breakeven. The next take-profit target rests at the 1.32 handle, seen a touch above the 50-day SMA value.
USD/CHF:
Weekly gain/loss: -0.10%
Weekly close: 0.9825
Weekly perspective:
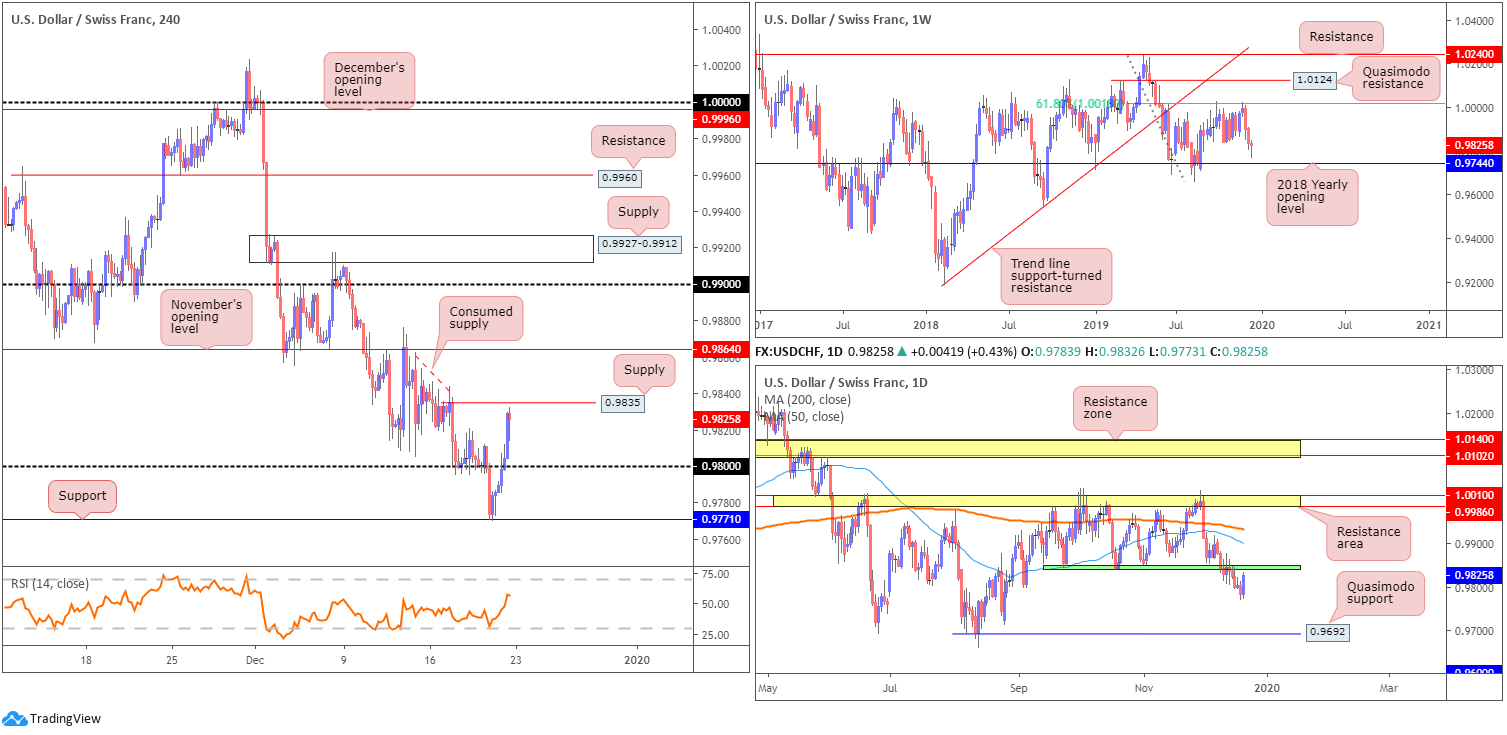
As of mid-June, upside attempts have been capped by a 61.8% Fibonacci retracement ratio at 1.0018. Of late, two decisive bearish candles formed from this Fib base, though momentum diminished last week off lows of 0.9770.
Equally impressive is the 2018 yearly opening level at 0.9744. Capping downside since the beginning of the year, this level remains the next support target on the weekly scale, despite last week’s pullback.
According to the primary trend, sellers appear to be gaining the upper hand.
Daily perspective:
The lower edge of a 3-month consolidation at 0.9845ish (green) gave way in recent trading, exposing Quasimodo support at 0.9692 as the next obvious downside target.
However, Friday’s stronger-than-expected recovery engulfed a number of bearish candles, closing within striking distance of 0.9845, which should, technically speaking, provide resistance this week.
H4 perspective:
As underlined in the EUR/USD analysis, a combination of reasonably upbeat macroeconomic data out of the US and a daily ABCD bullish pattern completing at 96.62 the week prior saw the dollar index, or DXY, resume its upward trajectory Friday. This lifted USD/CHF to higher ground off support at 0.9771 and overpowered sellers around the 0.98 handle.
Possible supply is close by at 0.9835, while beyond this barrier, active supply appears consumed until reaching November’s opening level at 0.9864.
Areas of consideration:
Weekly price, despite last week’s late recovery, exhibits room to move lower to 0.9744. In conjunction with this, daily flow is likely to hold at 0.9845ish and push south. For that reason, H4 supply at 0.9835 may be of interest to some traders this week for short sales. If we break beyond here, focus shifts to November’s opening level at 0.9864 for potential shorts, with the option of positioning protective stop-loss orders above 0.9876. The latter level is the more favourable base, according to chart studies.
Volatility, however, may diminish as we enter holiday trade. Do bear this in mind before committing to a position.
Dow Jones Industrial Average:
Weekly gain/loss: +1.19%
Weekly close: 28496
Weekly perspective:
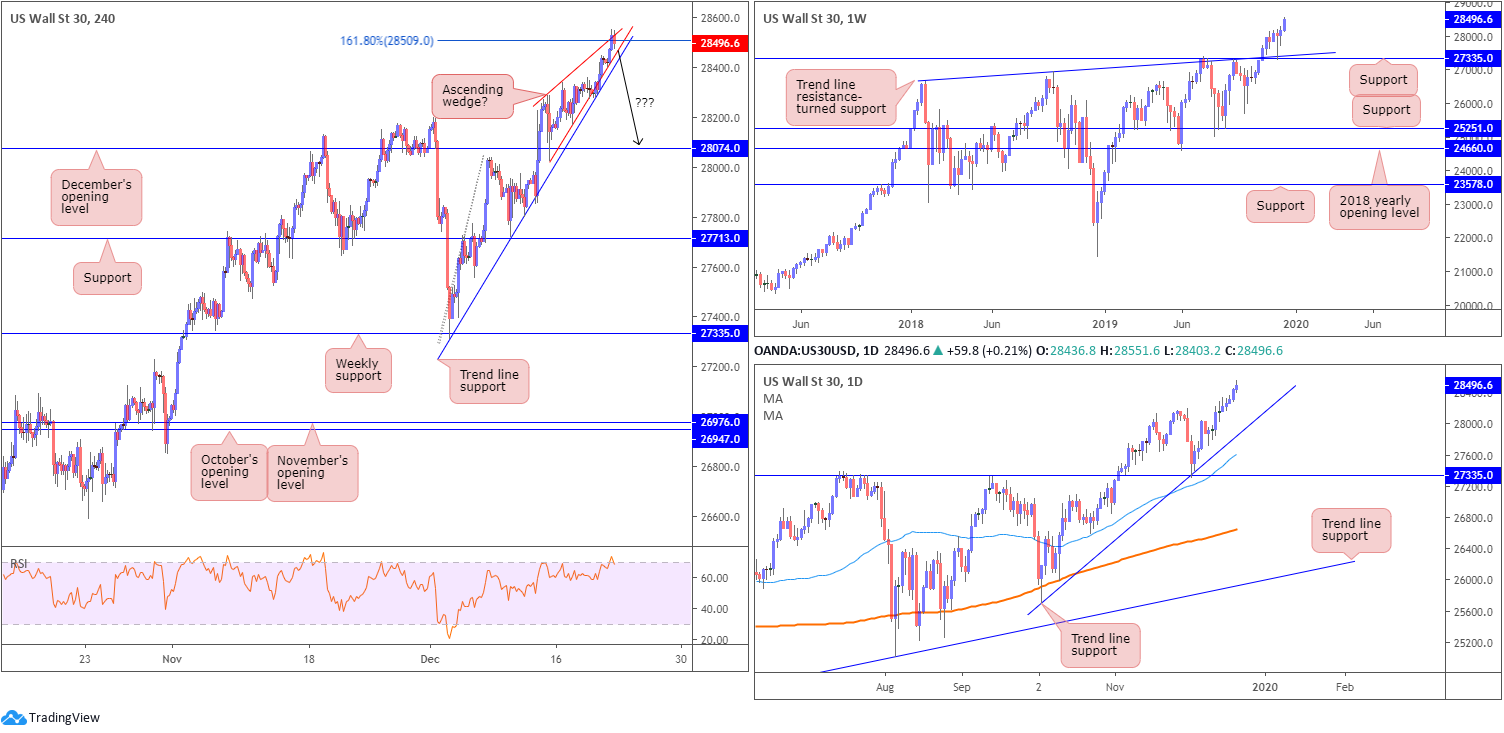
Buyers continued to flex their financial muscle last week, adding more than 330 points.
Following a strong weekly hammer candlestick pattern (considered a buy signal at troughs), formed three weeks back at the retest of support drawn from 27335, along with trend line support etched from the high 26670, the index tested fresh record peaks of 28551.
Daily perspective:
Meanwhile, on the daily timeframe, trend line support, extended from the low 25710, remains intact, bolstered by additional support from the 50-day SMA (blue – 27612).
H4 perspective:
Wall Street’s major indexes resumed their rally Friday, following encouraging US macroeconomic data and optimism regarding international trade deals. The Dow Jones Industrial Average added 78.13 points, or 0.28%; the S&P 500 advanced 15.86 points, or 0.49% and the tech-heavy Nasdaq 100 added 37.20 points, or 0.43%.
H4 trend line support, extended from the low 27314, remains intact following Thursday’s test, with the DJIA scoring fresh record peaks Friday.
Technically, the said trend line support is steep and likely prone to breaking. In addition to this, an ascending wedge (red lines – 28026/28287) and a 161.8% Fibonacci extension at 28509 is in motion, along with the relative strength index (RSI) seen toying with its overbought value, consequently adding weight to a potential downside reversal.
Areas of consideration:
As the index forms its ninth consecutive daily bullish close, the H4 ascending wedge, coupled with the steep H4 trend line support and 161.8% Fibonacci extension at 28509, is likely to prompt a near-term reversal this week.
Understandably, many traders will not feel comfortable selling this market on a break of the said H4 structures, given the its current strength. Nevertheless, in the event a break lower materialises, December’s opening level resides as the next support target at 28074, therefore providing attractive risk/reward metrics.
Volatility, however, may diminish as we enter holiday trade. Do bear this in mind before committing to a position.
XAU/USD (GOLD):
Weekly gain/loss: +0.16%
Weekly close: 1477.9
Weekly perspective:
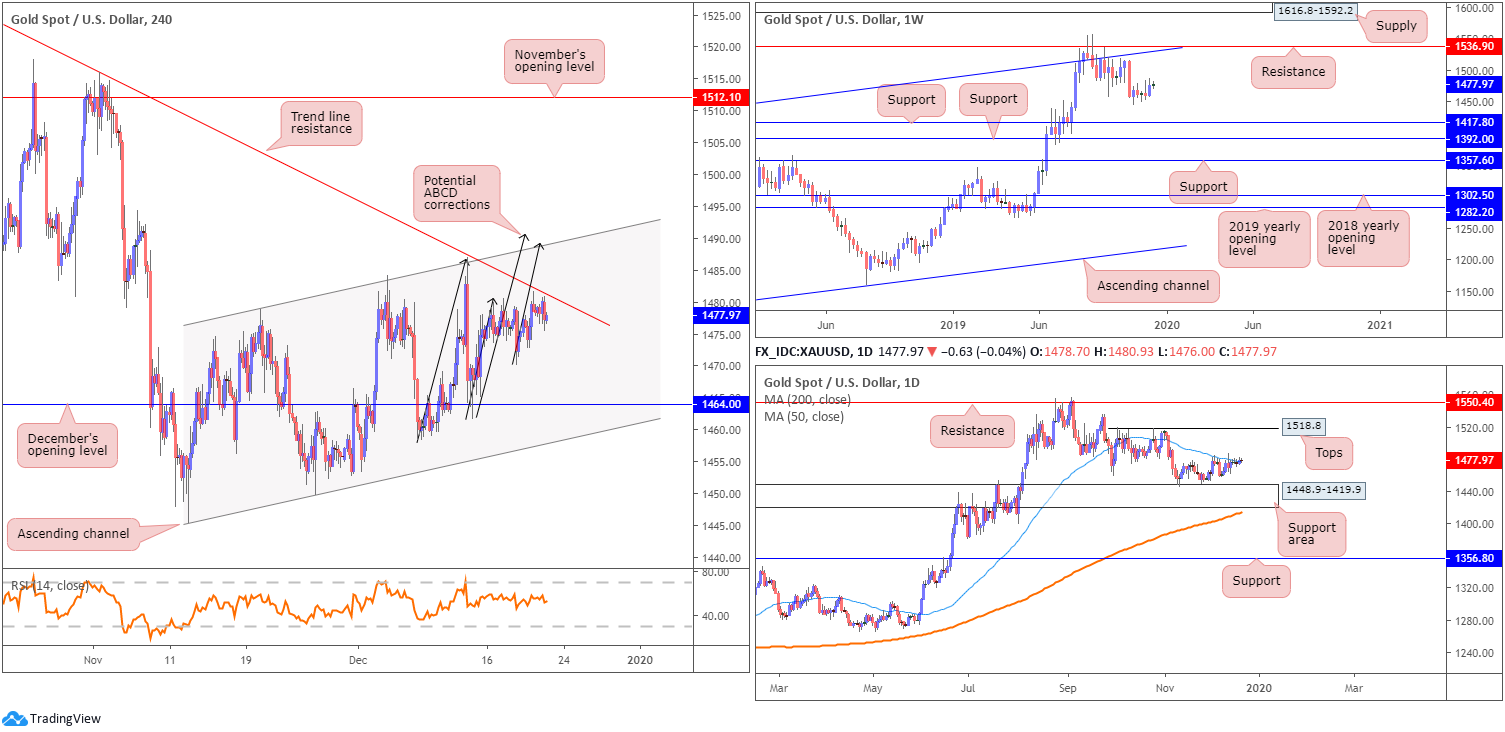
Since connecting with resistance at 1536.9 and channel resistance, extended from the high 1375.1, XAU/USD has been in a mild decline. Further downside from here potentially sets the stage for a move towards two layers of support at 1392.0 and 1417.8. Overall, though, the primary trend has faced a northerly trajectory since bottoming in early December 2015.
Daily perspective:
The 50-day SMA (blue – 1477.1) offered resistance in this market since early December, hampering upside from the daily support area coming in at 1448.9-1419.9. Late last week, however, a marginal close north of the said SMA took form, perhaps enough to generate further upside to tops around 1518.8, closely followed by resistance at 1550.4.
It might also interest some traders to note the 200-day SMA (orange – 1413.7) remains south of the said support area, though has been drifting north since mid-April.
H4 perspective:
XAU/USD spot prices have pretty much remained stale this week, ranging no more than $11.
Price continues to inch closer to familiar trend line resistance, taken from the high 1557.1, missing the barrier by only a few points in recent movement. This follows a near-to-the-point recovery off December’s opening level at 1464.0. Note, the H4 candles have also been compressing within an ascending channel formation since bottoming at 1445.5 (high at 1478.8).
Areas of consideration:
Although daily price mildly closed above the 50-day SMA in recent trade, short entries at the current H4 trend line resistance remain an option. However, with limited confluence in view, traders are urged to consider confirmed entries, candlestick confirmation, for example. This not only helps identify seller intent, it also provides entry and risk levels to work with making it easier to calculate risk/reward.
A violation of the aforementioned H4 trend line this week, on the other hand, may encourage breakout buying, targeting the current H4 channel resistance which could eventually complete two H4 ABCD bearish correction patterns around 1490.7 (black arrows). The combination of the two harmonic patterns and the channel resistance is likely to attract intraday selling.
Volatility, however, may diminish as we enter holiday trade. Do bear this in mind before committing to a position.
(Italics represents previous analysis)
The accuracy, completeness and timeliness of the information contained on this site cannot be guaranteed. IC Markets does not warranty, guarantee or make any representations, or assume any liability regarding financial results based on the use of the information in the site.
News, views, opinions, recommendations and other information obtained from sources outside of www.icmarkets.com.au, used in this site are believed to be reliable, but we cannot guarantee their accuracy or completeness. All such information is subject to change at any time without notice. IC Markets assumes no responsibility for the content of any linked site.
The fact that such links may exist does not indicate approval or endorsement of any material contained on any linked site. IC Markets is not liable for any harm caused by the transmission, through accessing the services or information on this site, of a computer virus, or other computer code or programming device that might be used to access, delete, damage, disable, disrupt or otherwise impede in any manner, the operation of the site or of any user’s software, hardware, data or property.


