
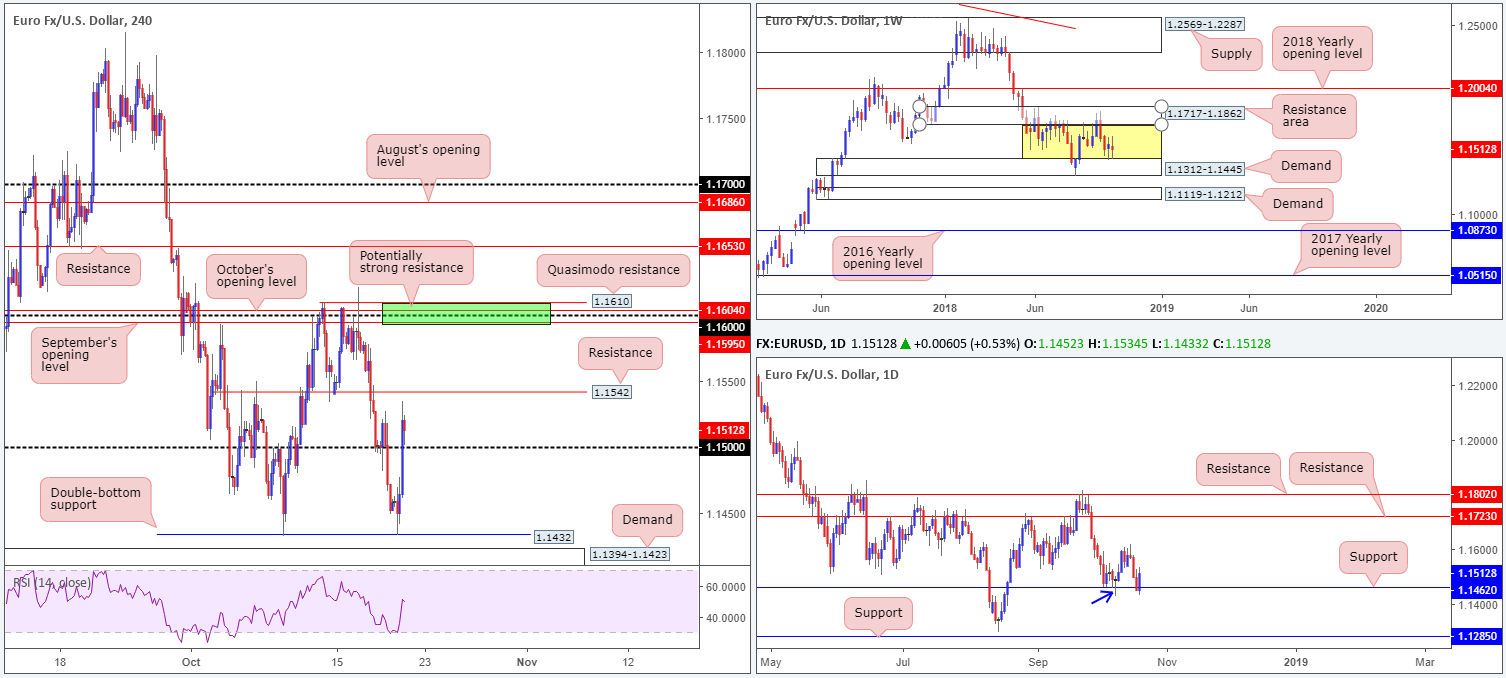
EUR/USD:
Weekly Gain/Loss: -0.39%
Weekly Close: 1.1512
Weekly perspective:
By way of two back-to-back indecision candles, the top edge of demand at 1.1312-1.1445 remains firmly in the headlights. In the event buyers regain composure from this point, price shows room to extend as far north as a resistance area coming in at 1.1717-1.1862 (capped upside since early June 2018).
According to our technical studies, this timeframe is now considered range bound (yellow zone). Areas outside of this border fall in at the 2018 yearly opening level drawn from 1.2004 and demand marked at 1.1312-1.1445.
Daily perspective:
Support at 1.1462 (boasts notable history dating as far back as early 2015 as resistance) is clearly a watched level on this timeframe at the moment. Holding ground in the shape of a bullish pin-bar formation the week prior (blue arrow), and last week’s session wrapping up in the form of a bullish engulfing pattern, scope for a push to the October 16 high at 1.1621 is possible this week, followed by resistance at 1.1723 (sited within the lower range of the noted weekly resistance area).
H4 perspective:
Benefitting from a broad-based USD retracement (dollar index), and a recovery in overall risk sentiment largely on the back of less EU angst over Italy’s budget, Friday’s action ended 0.53% in the green. The pair also derived a degree of technical support from the October 9 low 1.1432 – so far meeting the characteristics for a double-bottom pattern – lifting the unit beyond its 1.15 threshold.
Directly overhead, possible resistance rests at 1.1542, trailed by a nice-looking area of resistance (green) at 1.1610-1.1595 (comprised of a Quasimodo resistance at 1.1610, October’s opening level at 1.1604, the 1.16 handle and September’s opening level at 1.1595).
Areas of consideration:
In light of weekly and daily price exhibiting the possibility of pushing higher this week, a sell from H4 resistance at 1.1542 is chancy and unlikely to produce much of a bounce.
With that being the case, a retest of 1.15 as support in the shape of a H4 bullish candlestick configuration is attractive, targeting the 1.16ish region. Stop/entry, in this case, can be dictated by the selected candlestick pattern.
1.16, although an upside target for longs, is also an area worthy of consideration for shorts this week. Not only is the number associated with a collection of H4 resistances (see above), it also circulates nearby the next upside target on the daily timeframe: the October 16 high at 1.1621. Conservative stop-loss placement for a 1.16ish short falls in above the H4 Quasimodo resistance (1.1610) apex at 1.1621, with the first take-profit objective positioned around 1.1550s.
Today’s data points: Limited.
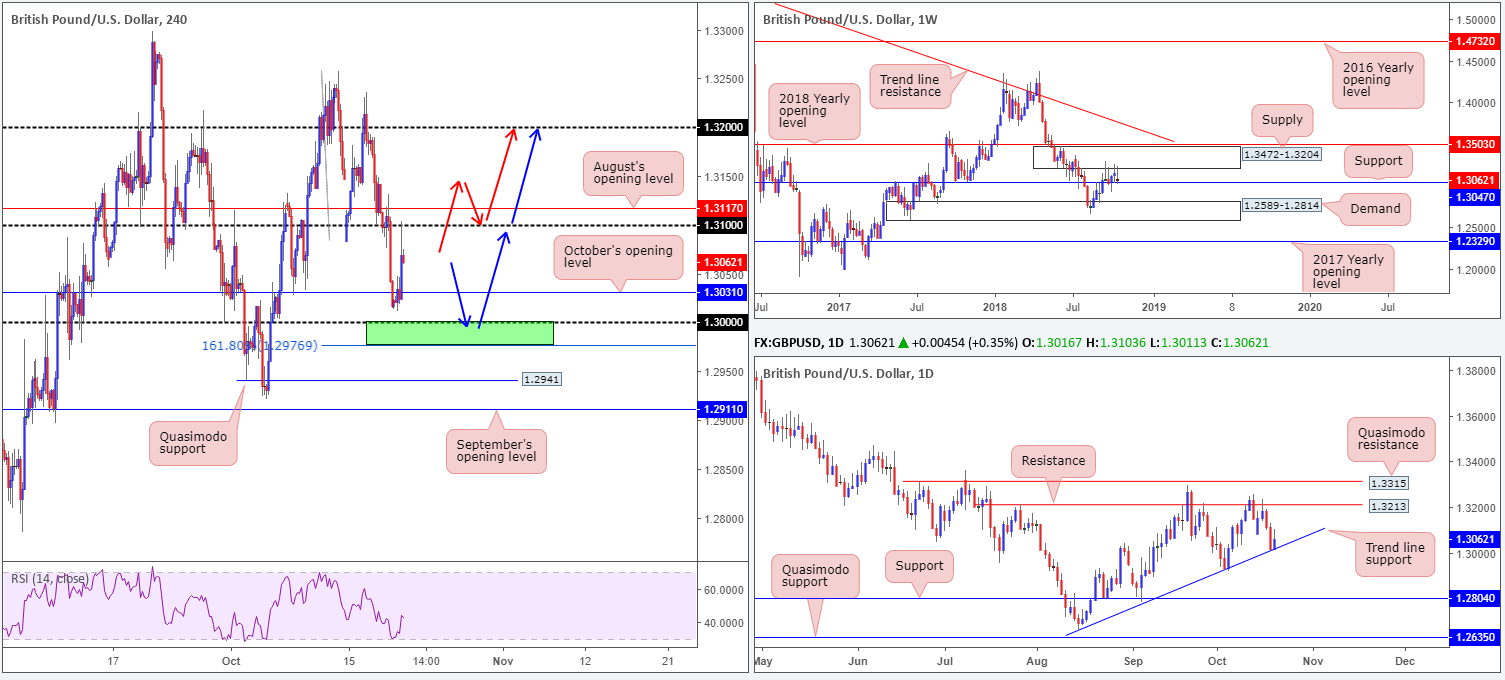
GBP/USD:
Weekly Gain/Loss: -0.64%
Weekly Close: 1.3062
Weekly perspective:
Since mid-September, the British pound has been drifting between notable supply marked at 1.3472-1.3204 and support at 1.3047. Perhaps the most compelling factor from last week’s movement is the bearish pin-bar formation. The question is, though, is it enough to push through support?
Beyond these borders, the 2018 yearly opening level is visible at 1.3503, while to the downside proven demand rests at 1.2589-1.2814.
Daily perspective:
Snapping a two-day bearish phase on Friday, the market witnessed a modest recovery from a trend line support (etched from the low 1.2661). Further buying from this region this week has resistance at 1.3213 as its next upside target, trailed by a Quasimodo resistance linked at 1.3315.
H4 perspective:
Leaving key figure 1.30 unchallenged on Friday, H4 price regained composure around October’s opening level at 1.3031 and pressed for higher ground towards its 1.31 neighbourhood. Despite the lack of progress in Brexit negotiations, the pound remained reasonably buoyant across the board.
Areas of consideration:
Having seen weekly price close the week out respecting support at 1.3047 (albeit in the shape of a bearish pin-bar pattern), and daily flow shake hands with a trend line support, scope for further upside is present. However, entering long at current price is not recommended after Friday’s rejection from the underside of 1.31.
Two potential scenarios are visible:
- Given higher-timeframe supports, a retest of 1.30/161.8% Fib ext. point at 1.2976 (green H4 zone) is an option, with an ultimate target set around 1.32 (blue arrows): the underside of weekly supply (1.3204). As for stop-loss placement, traders may fix it beneath 1.2976 or (for conservative traders) wait for H4 candlestick confirmation and base entry/stop levels on the pattern’s structure.
- A failure to pullback to 1.30 may eventually lead to a H4 close forming above 1.31/August’s opening level at 1.3117. Followed up with a retest as support (preferably by way of a H4 bullish candlestick formation as this will provide entry/stop parameters), a long is possible from here, targeting 1.32 (red arrows).
Today’s data points: Limited.
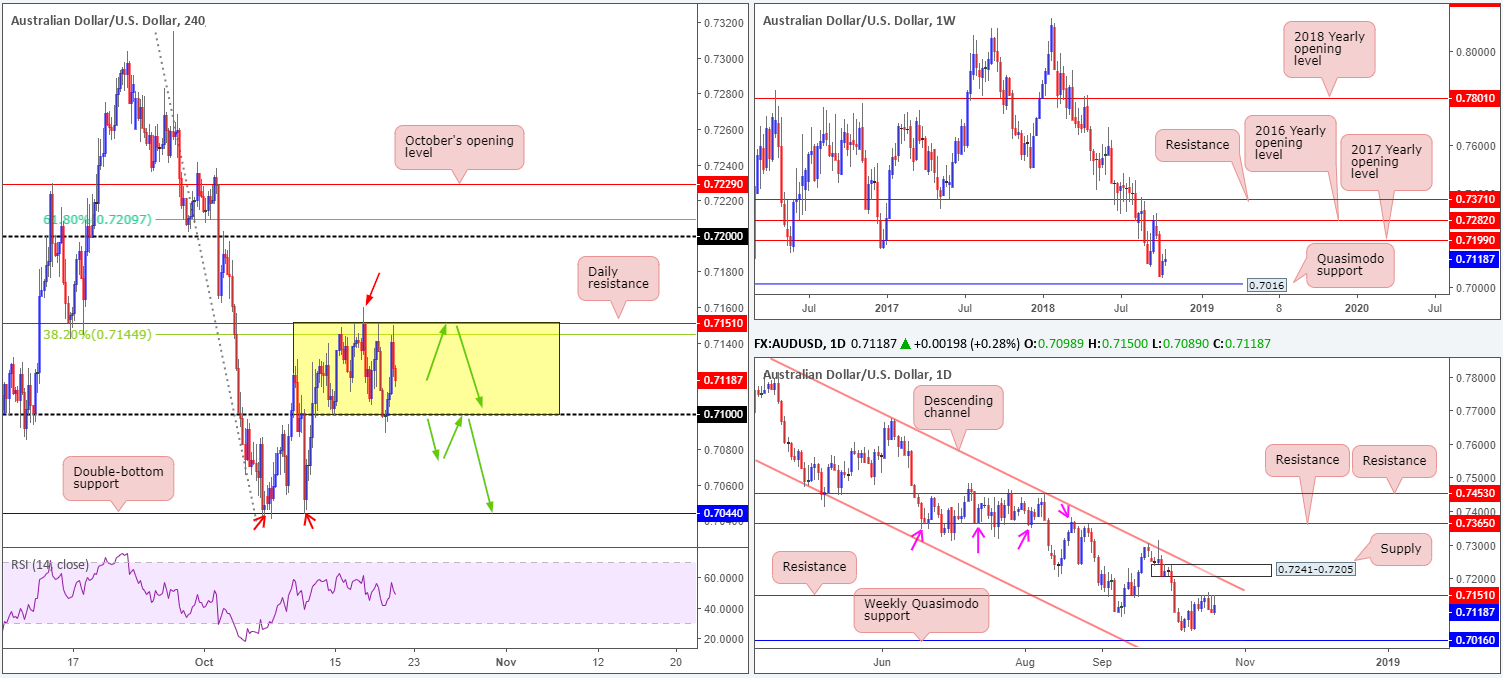
AUD/USD:
Weekly Gain/Loss: +0.11%
Weekly Close: 0.7118
Weekly perspective:
In terms of the market’s position on the weekly timeframe, the commodity currency trades mid-range between resistance at 0.7199 (the 2017 yearly opening level) and a Quasimodo support at 0.7016. Although both levels are of equal weighting, the week closed out forming a reasonably strong selling wick. For that reason, further selling may be in store this week towards the noted Quasimodo support.
Daily perspective:
Capped firmly by resistance at 0.7151 by means of multiple bearish candlestick configurations last week, there’s a chance we could be heading for lower ground this week on this timeframe. Sellers likely have the October 8 low of 0.7040 on the radar, followed closely by the weekly Quasimodo support mentioned above at 0.7016.
H4 perspective:
Despite a strong rebound off 0.71 Friday, the Australian dollar, once again, failed to sustain gains beyond its 0.7050 mark, capped by noted daily resistance at 0.7151, along with a 38.2% H4 Fib resistance at 0.7144.
In this light, the H4 candles are now considered range bound between 0.7050/0.71 (yellow zone). As higher-timeframe positioning generally takes precedence over its lower counterparts, though, a break of 0.71 is a strong possibility, targeting H4 double-bottom support at 0.7044 as the initial port of call.
Areas of consideration:
Rather than looking to fade 0.71, the spotlight is focused on either a break beyond this number or a retest of daily resistance at 0.7151 today/this week.
A retest of 0.7151 held by a H4 bearish candlestick signal is considered a high-probability short, targeting 0.71, followed by 0.7044. The reason for requiring additional candlestick confirmation is to help avoid being whipsawed out of a trade on a fakeout similar to Wednesday’s move (red arrow). What’s more, a completed candlestick formation provides traders entry/stop parameters.
A H4 close beneath 0.71 that’s followed up with a retest by way of a H4 bearish candlestick formation is, according to our studies, also a high-probability shorting opportunity. Beyond the first take-profit target: 0.7044, traders are also urged to consider the weekly Quasimodo support at 0.7016 as the ultimate downside objective.
Today’s data points: Limited.
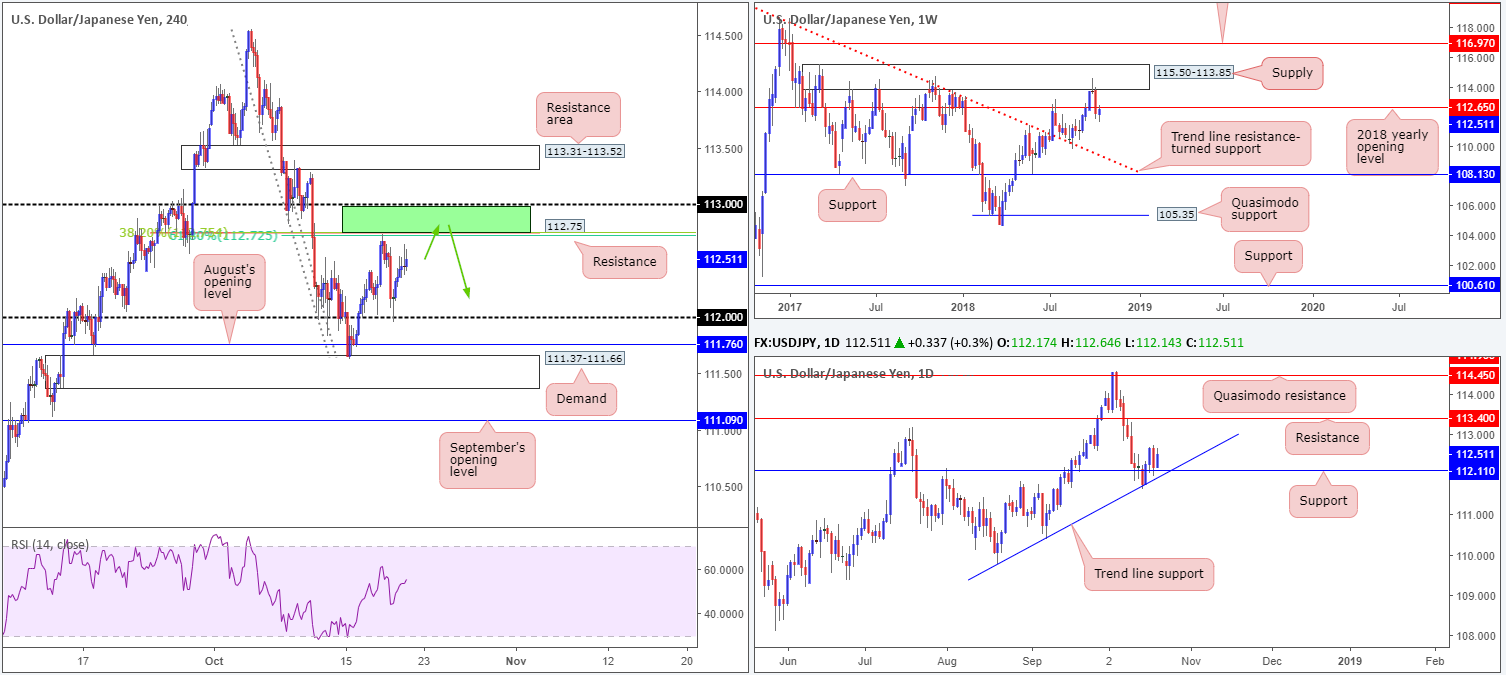
USD/JPY:
Weekly Gain/Loss: +0.28%
Weekly Close: 112.51
Weekly perspective:
The USD/JPY marginally pulled back over the course of last week’s sessions and retested the underside of the 2018 yearly opening level at 112.65, eroding a portion of recent losses. This is considered a notable level, and therefore the odds of strong sellers entering the mix from here this week are high. The next downside target from here falls in at the trend line resistance-turned support (extended from the high 123.57), whereas a break higher has supply positioned at 115.50-113.85 in view.
Daily perspective:
Contrary to weekly action, the ducks are being lined up for a potential move higher on the daily timeframe. Following Tuesday’s strong rebound off trend line support (extended from the low 109.77) that engulfed resistance at 112.11, price retested this level as support Wednesday and held position in the form of an inside candle pattern (buy signal) into the week’s close. Another factor in favour of a push higher this week is limited resistance is seen on this scale until reaching 113.40.
H4 perspective:
A quick recap of Friday’s activity on the H4 timeframe saw the pair stage a modest recovery off its 112 handle. Bolstered by stabilizing US equities, the pair reached highs just south of resistance at 112.75 (closely linked with two Fibonacci resistances at 38.2%/61.8% at 112.75 and 112.72, respectively). Note 112.75 is also positioned just 10 pips north of the 2018 yearly opening level at 112.65 marked on the weekly timeframe.
Areas of consideration:
On the whole, sellers appear to have the upper hand at the moment.
Weekly price trading from resistance at 112.65, along with H4 resistance at 112.75 that boasts Fibonacci confluence, opens the area between the 113 handle (plotted on the H4 timeframe) and 112.75 (green H4 zone) for possible shorting opportunities today/early week.
Due to the threat of further buying coming about on the daily timeframe, traders are urged to consider waiting for additional H4 bearish candlestick confirmation to form out of the noted green zone before pulling the trigger. With respect to downside targets from this neighbourhood, daily support at 112.11 is an obvious trouble area, followed by the 112 handle on the H4.
Today’s data points: Limited.
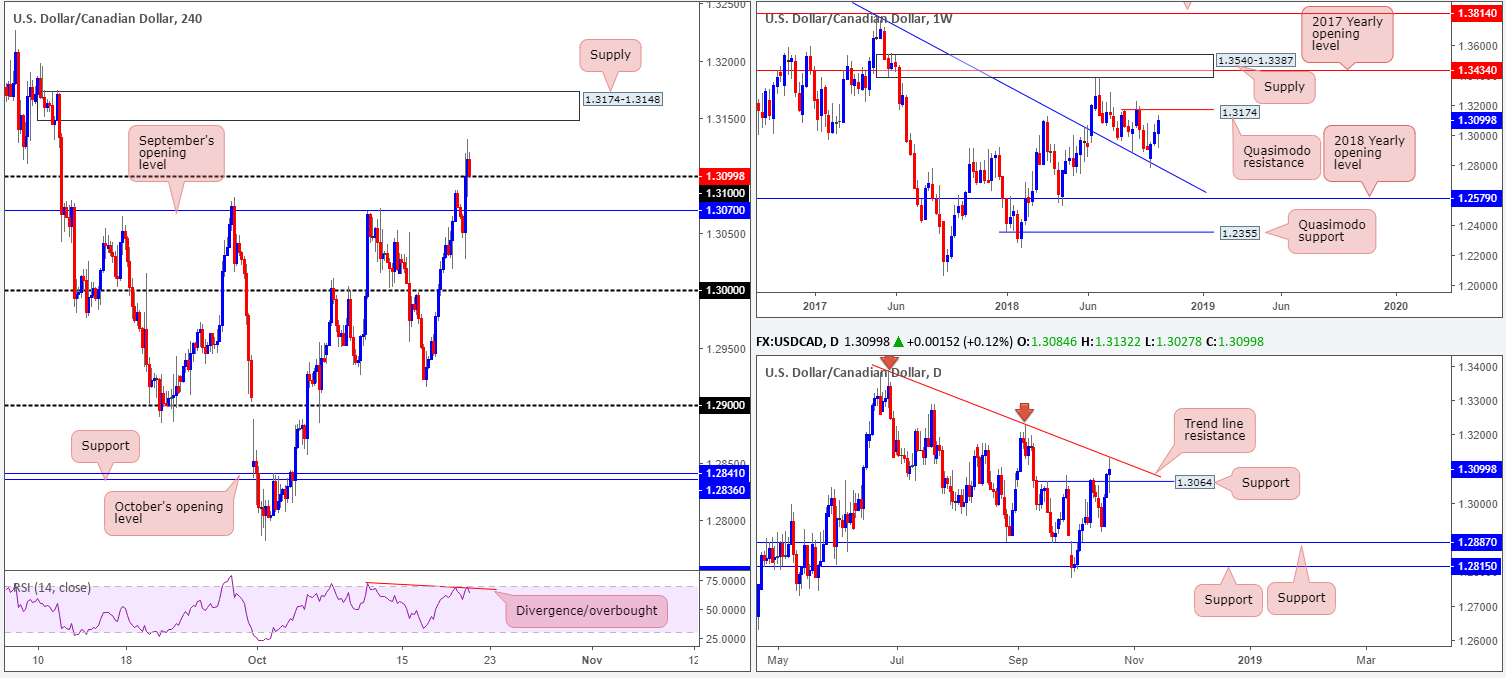
USD/CAD:
Weekly Gain/Loss: +0.61%
Weekly Close: 1.3099
Weekly perspective:
The USD/CAD market enjoyed another successful week, consequently penciling in its third consecutive weekly gain since rebounding off trend line resistance-turned support (stretched from the high 1.4689). This week’s action, however, may see weekly players cover some of their long positions as the unit approaches Quasimodo resistance at 1.3174. Overthrowing this level, on the other hand, brings supply at 1.3540-1.3387 back into the spotlight.
Daily perspective:
Resistance-turned support at 1.3064 was retested on Friday, though failed to generate much follow through to the upside. Wrapping up the week by way of an indecision candle (albeit with a slight bullish tone), active sellers made an appearance from neighbouring trend line resistance (etched from the high 1.3386). A break of the trend line will need to be seen before weekly players reach the aforementioned Quasimodo resistance level.
H4 perspective:
Bolstered by softer-than-expected inflation growth data and retail sales figures out of Canada, Friday’s action witnessed the USD/CAD advance higher. CPI softened in September posting at -0.4% below the previous -0.1%, and retail sales for August came in at -0.1% vs. 0.3% expected.
Should H4 traders defend 1.31 today, supply at 1.3174-1.3148 is the next area in the offing. Note the top edge of this area skirts the underside of the aforementioned weekly Quasimodo resistance level. A push beneath 1.31, nonetheless, has September’s opening level in sight at 1.3070.
It might also be worth noting the RSI indicator is currently displaying a divergence signal around its overbought value.
Areas of consideration:
As long as H4 price holds 1.31 in reasonably strong fashion, we still feel between this number and the H4 supply mentioned above at 1.3174-1.3148 is a tradable zone for possible intraday longs. However, traders are urged to keep risk/reward in mind here – look to achieve at least a 1:1:5/1:2 ratio to 1.3148.
Keep in mind should price also enter the H4 supply and head for its upper edge, strong sellers likely lie in wait here given its connection to the weekly Quasimodo resistance. As such, liquidating a large portion of long positions around this angle is an option.
Today’s data points: Limited.
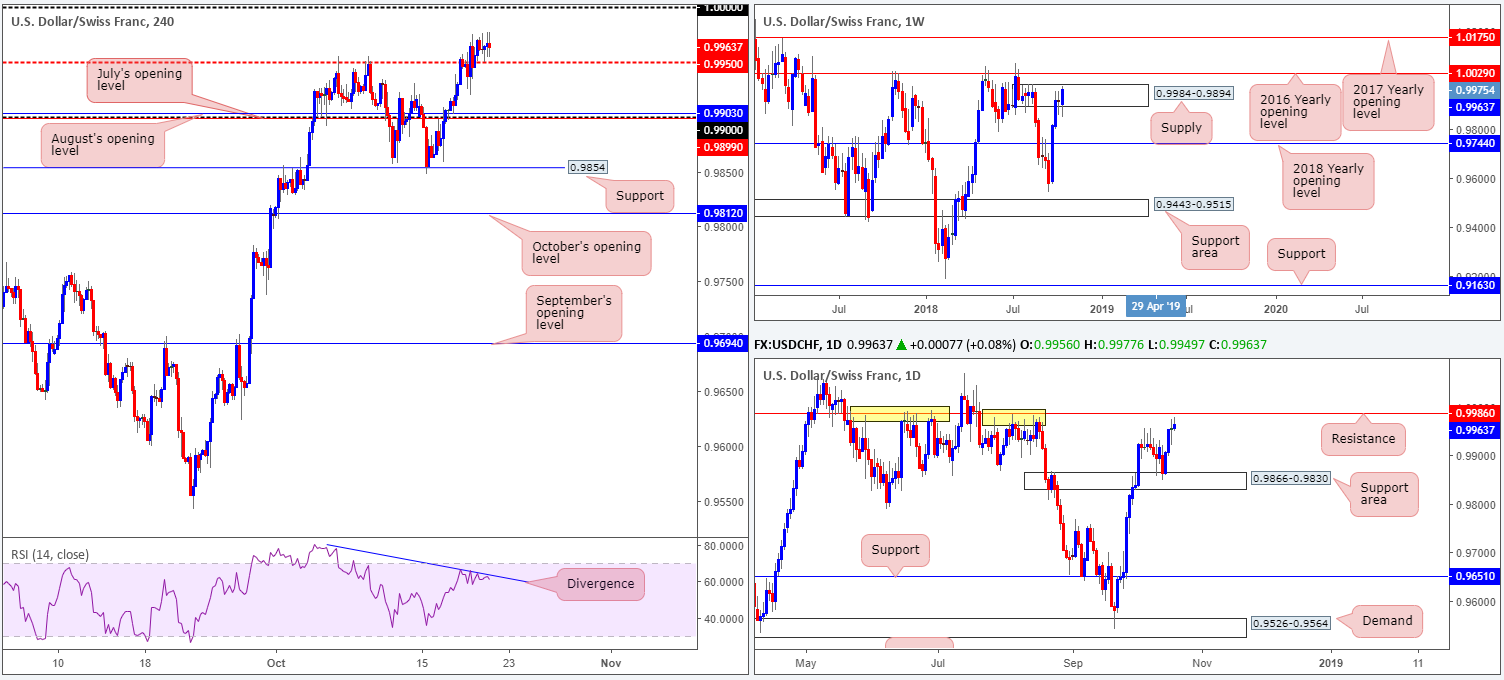
USD/CHF:
Weekly Gain/Loss: +0.47%
Weekly Close: 0.9963
Weekly perspective:
Organized as a bullish engulfing formation, the USD/CHF drove higher into the walls of supply at 0.9984-0.9894 last week. Judging by the recent candle close and lack of selling interest over the past weeks, traders may want to pencil in the 2016 yearly opening level at 1.0029 in the event we push for higher ground this week.
Daily perspective:
Daily action, nevertheless, is seen fast approaching resistance plotted two pips beyond the current weekly supply at 0.9986. Overlooking this level would be a mistake! Check out its recent history holding price action lower (yellow points) – it’s impressive!
H4 perspective:
USD/CHF movement was somewhat sedated on Friday, despite refreshing two-month tops. Of late, the H4 candles found a floor of support off its 0.9950 point, with parity (1.0000) now firmly in sight as the next upside target on this timeframe. Traders may also want to acknowledge the H4 RSI indicator is currently displaying bearish divergence.
Areas of consideration:
Based on the above reading, shorts from daily resistance at 0.9986 is an option, with conservative stop-loss orders positioned above the 2016 yearly opening level at 1.0029 on the weekly timeframe. This helps clear any fakeout play around 1.0000, which, as most are already aware, is common viewing around psychological numbers.
In terms of downside targets from here, 0.9950 appears a logical first step, followed by the 0.99 handle, according to the overall technical picture. From 0.9986 to 0.99 is reasonable a 1:2 risk/reward ratio.
Today’s data points: Limited.
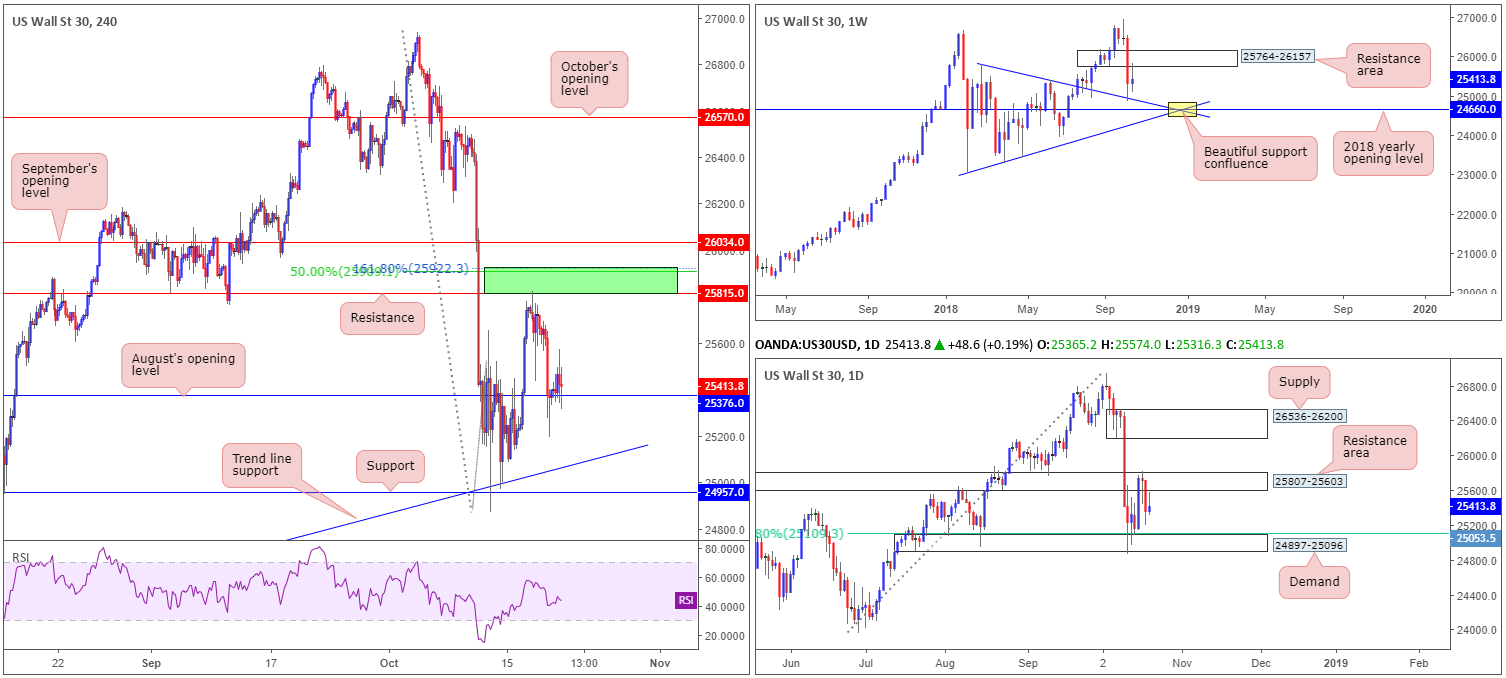
Dow Jones Industrial Average:
Weekly Gain/Loss: +0.33%
Weekly Close: 25413
Weekly perspective:
Following the prior week’s precipitous decline that touched gloves with trend line resistance-turned support (taken from the high 25807), last week’s movement observed an earnest recovery attempt, though failed to overcome the lower edge of a neighbouring resistance area at 25764-26157.
A particularly interesting area on this timeframe worth noting is the point at which two trend lines intersect (25807/23055 yellow) with the 2018 yearly opening at 24660. The support confluence here is mouthwatering.
Daily perspective:
A closer look at price action on the daily timeframe points the spotlight towards a resistance area parked at 25807-25603 and a demand area coming in at 24897-25096 (closely intersects with a 61.8% Fib support at 25109). Both barriers carry equal weight, according to our studies, and, therefore each could generate a reaction this week.
H4 perspective:
Despite a number of attempts to explore ground beyond August’s opening level at 25376 Friday, each shot fell flat. In the event the index presses higher today/early week we could observe a second retest of resistance at 25815. You may recall this, coupled with nearby Fibonacci calculations around 25922, was (and still is) a sell zone (green).
A break of 25376, on the other hand, places the 61.8% daily Fib support mentioned above at 25109 on the hit list, followed by nearby trend line support (etched from the low 23451) and then support at 24957.
Areas of consideration:
Technically speaking, there’s limited room to maneuver on the H4 beneath 25376 in regard to shorts. And buying from 25376, given it houses little higher-timeframe convergence, would be a chancy move.
This leaves 25922/25815: the H4 green sell zone (positioned within the walls of the weekly resistance area at 25764-26157 and around the top limit of the daily resistance area at 25807-25603), and H4 support at 24597 as a buy zone (converges closely with the weekly trend line resistance-turned support [taken from the high 25807] and is located within the lower range of daily demand at 24897-25096) in view this week.
Today’s data points: Limited.
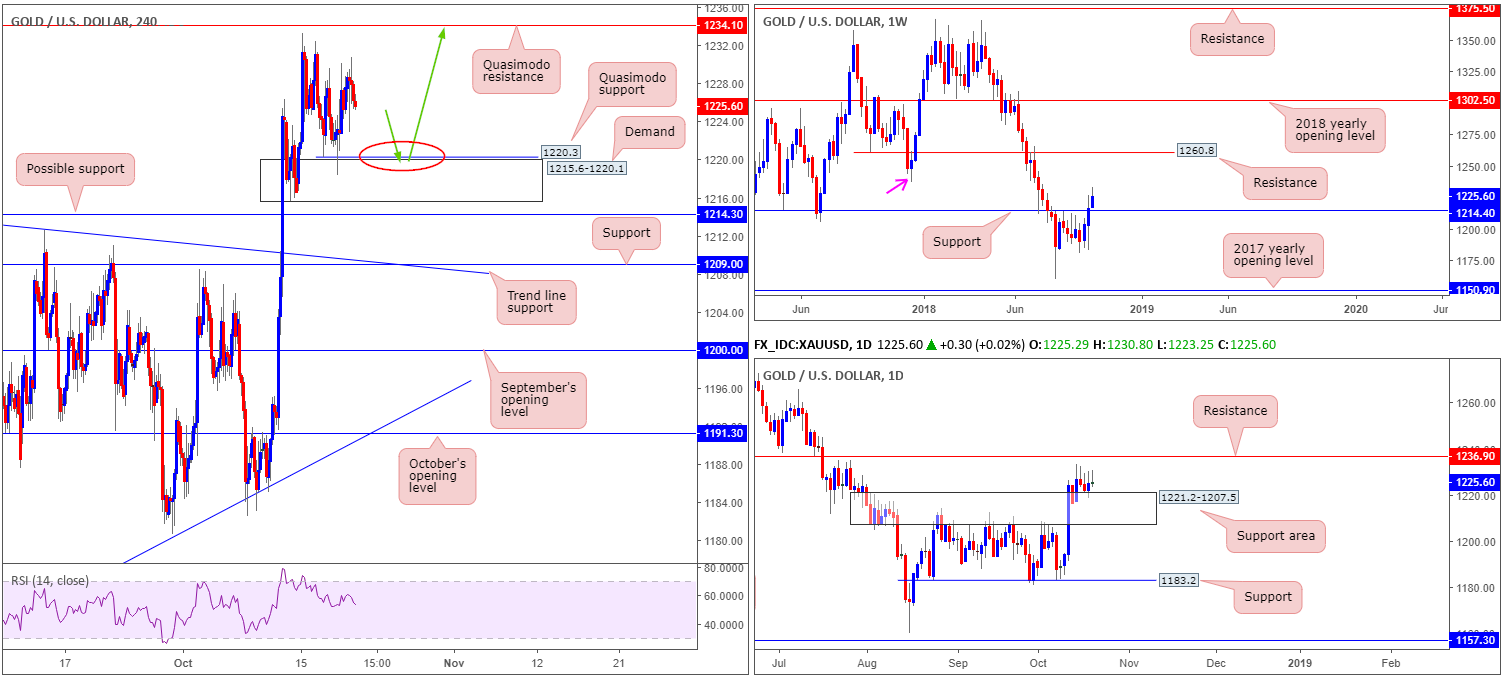
XAU/USD (Gold
Weekly Gain/Loss: +0.74%
Weekly Close: 1225.6
Weekly perspective:
After marginally engulfing key resistance coming in at 1214.4, the price of gold progressed further into positive territory last week, reaching highs of 1233.3. From this point, swing resistance is evident at 1236.6 (pink arrow), though the majority of eyes are likely honed in on resistance marked at 1260.8. Before we reach 1236.6, however, traders might want to pencil in the possibility of price retesting 1214.4 as support.
Daily perspective:
The support area at 1221.2-1207.5, as you can see, had the top edge of its zone retested Wednesday, and formed a bullish engulfing formation Thursday. Despite Friday’s bearish pin-bar pattern forming, resistance is stationed nearby at 1236.9 as the next upside target, which also happens to represent the swing resistance mentioned above on the weekly timeframe at 1236.6.
H4 perspective:
As Thursday’s price was effectively unchanged going into Friday’s close, our outlook remains unchanged.
Demand at 1215.6-1220.1, as you can see, held price higher Thursday. Housed within the upper limits of the daily support area at 1221.2-1207.5, price could potentially stretch as far north as the Quasimodo resistance level priced in at 1234.1 from here/current price. Beyond this point, we have daily resistance posted nearby at 1236.9, which, as we already know, is closely tied with weekly swing resistance at 1236.6.
Areas of consideration:
Until price connects with 1234.1/1236.9, this market boasts an upside bias, according to our reading. A pullback from current price could bring H4 action towards a recently formed H4 Quasimodo support linked at 1220.3 (positioned just ahead of the current H4 demand area).
A pullback to the current H4 Quasimodo support along with a response by means of a H4 bullish candlestick formation would, according to where we’re located on the higher timeframes at the moment, be considered a high-probability buying opportunity, targeting the H4 Quasimodo resistance at 1234.1.
As for stop and entry parameters, traders have the choice of either following the rules of engagement from the selected candlestick configuration, or entering based on the candlestick close and placing stops beneath the current H4 demand at 1215.6-1220.1.
The use of the site is agreement that the site is for informational and educational purposes only and does not constitute advice in any form in the furtherance of any trade or trading decisions.
The accuracy, completeness and timeliness of the information contained on this site cannot be guaranteed. IC Markets does not warranty, guarantee or make any representations, or assume any liability with regard to financial results based on the use of the information in the site.
News, views, opinions, recommendations and other information obtained from sources outside of www.icmarkets.com.au, used in this site are believed to be reliable, but we cannot guarantee their accuracy or completeness. All such information is subject to change at any time without notice. IC Markets assumes no responsibility for the content of any linked site. The fact that such links may exist does not indicate approval or endorsement of any material contained on any linked site.
IC Markets is not liable for any harm caused by the transmission, through accessing the services or information on this site, of a computer virus, or other computer code or programming device that might be used to access, delete, damage, disable, disrupt or otherwise impede in any manner, the operation of the site or of any user’s software, hardware, data or property.


