EUR/USD:
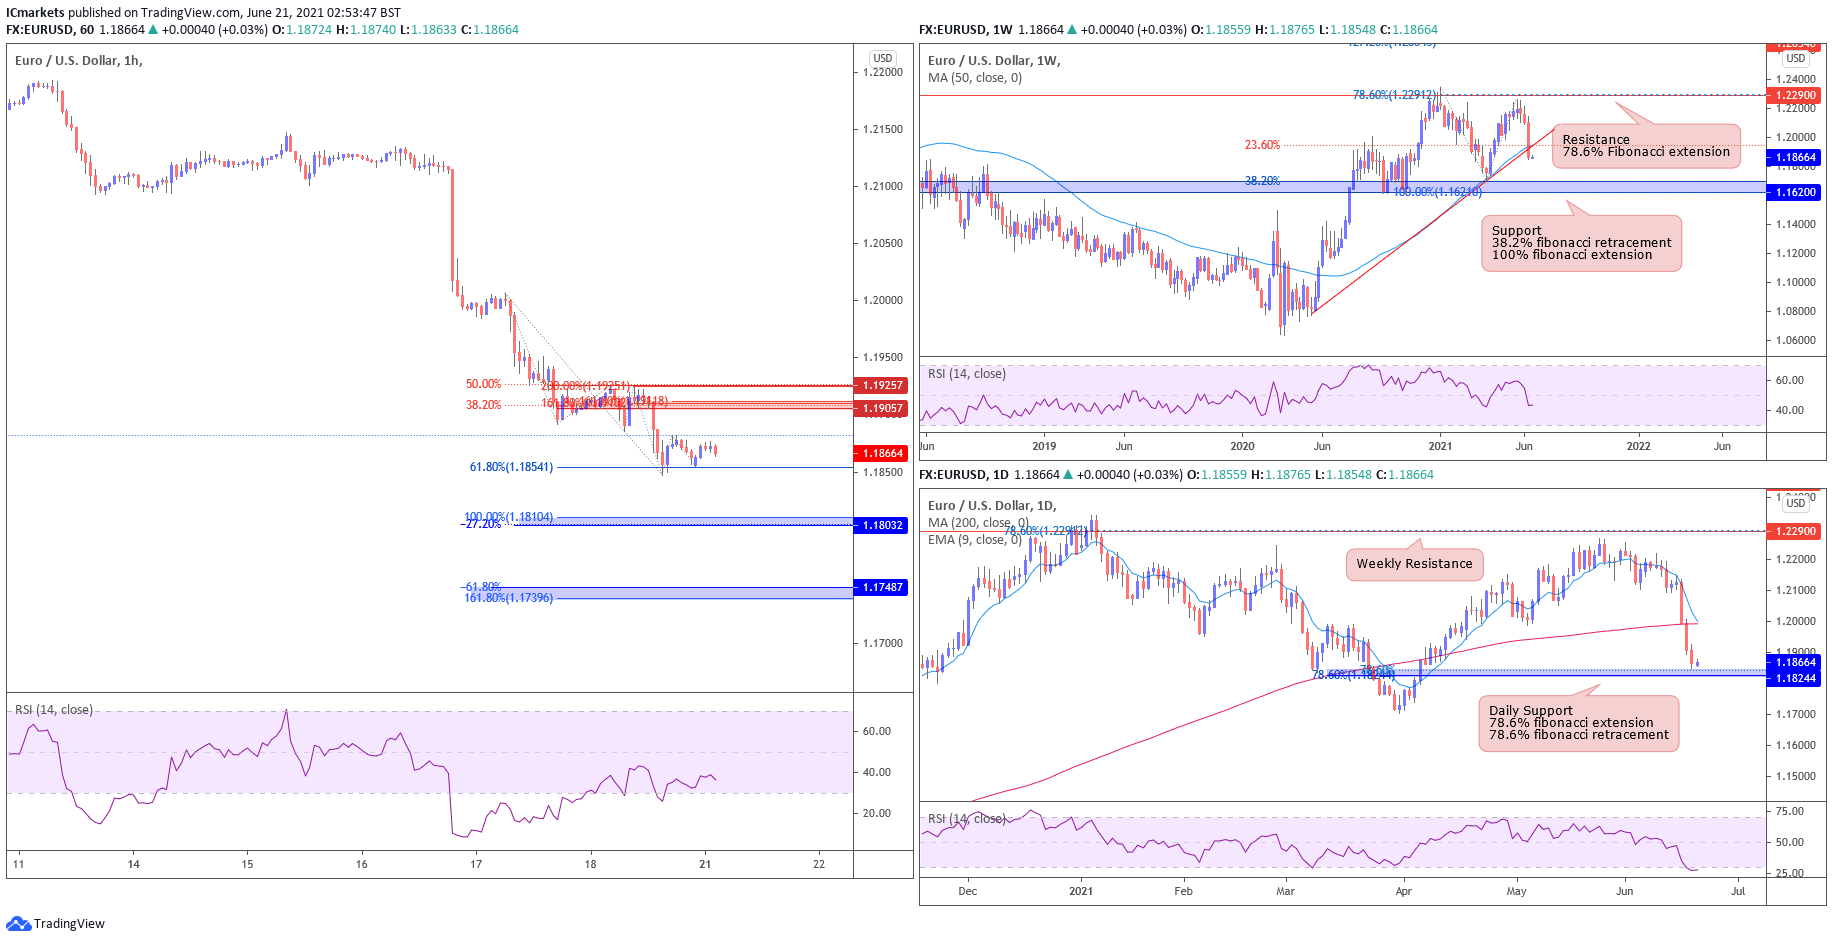
Looking at the weekly chart we can see that prices have broken the 23.6% Fibonacci retracement and ascending trendline support. We could potentially see further bearish pressure this week to 1.16200, in-line with 38.2% Fibonacci retracement and 100% Fibonacci extension. RSI is also signaling a bearish momentum in-line with our weekly bearish outlook. On the daily chart, prices are finding support at 1.18244, in-line with 78.6% Fibonacci extension and 78.6% Fibonacci retracement. RSI is oversold and there could potentially be a short-term bounce.
On the H4 timeframe, prices broke down and found support at 1.18556, in-line with 100% Fibonacci extension and 61.8% Fibonacci retracement. We are potentially seeing a short-term bounce to 1.119057, in-line with 38.2% Fibonacci retracement and 161.8% Fibonacci extension. RSI is also over-sold, which also supports our view for a short-term bounce. The next level of resistance will be at 1.19257, in-line with 50% Fibonacci retracement and 200% Fibonacci extension
If price breaks current level, it could face further bearish pressure to 1.18032, in-line with -27.2% Fibonacci retracement and 100% Fibonacci extension. The next level of support will be at 1.17487, in-line with -61.8% Fibonacci retracement and 161.8% Fibonacci extension.
Areas of consideration:
- H4 time frame, support level at 1.18032 and 1.17487
- H4 time frame, resistance level at 1.19057 and 1.19257
GBP/USD:
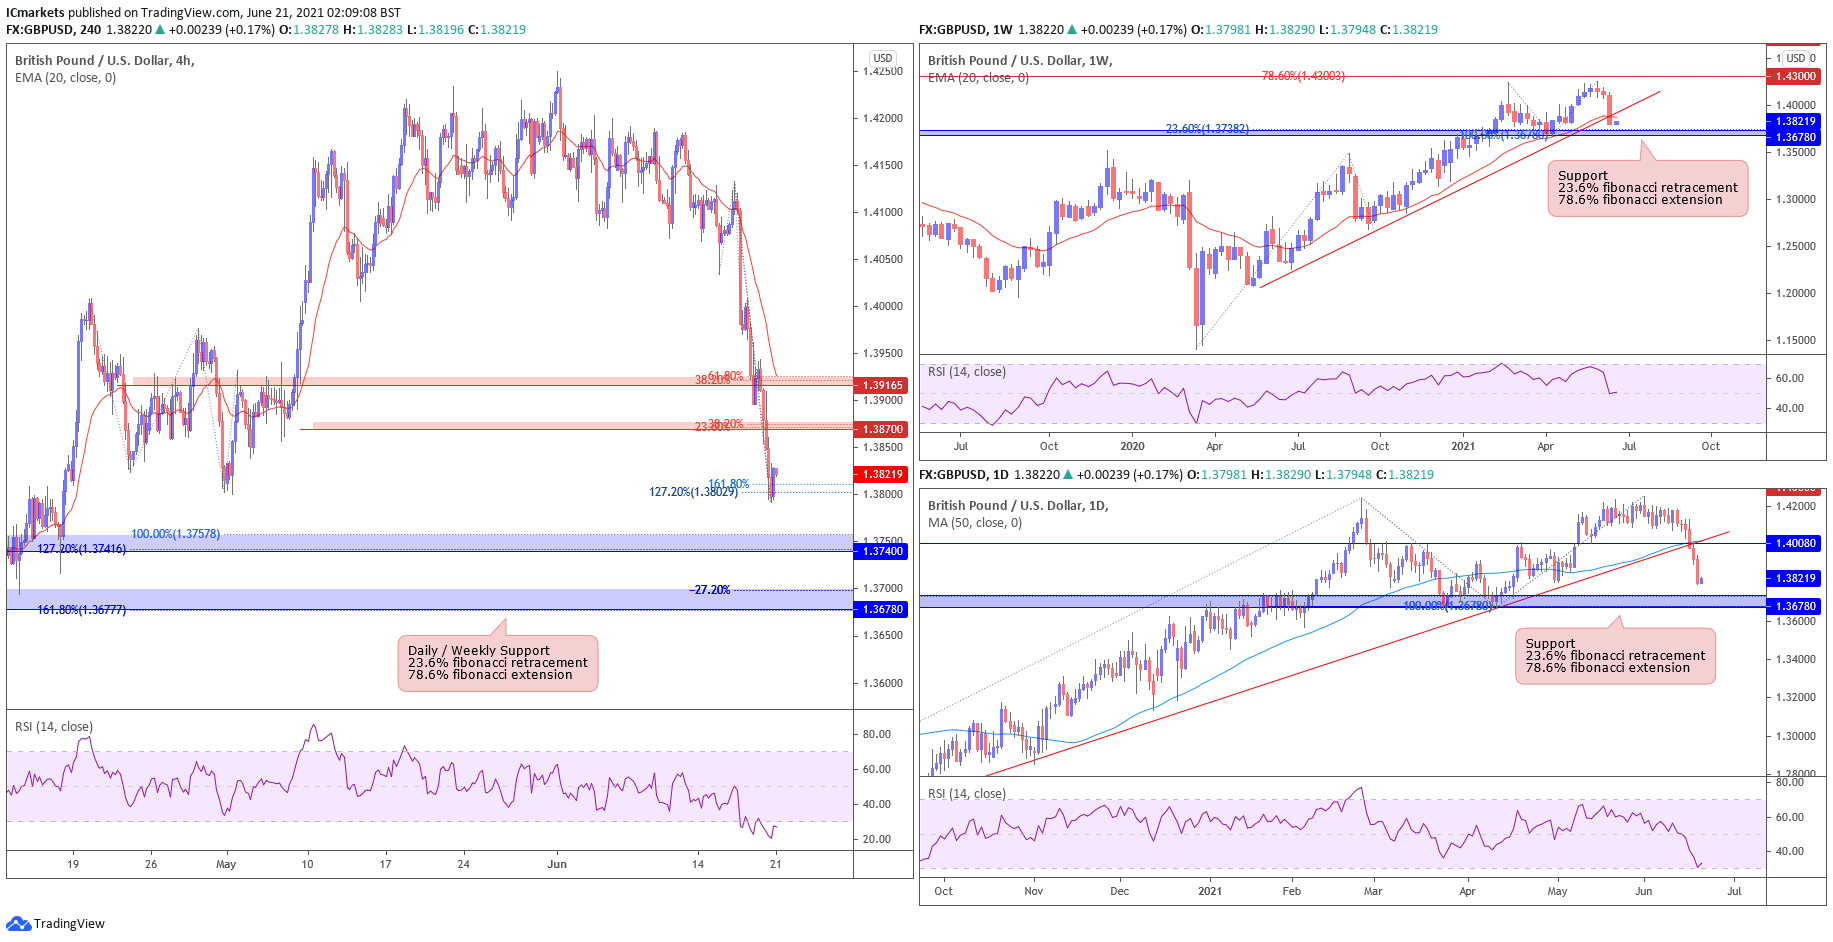
Looking at the weekly chart, we can see that prices have broke 20EMA, ascending trendline and found support at 1.37981. We could potentially see further bearish pressure this week to 1.36780, in-line with 23.6% Fibonacci retracement and 78.6% Fibonacci extension. RSI is also signaling a bearish momentum in-line with our bearish weekly outlook. On the daily time frame prices have broken below 50MA and ascending trendline, indicating strong bearish pressure. However, RSI is oversold and we expect a short-term bounce before further bearish pressure to 1.36780, in-line with weekly 23.6% Fibonacci retracement and 78.6% Fibonacci extension.
On the H4 timeframe, prices found support on our second support level at 1.38029, in-line with 161.8% & 127.2% Fibonacci extension. The price is below 20 EMA confirming a bearish momentum. However, the RSI is oversold and there could potentially be a short-term bounce. The first level of resistance is 1.38700, in-line with 23.6% and 38.2% Fibonacci retracement. The next level of resistance will be 1.39165, in-line with 38.2% and 61.8% Fibonacci retracement.
If prices break from the current level, we could see the first price facing further bearish pressure to 1.3740, in-line with 100% and 127.2% Fibonacci extension. The next level of support will be at 1.36780, in-line with -27.2% Fibonacci retracement & 161.8% Fibonacci extension.
Areas of consideration:
- H4 time frame, 37400 and 1.36780 support level
- H4 time frame, 1.38700 and 1.39165 resistance level
AUD/USD:
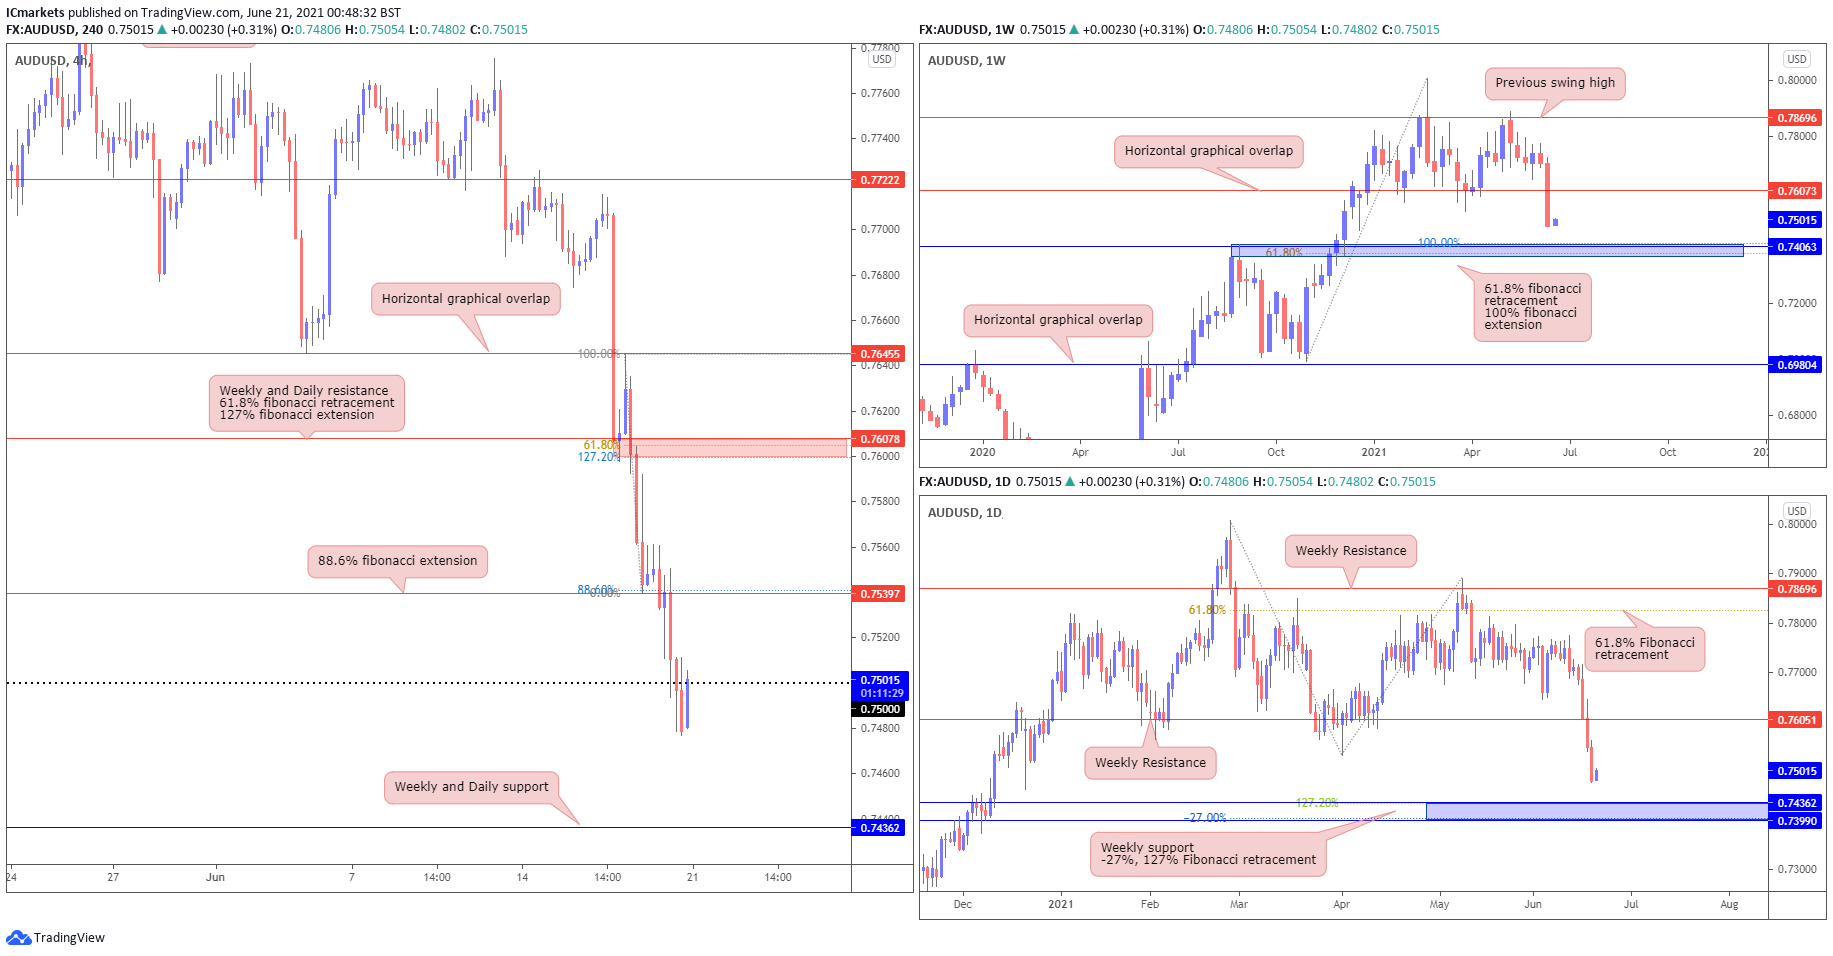
From the Weekly timeframe, we see price breaking beneath 0.76073, in line with previous swing low, where we may see a continuation of push down towards 0.74063, in line with 61.8% fibonacci retracement, 100% fibonacci extension and horizontal graphical overlap. From the daily timeframe, we see a similar action where price is pushing down towards the 0.74362 level, in line with Weekly support, -27% and 127% fibonacci retracement.
On the H4 timeframe, we see price breaking beneath and retested 0.75397, in line with Horizontal swing low support and 88.6% fibonacci extension level. Where price is pushing down towards 0.74382, in line with Daily and weekly support.
Areas of consideration:
- H4 timeframe, price may push lower towards 0.74382
- Daily and weekly time frames showing bearish pressure.
USD/JPY
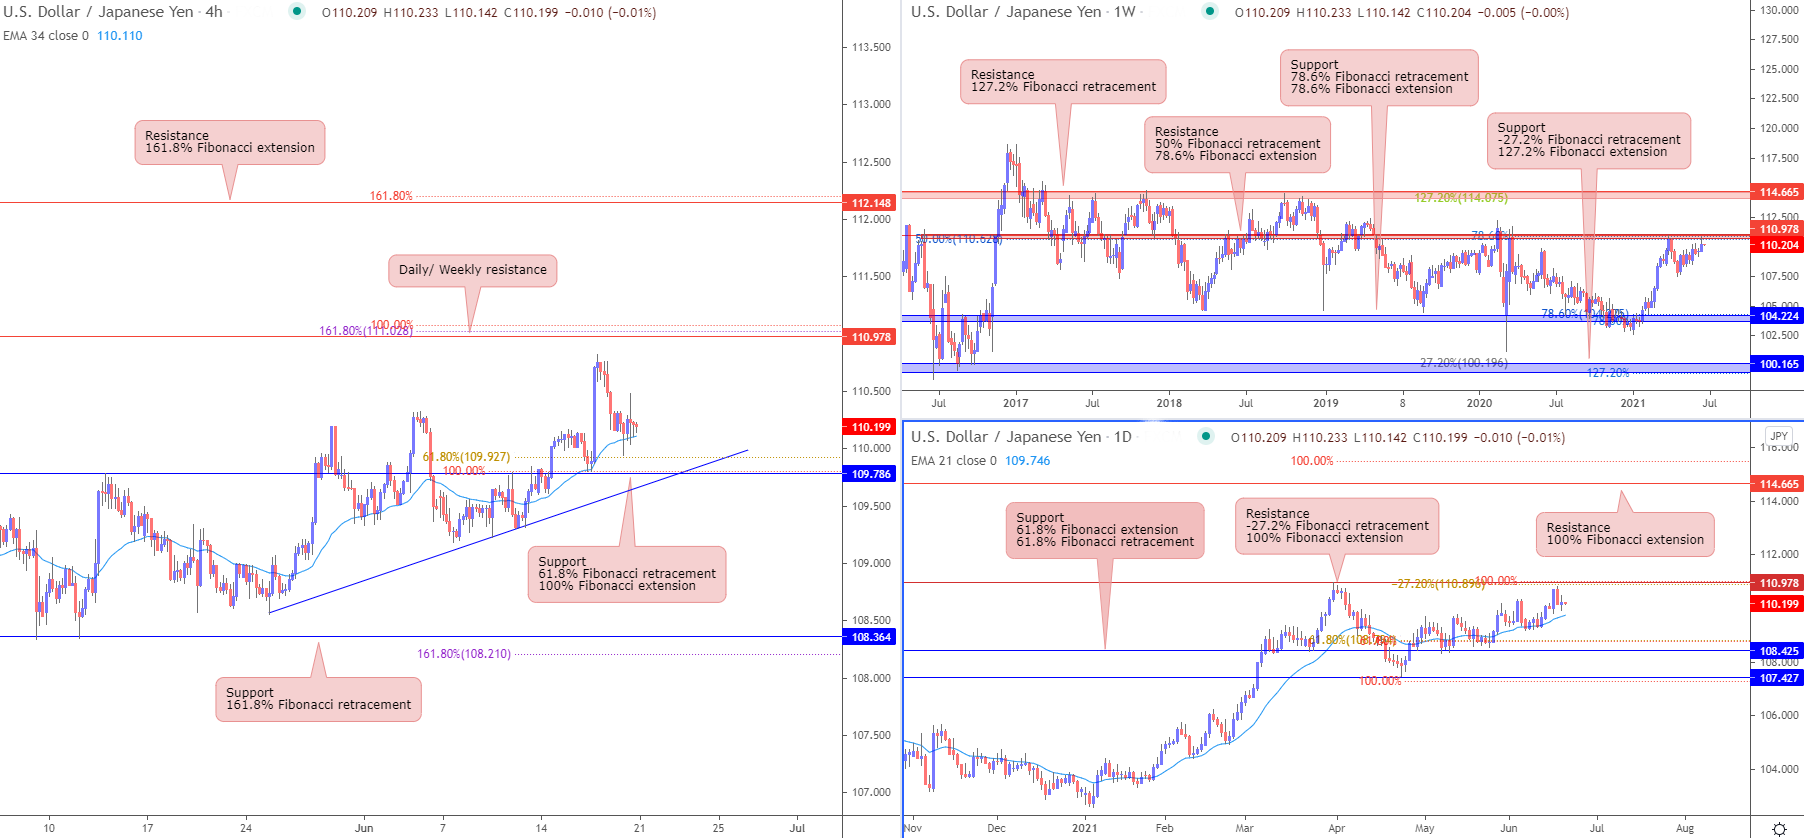
From the weekly timeframe, prices are facing resistance from horizontal swing high resistance which coincides with 50% Fibonacci retracement and 78.6% Fibonacci extension. Prices seem to be more bullish and might break through the resistance. If price breaks out, next target on the weekly would be the 114.665 level in line with 127.2% Fibonacci retracement. On the daily time frame, prices are holding nicely above the 21 period EMA. Prices are approaching resistance at 110.978 in line with the weekly level. A reversal from that level could mean prices would take support on 108.425 level. A continued push up could mean next target is weekly resistance of 114.665 in line with 100% Fibonacci extension level.
On the H4 timeframe, prices are showing the same picture. Prices are approaching the daily/weekly resistance level of 110.978. A break above the level could see prices pushing up towards 112.148, a short term resistance in line with 161.8% Fibonacci extension. Prices are pulling back to take support on 109.786 which is in line with ascending trendline support, 61.8% Fibonacci retracement and 100% Fibonacci extension. 34 Period EMA is also below prices, showing a bullish pressure for prices.
Areas of consideration:
- 148 resistance level on the H4 timeframe might be next upside target
- 978 level on every time frame
- 786 support level on the H4 timeframe
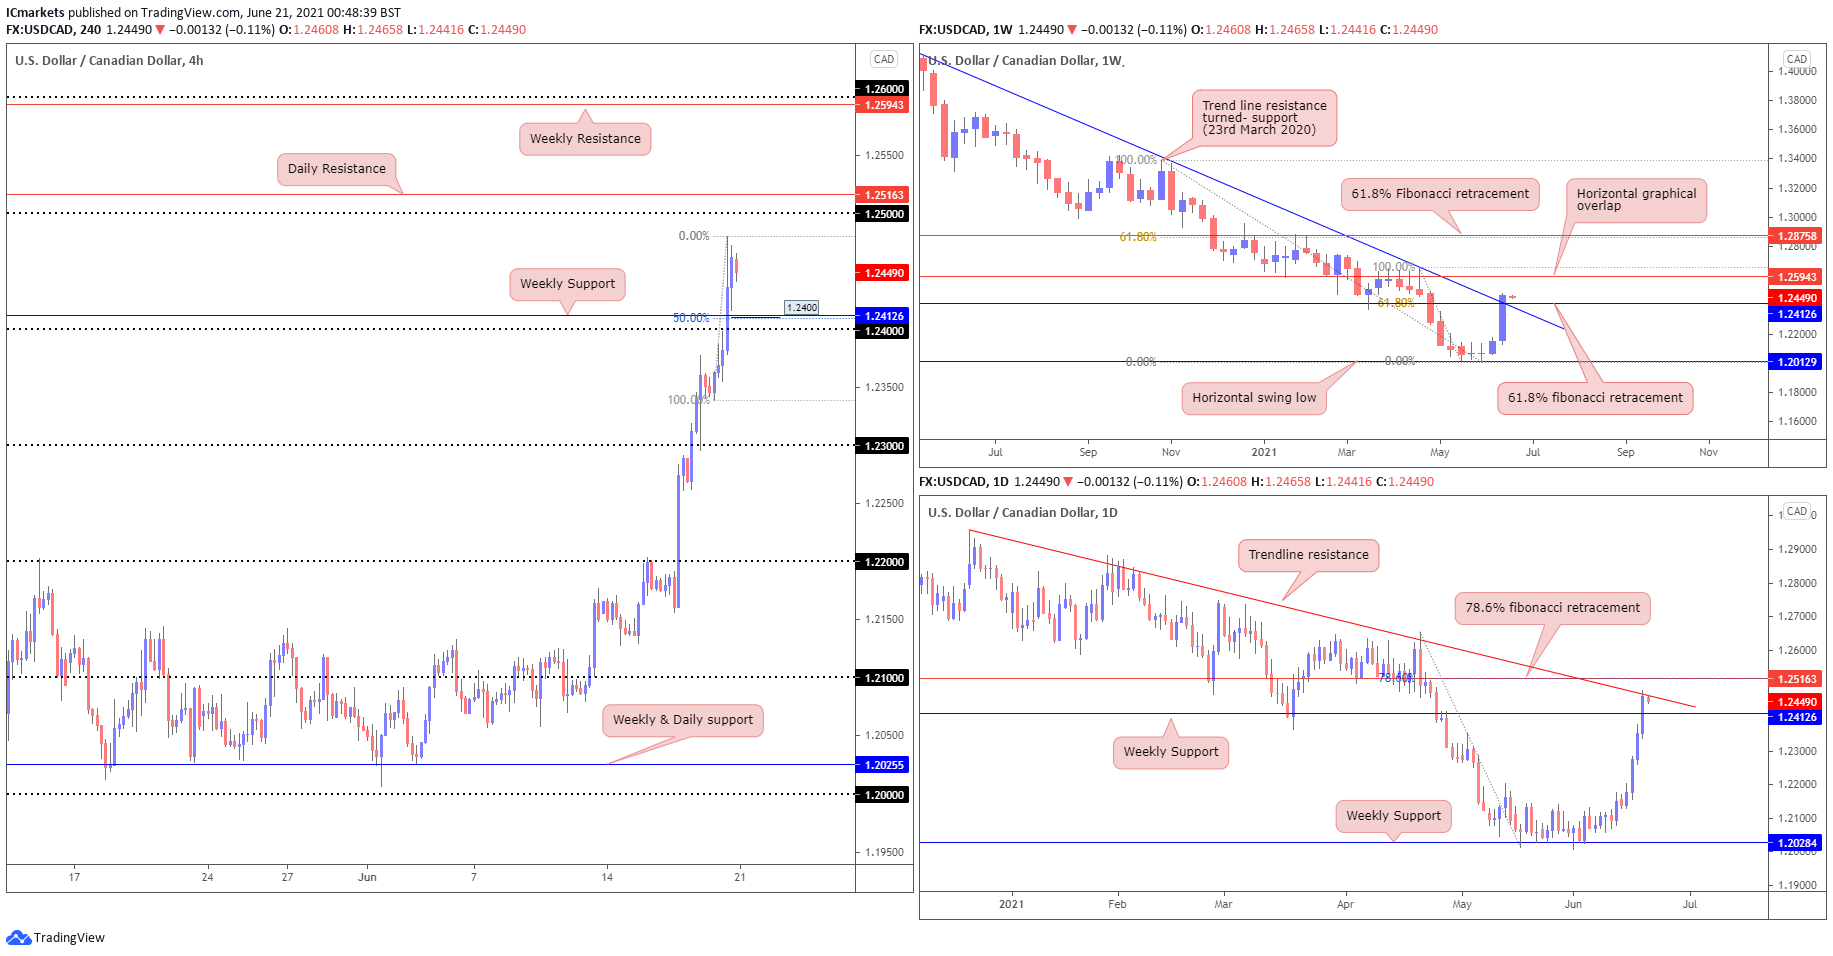
USD/CAD:
From the Weekly timeframe, we saw a testing of the descending trendline resistance turned support drawn from 23rd March 2020, and 61.8% fibonacci retracement is being tested, we may see a push down from here. On the daily timeframe, we are seeing a similar move, where price is trending under the daily descending trendline resistance where a reversal may occur.
The H4 timeframe shows price pulling back towards major level 1.2400, in line with weekly support and 50% fibonacci retracement.
Areas of consideration:
- The weekly and daily time frame shows the price testing key resistance area.
- On H4, price is pulling back towards 1.2400.
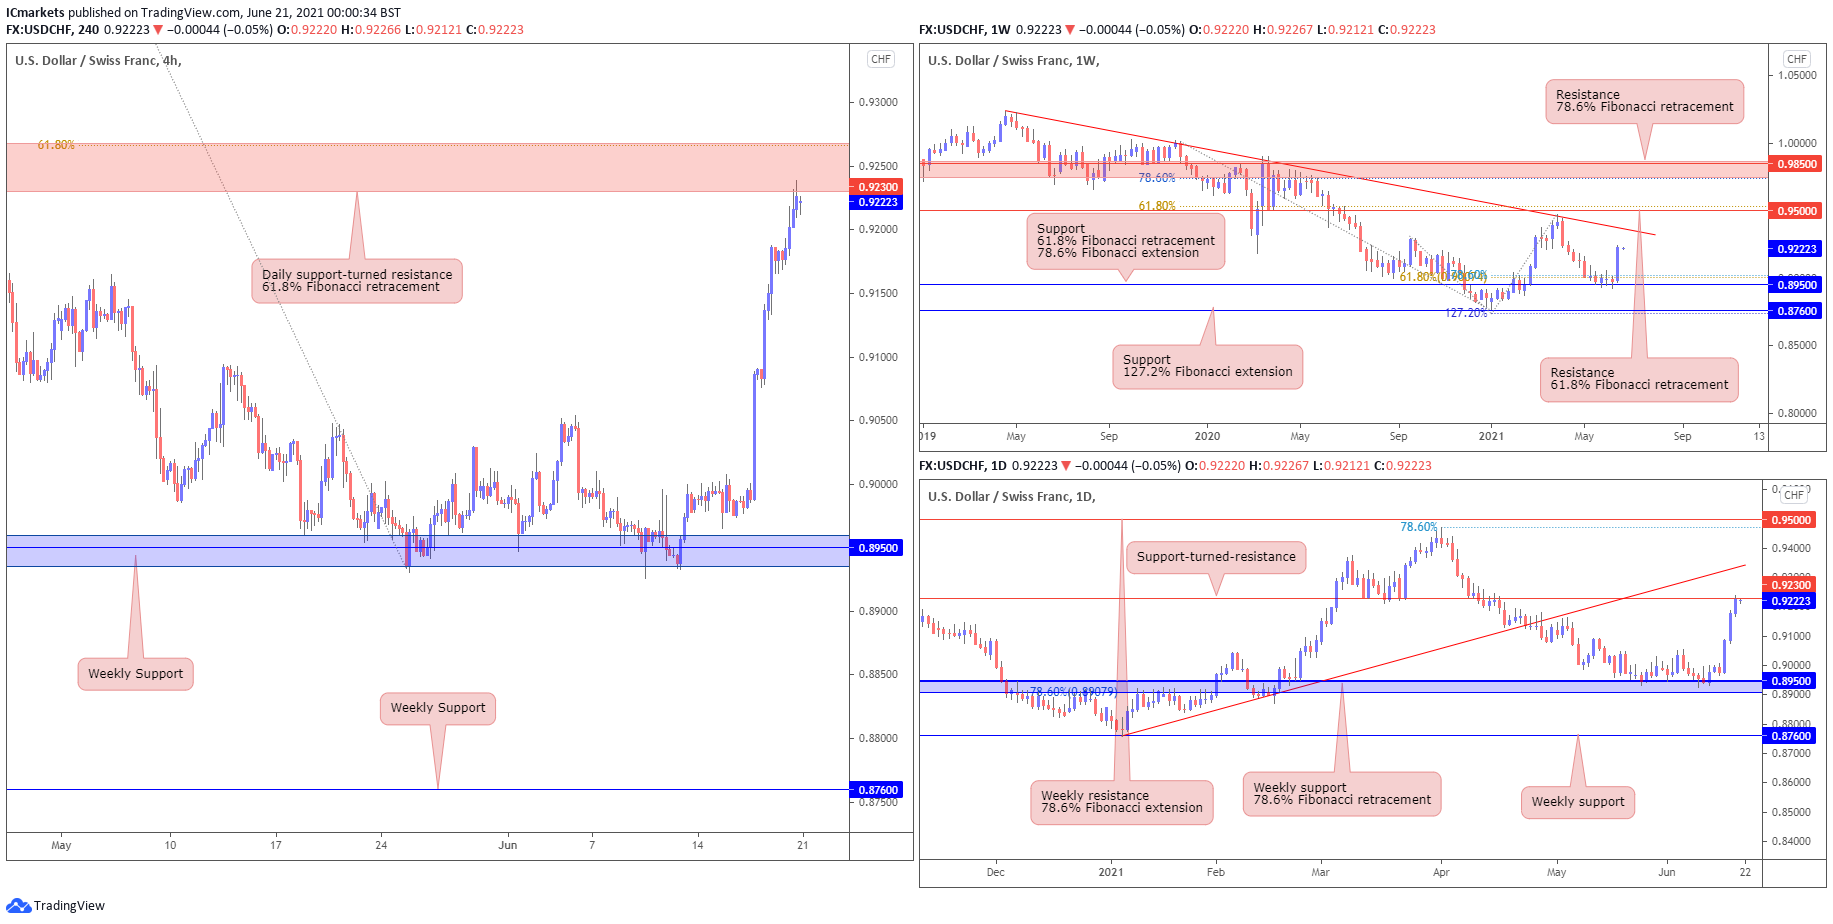
USD/CHF:
USD/CHF has shown a strong bounce from the weekly 0.89500 support, in line with 61.8% Fibonacci retracement and 78.6% Fibonacci extension. The daily chart shows that price is now approaching the key daily 0.92300 support-turned-resistance and ascending trendline support-turned-resistance. We could see a reversal at 0.92300 resistance.
On the H4 chart, we can see that price has shown a strong bounce from the key weekly 0.89500 support level, in line with 61.8% and 127.2% Fibonacci extension, and has pushed much higher to retest the 0.92300 resistance level. The 0.92300 weekly resistance is a key level to watch, in line with our 61.8% Fibonacci retracement. We could see a reversal from the weekly 0.92300 resistance level. However, should price break and close above this level, we could see price push higher to retest the next weekly resistances.
Areas of consideration:
- The 0.92300 resistance is a key intraday level to watch.
- We could see a reversal at the key weekly 0.92300 resistance level.
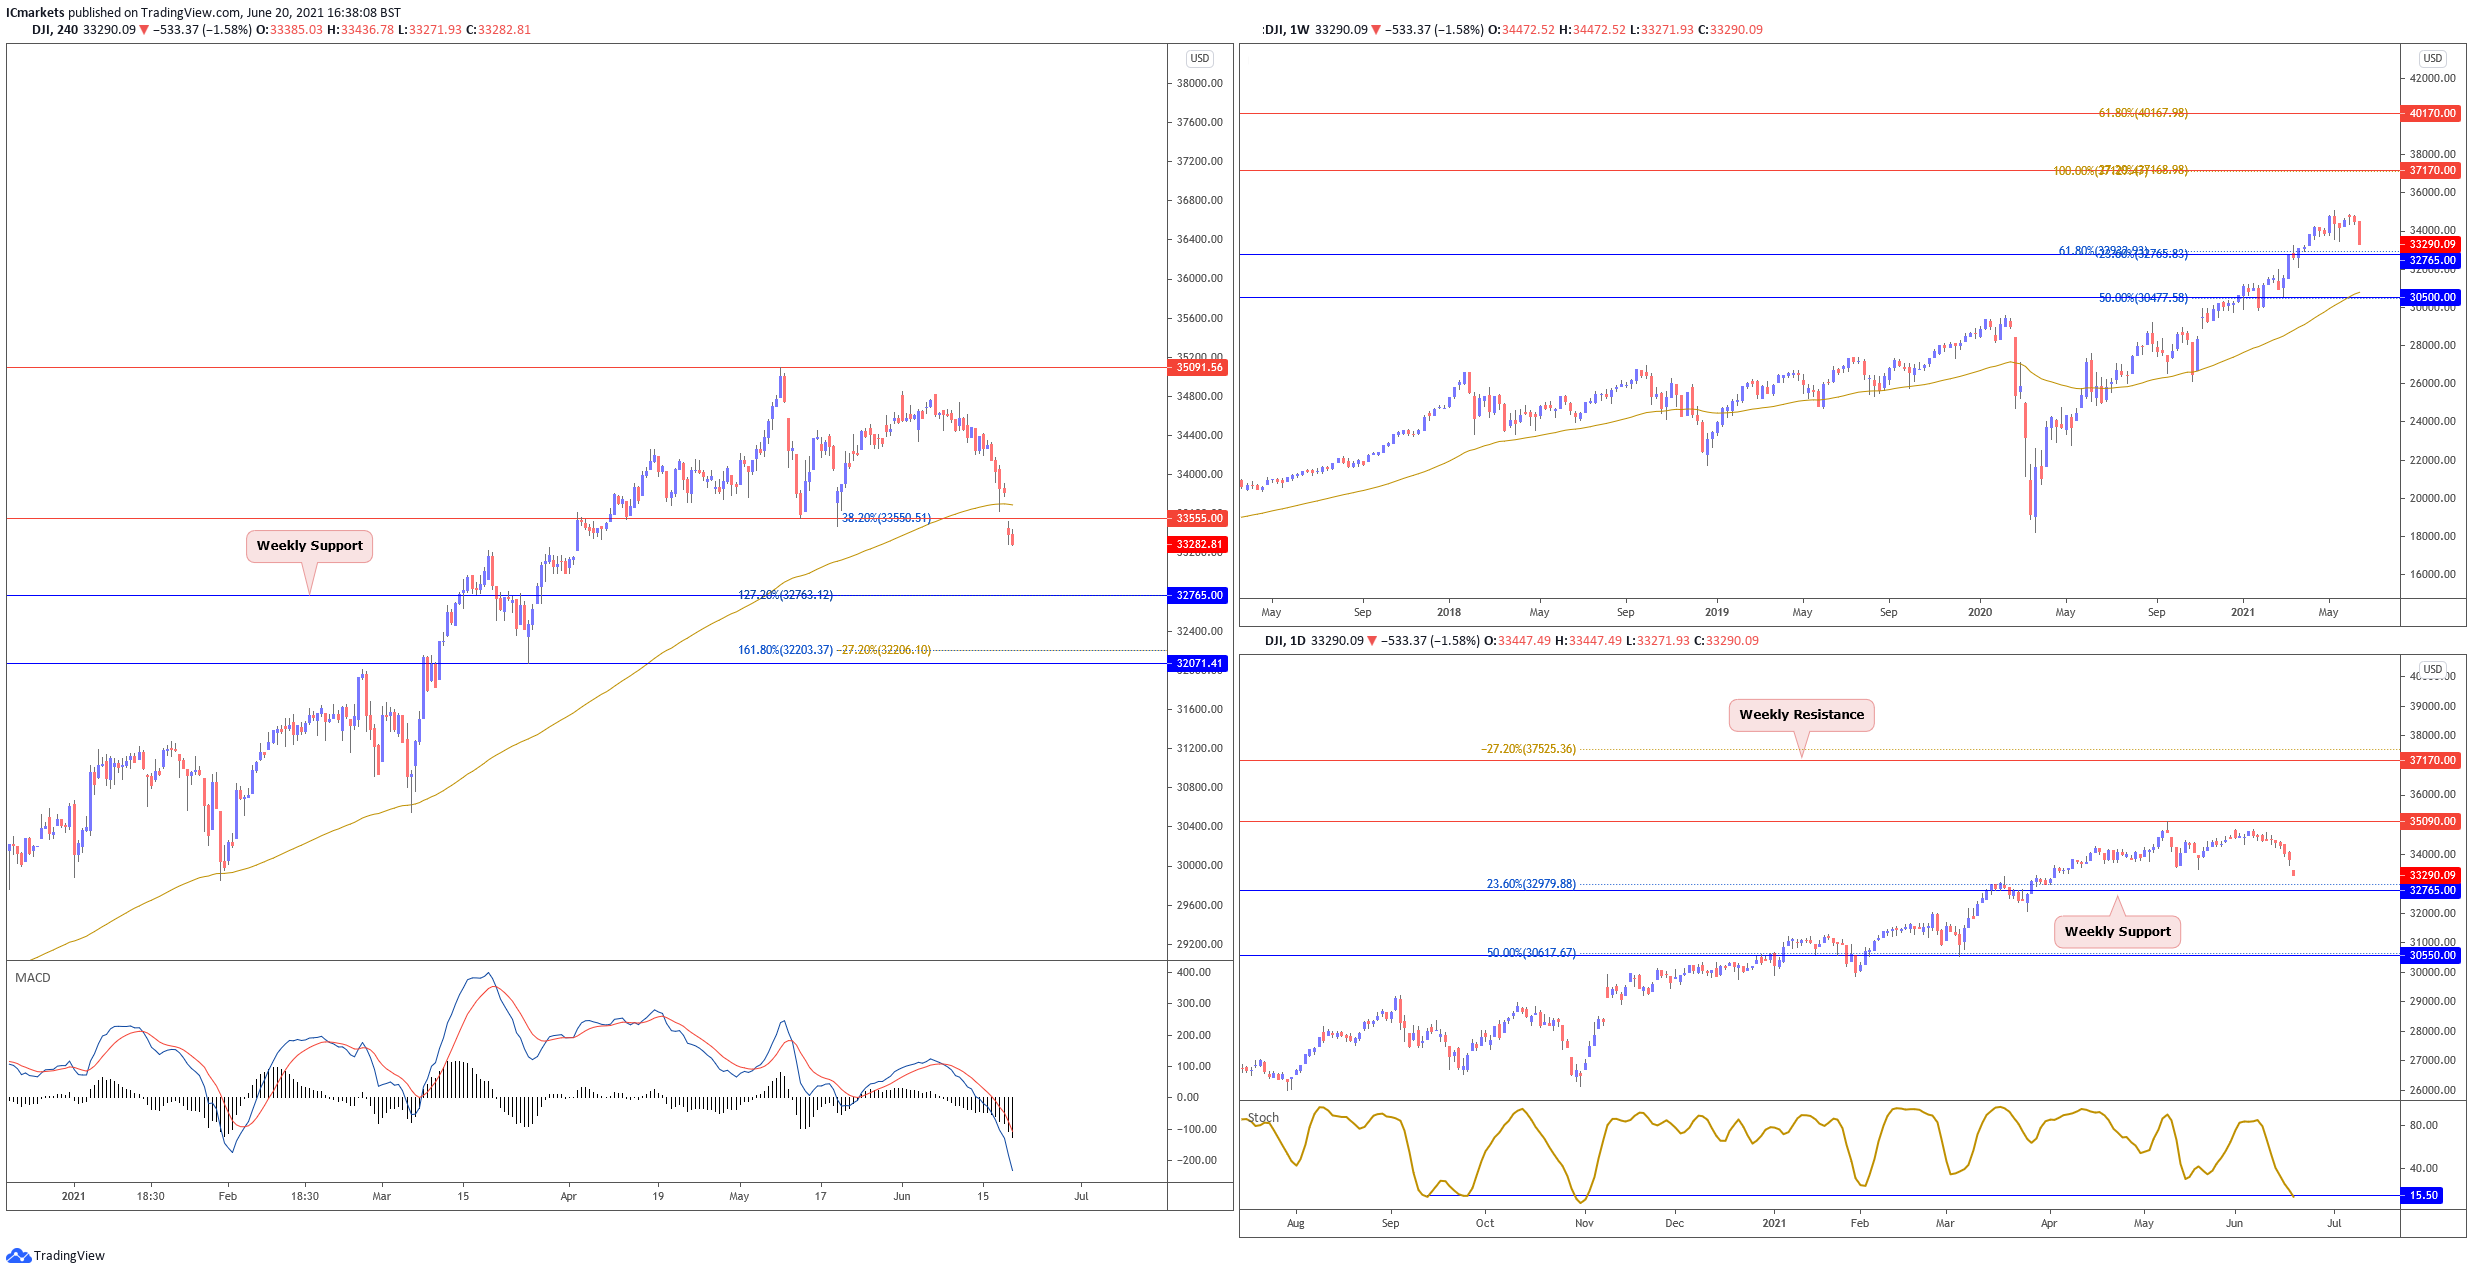
Dow Jones Industrial Average:
On the weekly chart, price traded lower, spooked by inflation fears and the Federal Reserve looking to raise interest rates as early as 2023. With price approaching 32765 support, we might see bullish pressure above this level. On the daily chart, price dipped lower testing weekly support at 32765. Buyers may look to add their longs to push price higher towards possible target at 35090 resistance. Stochastic is testing support as well where price bounced in the past.
On the H4, price gapped lower and technical indicators on the short term are showing room for further bearish downside. As long as price is holding below 33555 resistance, it will continue to see bearish pressure with 32765 weekly support as a possible downside target. Otherwise, failure to hold below 33555 resistance will see price swing towards recent swing high at 35090 resistance.
Areas of consideration:
- Watch support at 33555 support on H4 closely
- Weekly key level at 32765 support is of key interest
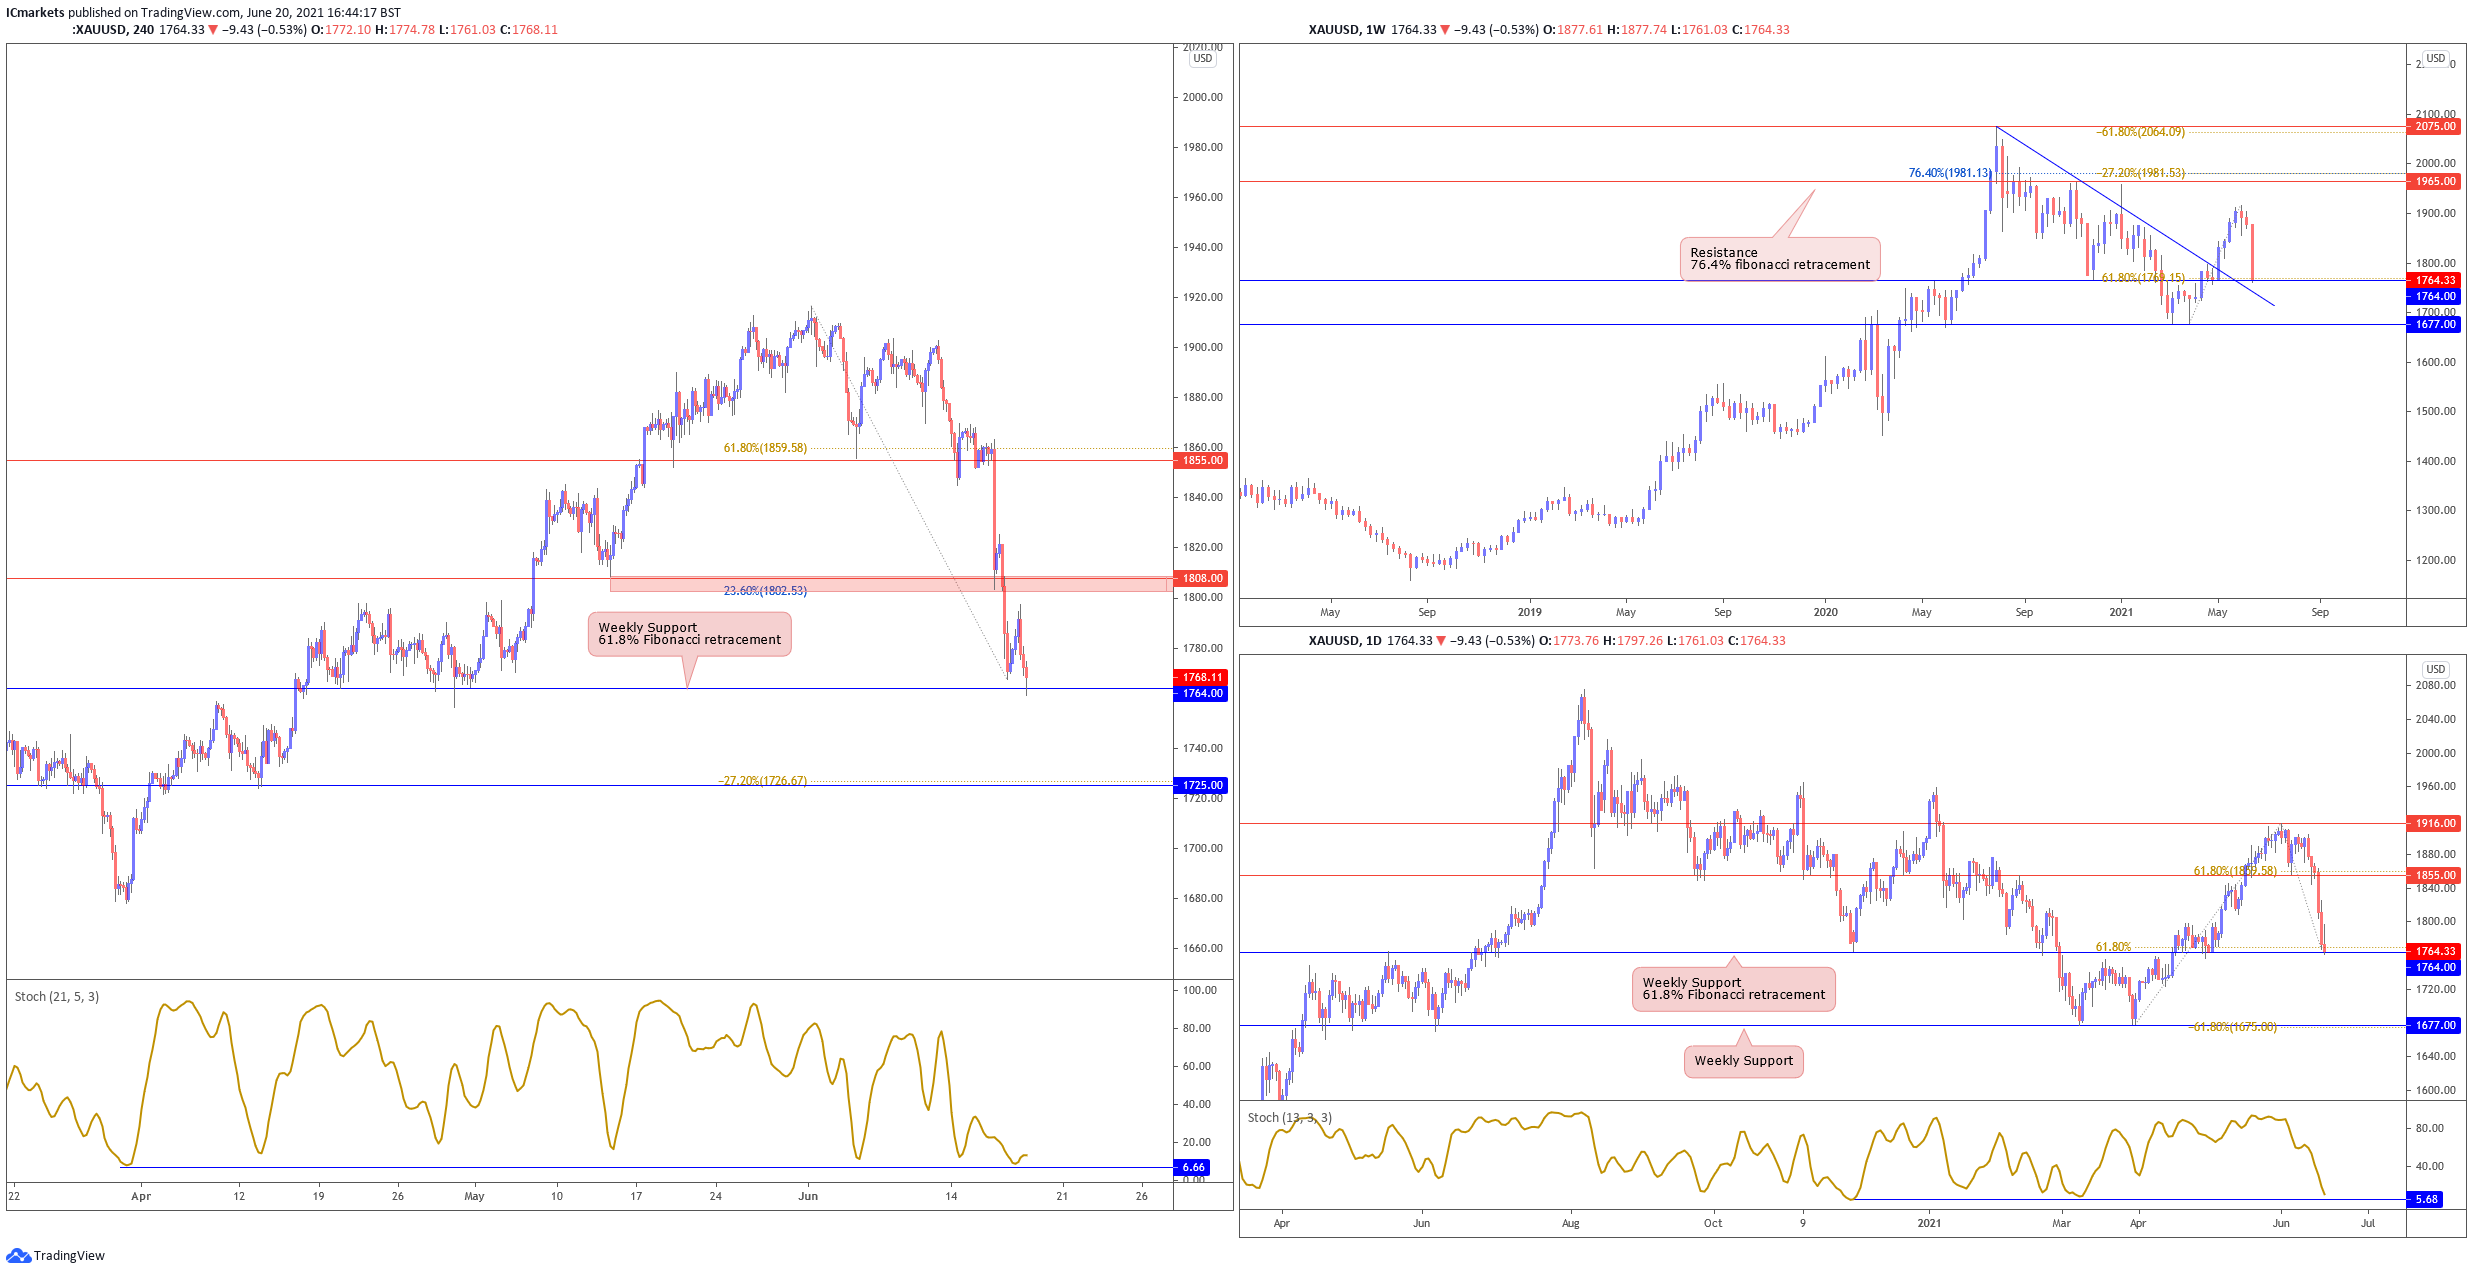
XAU/USD (GOLD):
On the weekly timeframe, pulled back lower and is testing key trendline pullback support at 1764. On the daily, price pulled back lower, and is testing 1764 weekly support. While 1764 support looks fragile, as long as we do not have a daily close below this support, we may see price bounce towards 1855 resistance. Otherwise, breaking below 1764 support, price could drop lower towards 1677 support next.
On the H4, price dropped lower and broke below previous supports. Price is now testing weekly support at 1764. With stochastics approaching support where price bounced in the past as well, we see a low probability bullish scenario where buyers may look to add to their longs with a possible upside target at 1808 resistance. Otherwise, failure to hold above 1764 support could see price swing towards the next support at 1725.
Areas of consideration:
- 1764 support is the key level to watch.
The accuracy, completeness and timeliness of the information contained on this site cannot be guaranteed. IC Markets does not warranty, guarantee or make any representations, or assume any liability regarding financial results based on the use of the information in the site.
News, views, opinions, recommendations and other information obtained from sources outside of www.icmarkets.com.au, used in this site are believed to be reliable, but we cannot guarantee their accuracy or completeness. All such information is subject to change at any time without notice. IC Markets assumes no responsibility for the content of any linked site.
The fact that such links may exist does not indicate approval or endorsement of any material contained on any linked site. IC Markets is not liable for any harm caused by the transmission, through accessing the services or information on this site, of a computer virus, or other computer code or programming device that might be used to access, delete, damage, disable, disrupt or otherwise impede in any manner, the operation of the site or of any user’s software, hardware, data or property.


