
A note on lower timeframe confirming price action…
Waiting for lower timeframe confirmation is our main tool to confirm strength within higher timeframe zones, and has really been the key to our trading success. It takes a little time to understand the subtle nuances, however, as each trade is never the same, but once you master the rhythm so to speak, you will be saved from countless unnecessary losing trades. The following is a list of what we look for:
- A break/retest of supply or demand dependent on which way you’re trading.
- A trendline break/retest.
- Buying/selling tails/wicks – essentially we look for a cluster of very obvious spikes off of lower timeframe support and resistance levels within the higher timeframe zone.
- Candlestick patterns. We tend to stick with pin bars and engulfing bars as these have proven to be the most effective.
We search for lower timeframe confirmation between the M15 and H1 timeframes, since most of our higher-timeframe areas begin with the H4. Stops are usually placed 5-10 pips beyond confirming structures.
EUR/USD:
Weekly gain/loss: – 270 pips
Weekly closing price: 1.0583
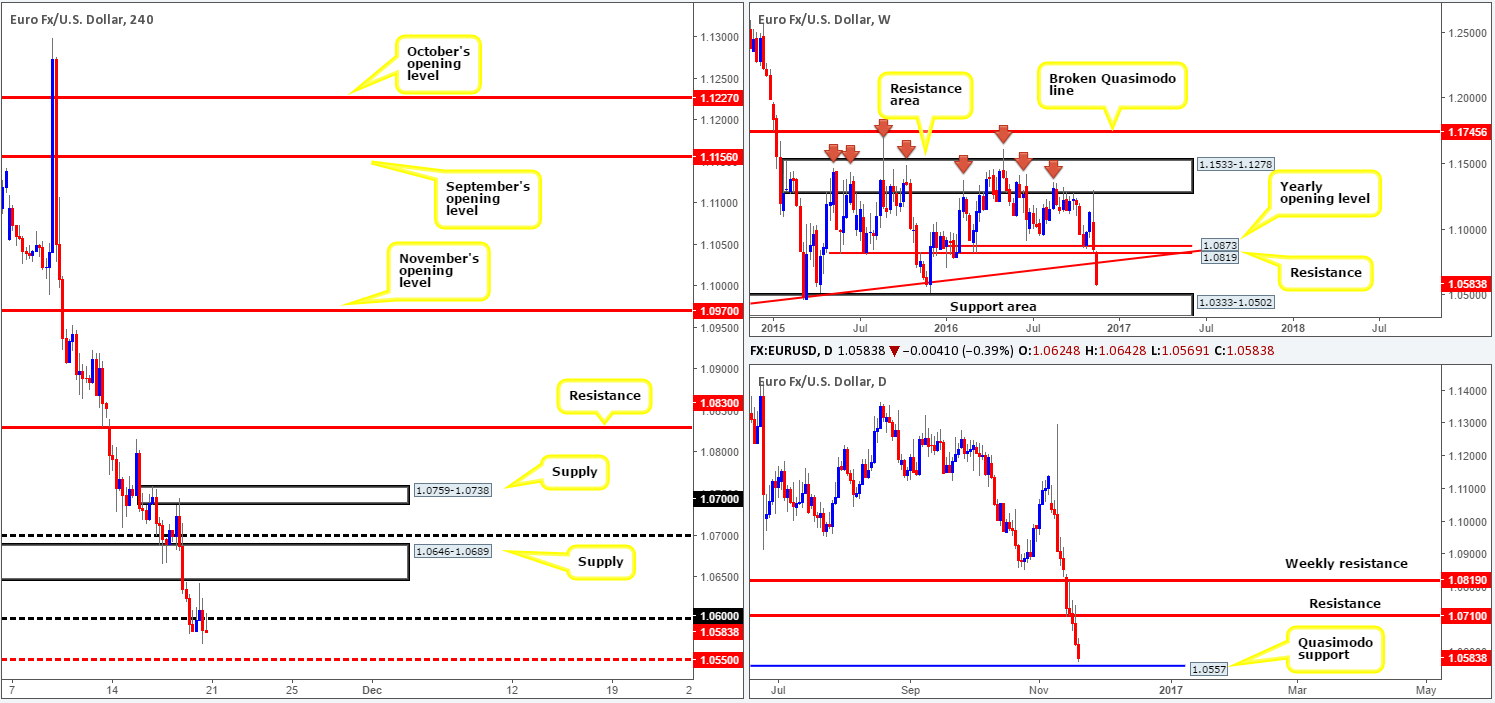
Weekly view: The shared currency sustained further losses last week, consequently breaking through the yearly opening level at 1.0873, a support at 1.0819 as well as a trendline support extended from the low 0.8231. The next downside target from this point comes in at 1.0333-1.0502: a support area that stretches as far back as 1997!
Daily view: Thanks to the recent bout of selling, the daily candles are, at present, trading within shouting distance of a Quasimodo support level drawn from 1.0557. While this level is interesting, there’s a far more appealing Quasimodo support seen directly below it at 1.0494, as this hurdle is sited around the top edge of the above said weekly support area.
H4 view: A quick recap of Friday’s action on the H4 chart shows that the candlesticks skimmed the edge of a supply zone seen at 1.0646-1.0689 going into London lunchtime, and went on to settle for the week closing below and retesting the 1.06 hurdle as resistance. The next support on tap falls in at 1.0550, a mid-way level which sits 7 pips below the daily Quasimodo support mentioned above at 1.0557.
Direction for the week: Further selling is probable until the pair crosses swords with the top edge of the weekly support area at 1.0333-1.0502. In light of its historical significance, dollar bulls may look take a breather here.
Direction for today: The upside rejection seen off 1.06 could possibly spark a selloff today down to at least 1.0550, given that bids around Friday’s intraday morning low 1.0581 were likely consumed prior to 1.06 being tested.
Our suggestions: While the path south may very well be clear down to 1.0550 on the H4 chart, selling right now is difficult considering how close by the daily Quasimodo support at 1.0557 is located. What really grabs our interest, as we mentioned above in the daily section, is the Quasimodo support seen directly below it at 1.0494. Not only has this level fused a connection with the top edge of the weekly support area, but it sits six pips below the psychological band 1.05! This confluence is, at least in our book of technical setups, enough to condone a pending buy order at 1.0495 with a stop placed below the head of the daily Quasimodo formation at 1.0459.
Granted, this does mean buying into the current downside flow brought on by the possibility of a rate hike in December. However, we’re not looking for a full-blown reversal here, simply a well-planned bounce back up to the 1.0557 region as an immediate take-profit zone.
Data points to consider: ECB President Mario Draghi speaks at 4pm GMT.
Levels to watch/live orders:
- Buys: 1.0495 ([pending order] stop loss: 1.0459).
- Sells: Flat (stop loss: N/A).
GBP/USD:
Weekly gain/loss: – 252 pips
Weekly closing price: 1.2343
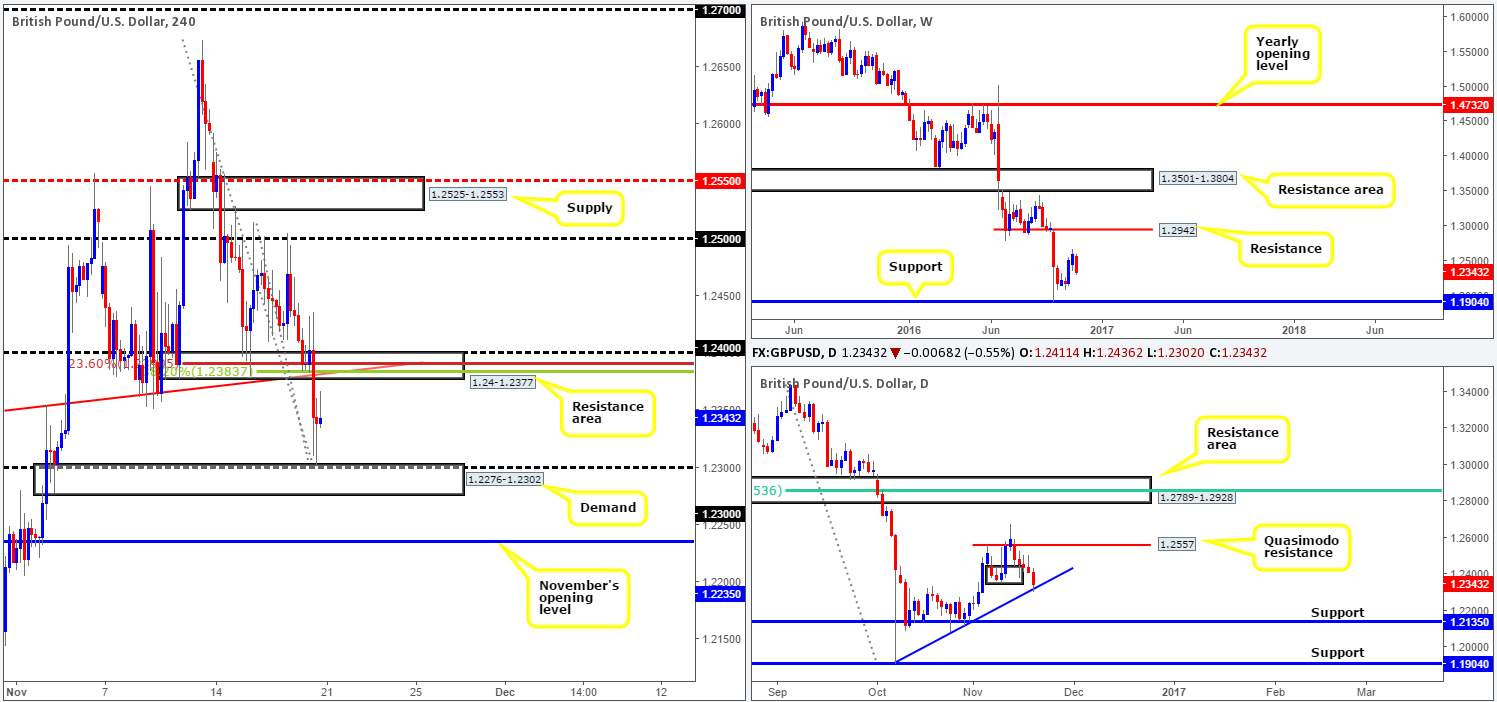
Weekly view: Following two consecutive weeks of gains, last week’s flow turned sour in favor of US-dollar strength. Erasing the prior week’s gains, coupled with establishing a near-full-bodied bearish candle into the close, this may encourage further selling this week. This, however, does not steer away from the fact that cable is still considered to be trading mid-range between resistance penciled in at 1.2942 and support carved from 1.1904.
Daily view: As can be seen from the daily viewpoint, demand at 1.2351-1.2440 finally gave way on Friday, with price swiftly finding a pocket of bids off the trendline support stretched from the low 1.1904. Providing that the bulls defend this barrier this week, we may see price grind north to test a Quasimodo resistance seen at 1.2557. A sustained move below the trendline support on the other hand, would likely place support at 1.2135 on the hit list.
H4 view: A brief look at recent dealings on the H4 chart shows that price recently struck the demand base seen at 1.2276-1.2302 to-the-pip, and remained stable going into the week’s close. Not only is this base supported by the 1.23 handle, but it’s also strengthened by the aforementioned daily trendline support.
To the upside, the H4 resistance area at 1.24-1.2377 is also worthy of note. While it has little connection with the higher-timeframes, it does boast a H4 Fibonacci cluster resistance (23.6%/38.2%) taken from highs of 1.2673/1.2514 at 1.2387/1.2391, a trendline resistance penciled in from the high 1.2332 and, of course, the psychological hurdle 1.24.
Direction for the week: This is a little tricky since daily trendline support points out that we may see the bulls take control, while on the weekly chart, last week’s close could encourage further selling. Therefore, we feel medium-term direction is limited for the time being at least until the market makes a decision around the daily trendline support.
Direction for today: With the economic calendar fairly light today, and both the H4 demand at 1.2276-1.2302 and H4 resistance area at 1.24-1.2377 equally interesting (as explained above), we really do not see price breaching these walls today.
Our suggestions: Trading either of the above said H4 barriers today is certainly a viable approach, in our book. It would, of course, be down to the individual trader to decide if he/she enters using a pending order, or takes the conservative route and waits for lower timeframe confirming action prior to pulling the trigger. Our desk favors the latter. See the top of this report for ideas on how to use lower timeframe structure to enter at higher-timeframe zones.
Levels to watch/live orders:
- Buys: 1.2276-1.2302 ([lower timeframe confirmation required before entry is permitted] stop loss: dependent on where one confirms this area).
- Sells: 1.24-1.2377 ([lower timeframe confirmation required before entry is permitted] stop loss: dependent on where one confirms this area).
AUD/USD:
Weekly gain/loss: – 208 pips
Weekly closing price: 0.7331
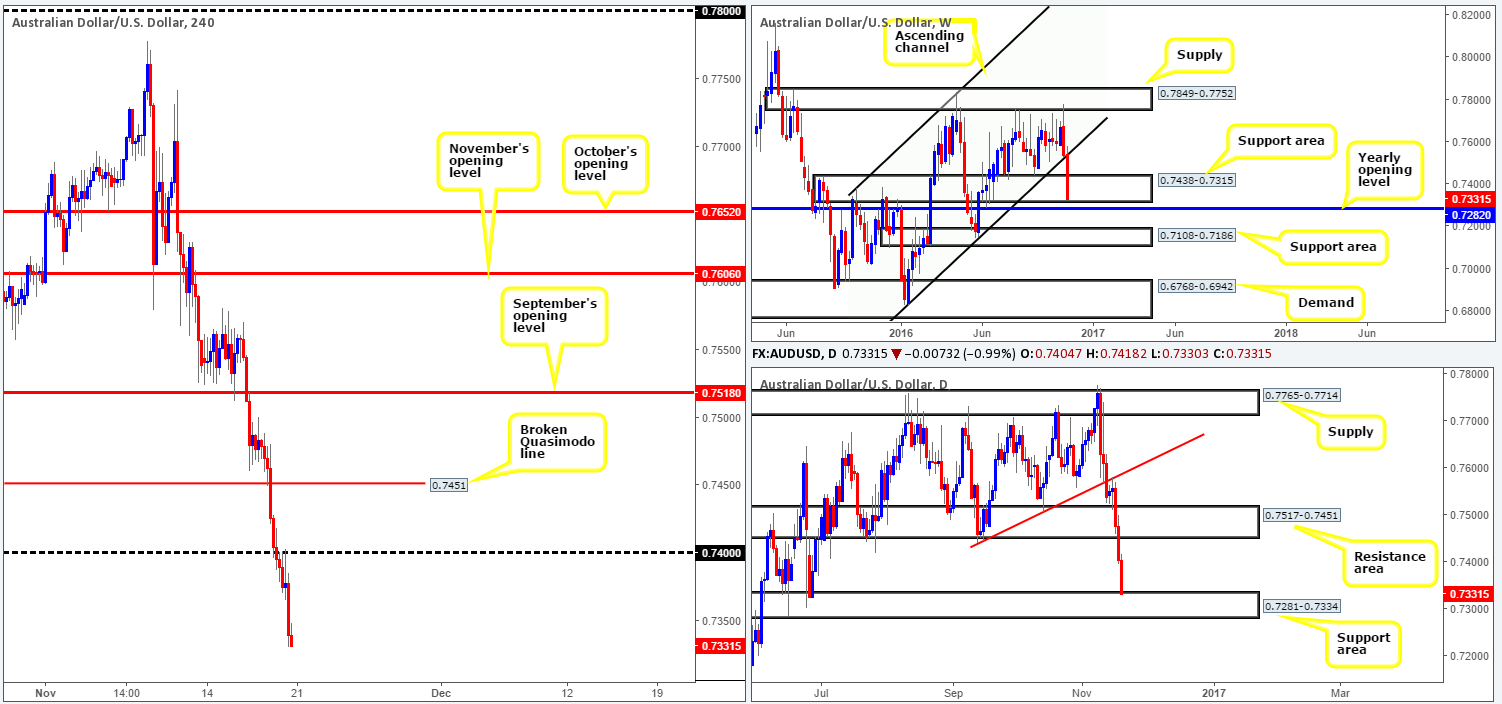
Weekly view: Recent weekly action shows that the AUD/USD extended its downward decline from supply at 0.7849-0.7752, resulting in price violating a channel support line extended from the low 0.6827 and diving deep into the jaws of a support area coming in at 0.7438-0.7315. As much as this area stretches back to mid-Aug 2015, there’s a chance, given last week’s full-bodied bearish close, that we may see a fake lower to tag in bids around the nearby yearly opening level at 0.7282 this week.
Daily view: From Wednesday onwards last week we saw the Aussie take an absolute thrashing. The support area at 0.7517-0.7451 (now acting resistance) was taken out during the bearish assault, permitting the commodity currency to cross paths with a support area at 0.7281-0.7334 (the above said yearly opening level is seen housed within the lower extremes of this zone) by the week’s end.
H4 view: For those who read Friday’s report you may recall our desk mentioning to watch for a close beyond the 0.74 boundary. We also highlighted that in order to trade below this number, a retest to the underside of this level alongside a reasonably sized H4 bearish close would be required. As you can clearly see, this came to realization going into the early hours of Friday’s US session. Unfortunately we missed this move entirely. Well done to any of our readers who managed to net some green pips here, as we personally see little active H4 demand to the left of current price stopping the pair from reaching the 0.73 hurdle.
Direction for the week: Taking into account that daily action has just stepped foot into a support area at 0.7281-0.7334, and weekly price is lurking within the lower depths of a support zone at 0.7438-0.7315 as well as nearby a yearly opening level at 0.7282, a rotation to the upside may be on the cards sometime this week.
Direction for today: Our expectations for price action today, given the lack of active H4 demand seen to the left, is for the Aussie to simply strike 0.73.
Our suggestions: The 0.73 handle – coupled with the yearly opening level at 0.7282, in our estimation, provides enough confluence to consider trading long. Be that as it may, this is a rather small area and is potentially liable to being faked out. Therefore, we would strongly recommend waiting for a reasonably sized H4 bullish candle to form here before pressing the buy button.
Levels to watch/live orders:
- Buys: 0.7282/0.73 ([a reasonably sized H4 bullish close is required prior to pulling the trigger here] stop loss: ideally beyond the trigger candle).
- Sells: Flat (stop loss: N/A).
USD/JPY:
Weekly gain/loss: + 426 pips
Weekly closing price: 110.85
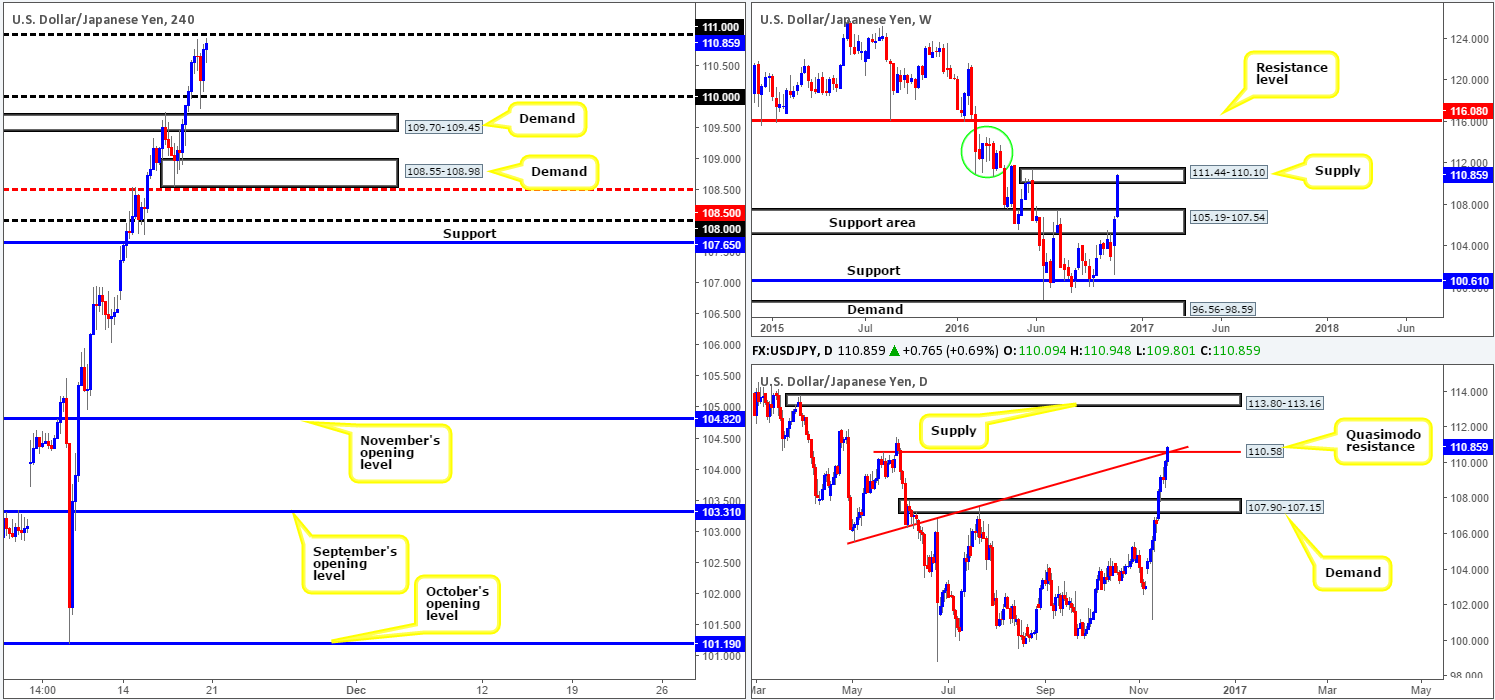
Weekly view: The US dollar continued to soar last week following the prior week’s engulfing candle, pressuring the unit to chomp through offers at a resistance area drawn from 105.19-107.54 (now acting support), with price ending the session colliding with supply coming in at 111.44-110.10. Upbeat US data, rising yields and prospects of a potential rate hike in December all contributed to last week’s follow-through buying. Assuming that the bulls remain dominant this week, the current supply may very well be consumed. Nevertheless, it’s certainly not plain sailing after that, as there’s a lot of wood seen to chop through between the 114.87/111.44 area (green circle) before touching gloves with resistance penciled in at 116.08.
Daily view: Things are not looking too bright for the current weekly supply! The daily Quasimodo line at 110.58 was engulfed going into the week’s close, and assuming that the bulls defend this line as support this week, we may see the couple head towards supply carved from 113.80-113.16. Nevertheless, our desk has also noted that they will only consider the current Quasimodo resistance invalidated once a daily close is seen above the apex of this formation at 111.44, which is actually the top edge of the weekly supply!
H4 view: (Trade update: Stopped out at 110.85 – please see Friday’s report for details).
The USD/JPY beautifully retested the 110 handle mid-way through Friday’s session, which, as you can see, propelled the candlesticks to highs of 110.94, six pips ahead of the 111 handle. A decisive close above this boundary could set the stage for a continuation move north up to the 112 region and, by extension, further corroborate our thinking regarding a possible drive towards the daily supply mentioned above at 113.80-113.16.
Direction for the week: A pullback may be on the cards this week according to the weekly and daily structures. However, in view of the near-full-bodied weekly bullish candle, this may be interpreted as strength and therefore further buying may take place.
Direction for today: The 111 handle is key today. An upside rejection from this barrier could pressure the daily candles to close back below the Quasimodo resistance. To the flipside, a sustained move above 111 likely portends, as we explained above, a move up to 112 may be on the cards.
Our suggestions: A solid rejection from 111 could, in light of the higher-timeframe structures in place, be sufficient enough to permit a short down to 110. A close above 111, however, followed by a retest and a H4 bullish close would, at least in our view, be enough to take on a long position, targeting the 112 handle and possibly even the 113 barrier given this is planted just below the aforementioned daily supply.
Levels to watch/live orders:
- Buys: Watch for a close above the 111 handle and then look to trade any retest seen thereafter (waiting for a H4 bullish close to form following the retest is preferable prior to pulling the trigger – stop loss: ideally beyond the trigger candle).
- Sells: 111 handle ([watch for a solid rejection off this number before considering shorts] stop loss: ideally beyond the rejection candle[s]).
USD/CAD:
Weekly gain/loss: – 39 pips
Weekly closing price: 1.3496
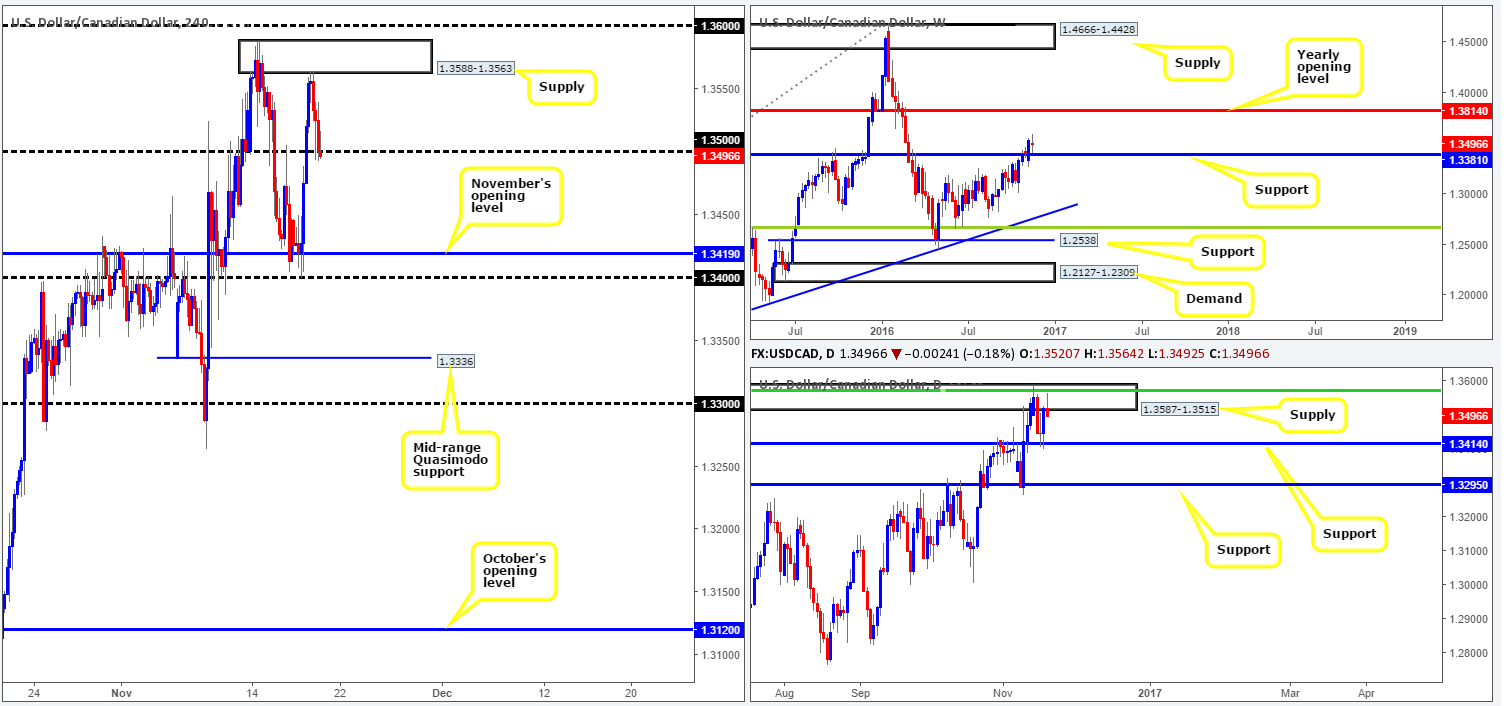
Weekly view: The recent break above resistance at 1.3381 was (and still is) considered, at least by our desk, to be a bullish cue with the next upside target fixed at 1.3814: a yearly opening level. Though, last week’s action proved to be relatively stagnant, consequently forming a clear-cut indecision candle in the process. In the event that the bulls notch it up a gear this week, the yearly opening level could still be brought into the picture.
Daily view: Before the weekly bulls can change gear, however, a daily supply zone formed at 1.3587-1.3515 (fuses with a 50.0% Fib resistance at 1.3570) must be engulfed. Now, assuming that this area is taken out, we may see the pair attempt to reach 1.3859-1.3765: a daily supply area that fuses with the daily 61.8% Fib resistance at 1.3832 and also encapsulates the above noted yearly opening level.
H4 view: Going into the early hours of Friday morning, the pair found a pocket of offers around the footing of a supply zone at 1.3588-1.3563. The response from this barrier, as you can see, was bearish and saw price breach and eventually close below the 1.35 handle by the week’s end. The next downside target from this angle can be seen at November’s opening level 1.3419/the 1.34 handle.
Direction for the week: Our desk maintains a bearish bias in this market until the daily supply zone at 1.3587-1.3515 is consumed. The daily support at 1.3414 is, according to higher-timeframe structure, the next target support on hand.
Direction for today: Friday’s late close beyond 1.35 could potentially indicate further downside today to November’s opening level 1.3419/1.34 handle, which happens to encapsulate the above noted daily support. This move would also be bolstered by the current daily supply zone.
Our suggestions: While a move down to the 1.34 region is a reasonable possibility, let’s not forget the weekly chart’s recent break above resistance! Before entering short below 1.35, we’d want to see further evidence of resistance forming at 1.35. For example, another H4 bearish selling wick or a bearish engulfing candle etc… Should this not come into view, we’ll pass. To become buyers on the other hand, we’d require at least a H4 close above the 1.36 boundary, since buying into daily supply is not something we would feel comfortable participating in. In the event that 1.36 is eventually taken out and retested as support, we would look to take a long position with an ultimate take-profit target set at the aforementioned yearly opening level.
Levels to watch/live orders:
- Buys: To become buyers, a close above and retest of the 1.36 boundary is needed.
- Sells: 1.35 handle ([a reasonable H4 bearish close required prior to pulling the trigger] stop loss: ideally beyond the trigger candle).
USD/CHF:
Weekly gain/loss: + 227 pips
Weekly closing price: 1.0098
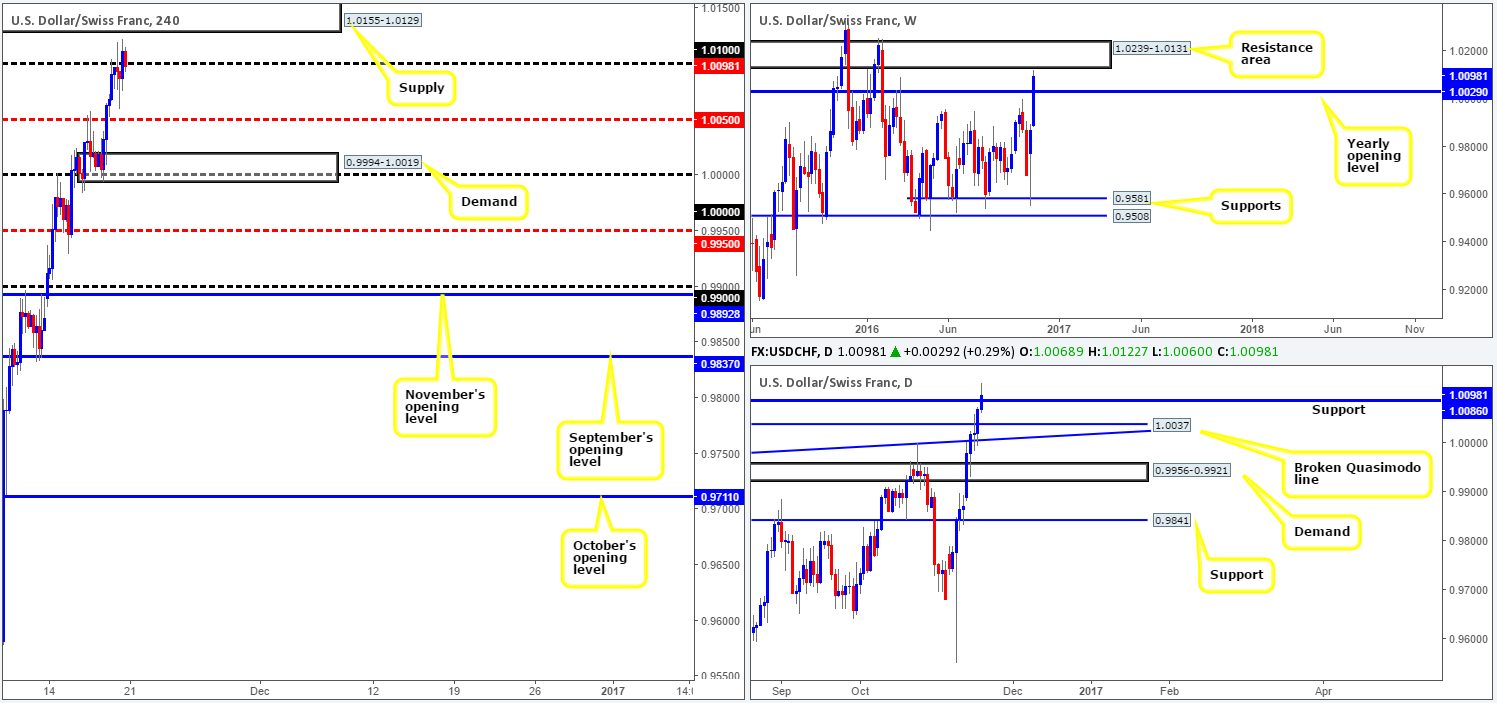
Weekly view: The USD/CHF pair had a spectacular week. The Swissy came within a cat’s whisker of touching gloves with a resistance area at 1.0239-1.0131, following a healthy extension of the previous week’s bounce from support at 0.9581 that managed to take out the yearly opening level at 1.0004.
Daily view: From this viewpoint, the week concluded with Friday’s candle printing a half-hearted close above resistance coming in at 1.0086. This could, should the bulls guard this level as support this week, make way for a move up to a daily Quasimodo resistance line drawn from 1.0198 that’s firmly positioned within the above noted weekly resistance area.
H4 view: Despite Friday’s daily candle closing in the green, we can see from this angle that the bulls had difficulty with the 1.01 handle early on in Asia and again going into London. As US traders entered the fray, however, the unit managed to chalk up a H4 bullish close above 1.01 and come within a an inch of striking the underside of a H4 supply zone at 1.0155-1.0129, before weakening and closing the day marginally below 1.01.
Direction for the week: This is a tricky one. On the one hand, the daily bulls could take it upon themselves to push the pair up to the daily timeframe’s next upside target: the Quasimodo resistance at 1.0198. Or, on the other side of the field, enough offers could already be filled as price came so very close to touching the weekly resistance area, which may send the market back down to the yearly opening level.
Direction for today: The supply at 1.0155-1.0129 will be a key zone to keep an eye on today we believe. In the event price maintains a bearish stance below this area, we feel the weekly bears may end up taking the show and pushing price to the H4 mid-way support 1.0050, and eventually H4 demand at 0.9994-1.0019 which houses parity (1.00). A H4 close above the aforementioned H4 supply, nonetheless, like portends further buying up to the above said daily Quasimodo resistance level.
Our suggestions: To become sellers in this market, we would not only like to see 1.01 maintain a bearish defense, but also we’d require a H4 close below the current daily support. This would, along with the recent near-touch of the weekly resistance area, likely be enough to force the pair lower to at least the 1.0050 level.
A close above the aforementioned H4 supply is not a signal to buy, in our opinion, given how close the daily Quasimodo resistance is (1.0198). 1.0198 is, however, a fantastic place to be looking to short from considering its position within the weekly resistance area!
Levels to watch/live orders:
- Buys: Flat (stop loss: N/A).
- Sells: 1.0198 ([a level strong enough to permit a pending order] stop loss: 1.0230).
DOW 30:
Weekly gain/loss: + 33 points
Weekly closing price: 18874
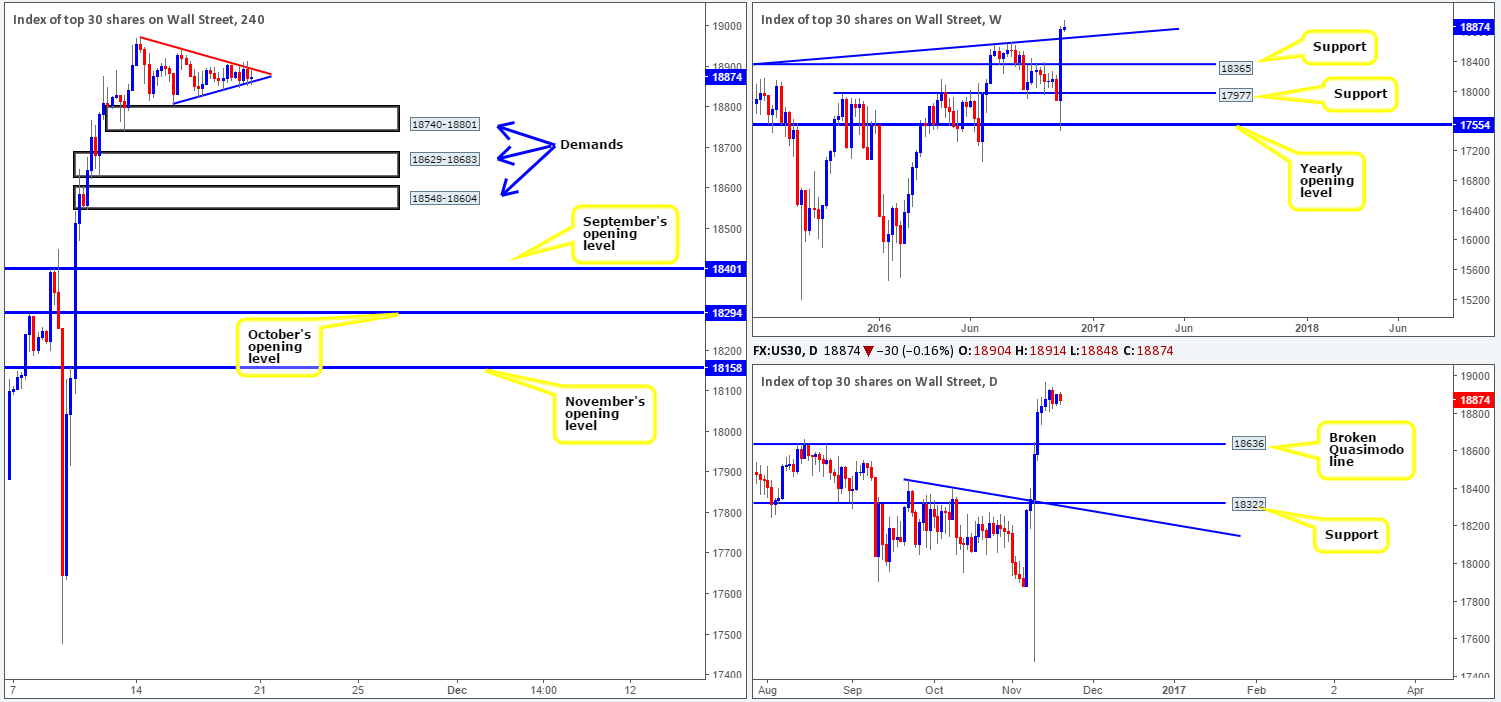
Weekly view: In comparison to the prior week’s humongous rally, equities were relatively quiet all last week. In that the recently closed weekly candle printed a bearish selling wick, the trendline support extended from the high 18365 may very well be retested this week.
Daily view: Technically speaking, there’s very little difference between the weekly and daily chart. Perhaps the most compelling factor is that should price pullback this week, the next downside target on this scale falls in at 18636: a broken Quasimodo line.
H4 view: Since the beginning of last week, the US equity market has been compressing between two converging H4 trendlines (18971/18808), forming a possible bullish pennant formation. This technical pattern is considered by most to be a continuation setup. Therefore, should a close above the top edge of the pennant take place followed up with a retest as support, we would consider jumping in long this market, mainly due to the room seen to move higher on the bigger picture.
However, a break below the above said bullish pennant is not necessarily considered a bearish cue, in our opinion, as we still have three areas of demand positioned below. The first, the lowest of the three, comes in at 18548-18604: a H4 demand which was formed following the break of the daily Quasimodo resistance level at 18636 (the next downside target on the daily timeframe). The second, the middle of the three is seen at 18629-18683: a H4 demand base that intersects beautifully with the weekly trendline support extended from the high 18365 (the next downside target on the weekly timeframe). The third area drawn from 18740-18801, which is also a H4 demand barrier unfortunately has little higher-timeframe significance so is, in our book, liable to be faked should price test this area.
Direction for the week: Although a pullback is a possibility, the overall tone remains biased to the upside, given the lack of clear resistance ahead.
Our suggestions and direction for the day: Put simply, we have to be patient here and wait for the H4 candles to make a decision within the two uniting trendlines. A break higher followed by a retest would enable us to potentially buy the index as stated above in bold. On the other side of the coin, a break lower could open up the possibility for long trades from either one of the above said H4 demands also highlighted in bold.
Levels to watch/live orders:
- Buys: Watch for a close above the H4 trendline resistance and then look to trade any retest seen thereafter (waiting for a H4 bullish close to form following the retest is preferable prior to pulling the trigger – stop loss: ideally beyond the trigger candle).18740-18801 ([reasonably sized H4 bullish close required prior to pulling the trigger] stop loss: ideally beyond the trigger candle). 18629-18683 ([a possible area to consider entering at market from] stop loss: 18618). 18548-18604 ([a possible area to consider entering at market from] stop loss: 18537).
- Sells: Flat (stop loss: N/A).
GOLD:
Weekly gain/loss: – $19
Weekly closing price: 1207.4
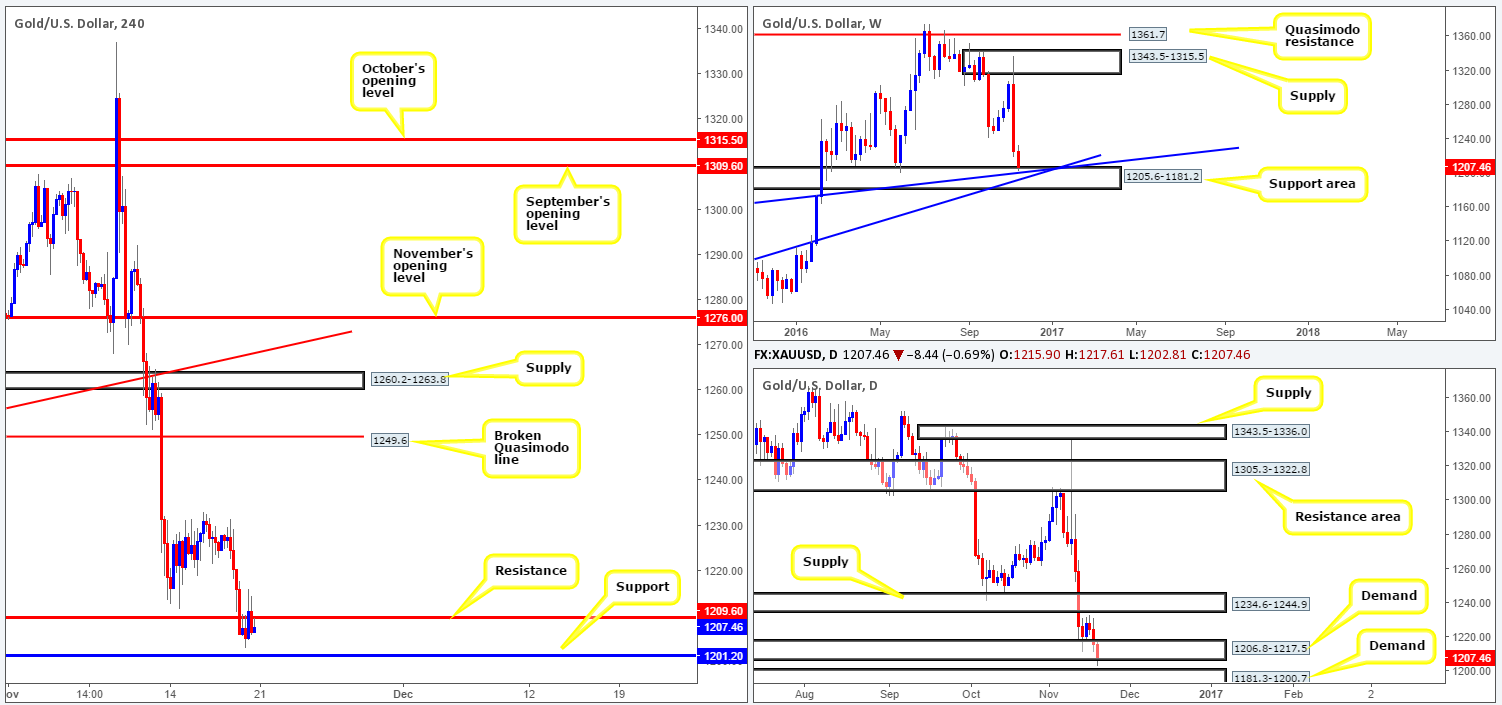
Weekly view: Across the board we saw the US dollar trade higher last week, consequently forcing the yellow metal to shake hands with a support area coming in at 1205.6-1181.2 that converges with two trendline supports 1130.1/1071.2. On account of this confluence and the fact that this zone held beautifully between Feb through to May 2016, price may correct itself from here.
Daily view: Daily demand at 1206.8-1217.5, although the area suffered a breach on Friday, did in fact manage to hold bullion by a smidgen going into the weekly close. This recent breach might open the doors to further selling this week down to demand seen at 1181.3-1200.7, which has been active since Feb 2016.
H4 view: Following an early-morning push below support at 1209.6 on Friday, the bears, despite an earnest attempt from the bulls, managed to close the week out below this level. This, as you can see, places the H4 candles within striking distance of the support level coming in at 1201.2.
Direction for the week: Despite the possibility of a move down to daily demand at 1181.3-1200.7, the overall technical structure of this market favors the bulls at the moment.
Direction for today: 1201.2 is likely going to be tagged during today’s sessions, which has a high-probability of holding firm and sending the metal back up to at least the 1209.6 neighborhood.
Our suggestions: 1201.2 is a nice-looking level for a trade long. Nevertheless, we would not approve setting a pending buy order here. The reason being simply comes down to the chance that we may see this level faked in order to connect with the top edge of the daily demand at 1200.7. With that being the case, we would advise waiting for a H4 bullish close to form prior to buying the metal, with stops placed beyond the trigger candle.
Levels to watch/live orders:
- Buys: 1201.2 ([wait for a reasonably sized H4 bullish close to form prior to pulling the trigger] stop loss: ideally beyond the trigger candle).
- Sells: Flat (stop loss: N/A).


