
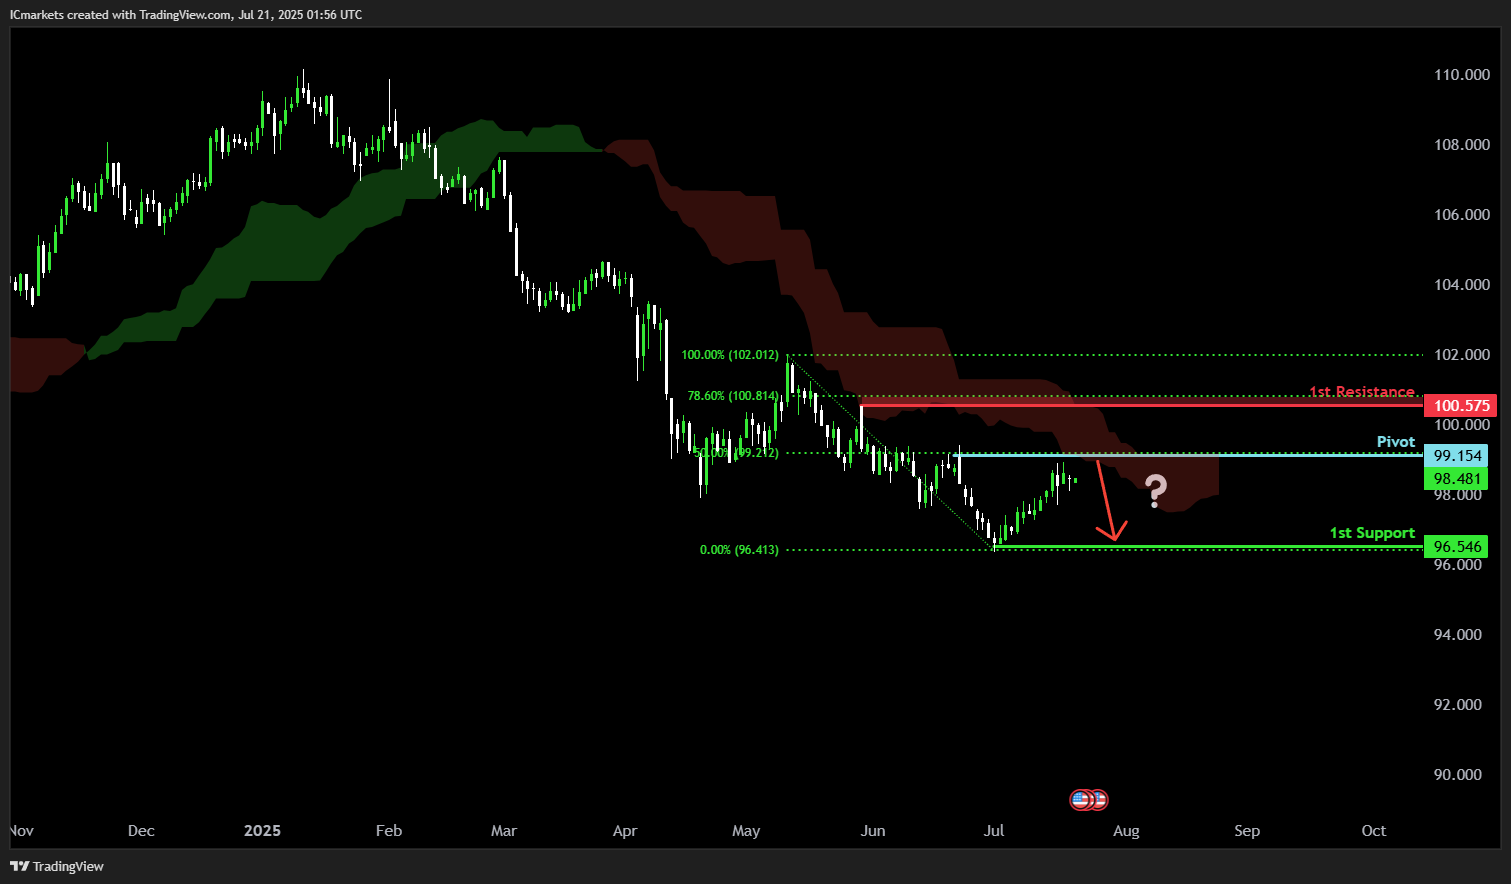
DXY (U.S. Dollar Index):
Potential Direction: Bearish
Overall momentum of the chart: Bearish
The price could make a bearish reversal off the pivot and fall toward the 1st support. Additionally, the price is below the Ichimoku Cloud, which adds further significance to the strength of the bearish momentum.
Pivot: 99.15
Supporting reasons: Identified as a pullback resistance that aligns with the 50% Fibonacci retracement, indicating a potential area where selling pressures could intensify.
1st support: 96.54
Supporting reasons: Identified as an overlap support, indicating a potential area where the price could stabilize once again.
1st resistance: 100.57
Supporting reasons: Identified as a pullback resistance that aligns with the 78.6% Fibonacci retracement, indicating a potential level that could cap further upward movement.
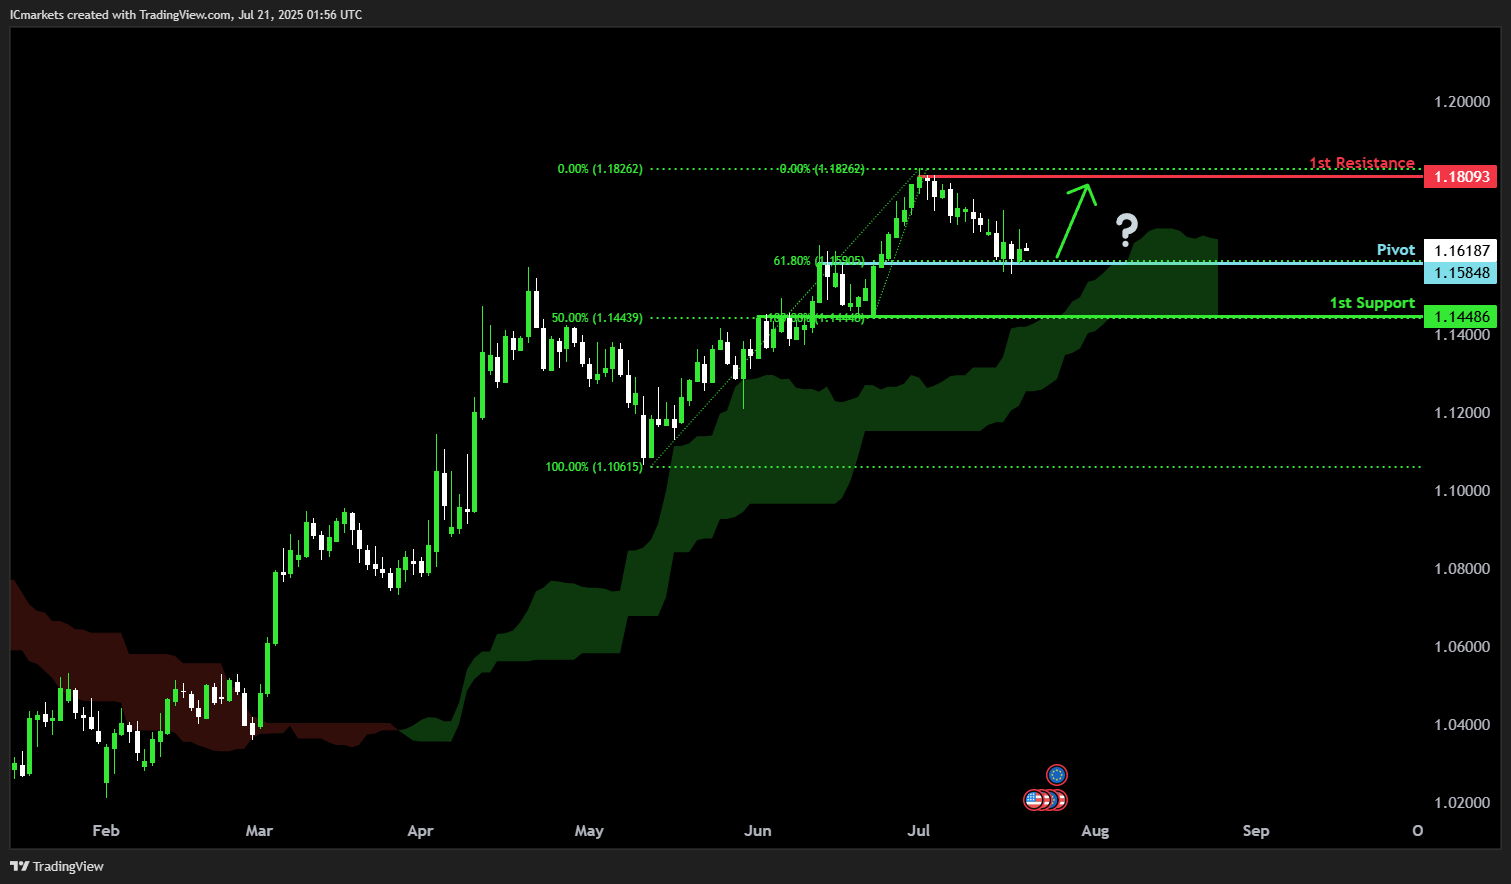
EUR/USD:
Potential Direction: Bullish
Overall momentum of the chart: Bullish
The price could potentially make a bullish bounce off the pivot and rise toward the 1st resistance. Additionally, the price is above the Ichimoku Cloud, which adds further significance to the strength of the bullish momentum.
Pivot: 1.1584
Supporting reasons: Identified as an overlap support that aligns with the 61.8% Fibonacci retracement, indicating a potential area where buying interests could pick up to resume the uptrend.
1st support: 1.1448
Supporting reasons: Identified as an overlap support that aligns with the 50% Fibonacci retracement, indicating a potential area where the price could again stabilize.
1st resistance: 1.1809
Supporting reasons: Identified as a swing high resistance, indicating a potential area that could halt any further upward movement.
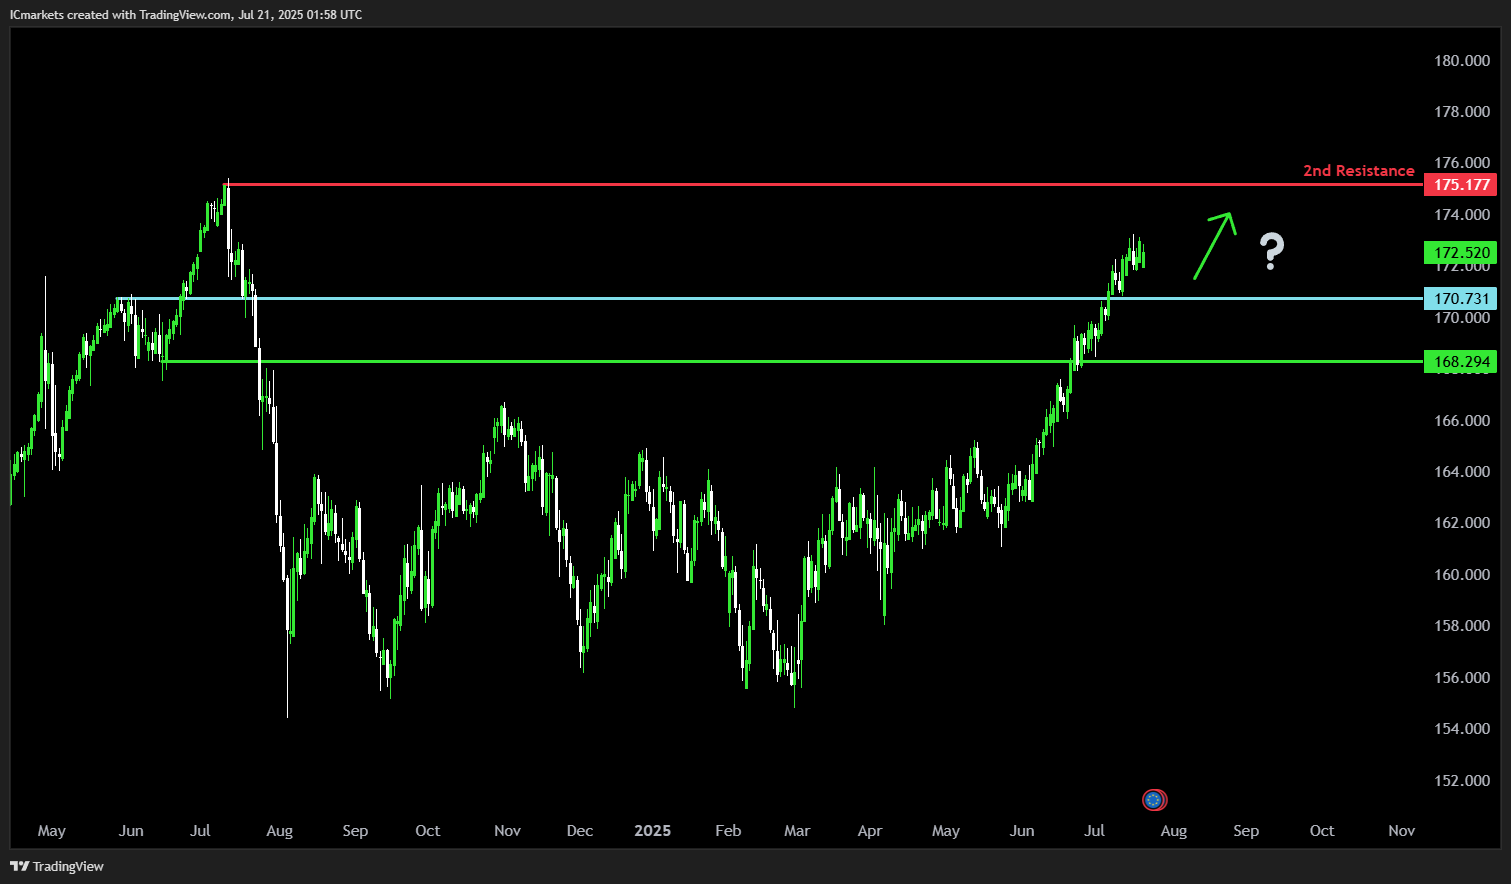
EUR/JPY:
Potential Direction: Bullish
Overall momentum of the chart: Bullish
The price could fall toward the pivot and make a bullish bounce off the pivot and rise toward the 1st resistance.
Pivot: 170.73
Supporting reasons: Identified as an overlap support, indicating a potential area where buying interest could pick up to resume the uptrend.
1st support: 168.29
Supporting reasons: Identified as a pullback support, indicating a potential area where the price could again stabilize.
1st resistance: 175.17
Supporting reasons: Identified as a swing-high resistance, acting as a key area that could halt any further upward movement.
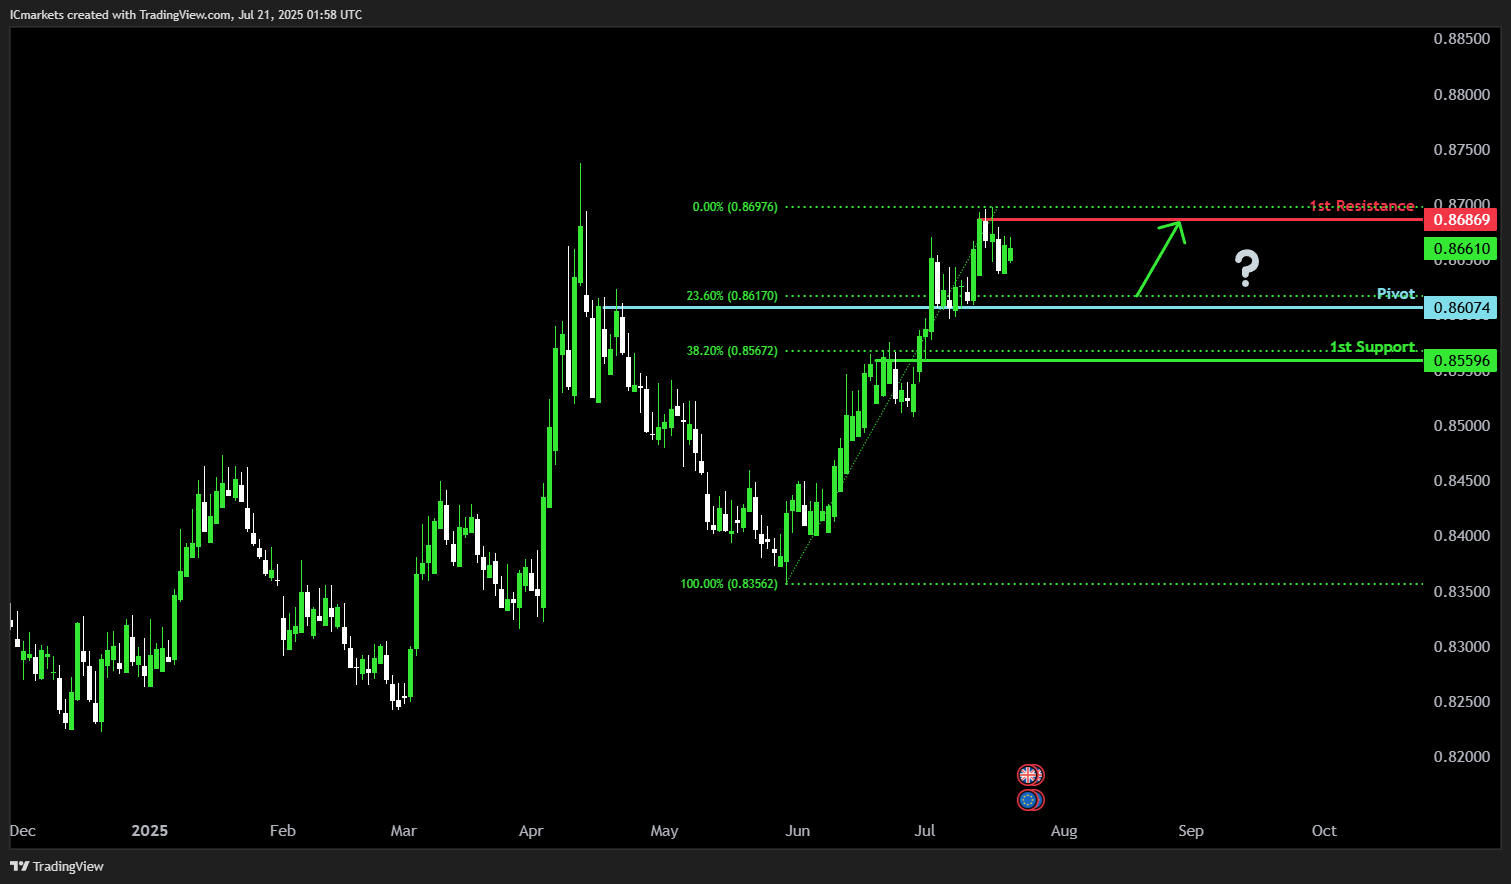
EUR/GBP:
Potential Direction: Bullish
Overall momentum of the chart: Bullish
The price could fall toward the pivot and make a bullish bounce off the pivot and rise toward the 1st resistance.
Pivot: 0.8607
Supporting reasons: Identified as an overlap support that aligns closely with the 23.6% Fibonacci retracement, indicating a potential area where buying interest could pick up to resume the uptrend.
1st support: 0.8559
Supporting reasons: Identified as a pullback support that aligns closely with the 38.2% Fibonacci retracement, indicating a potential area where the price could stabilize once more.
1st resistance: 0.8686
Supporting reasons: Identified as a swing-high resistance that aligns with the 161.8% Fibonacci extension, indicating a potential level that could cap further upward movement.
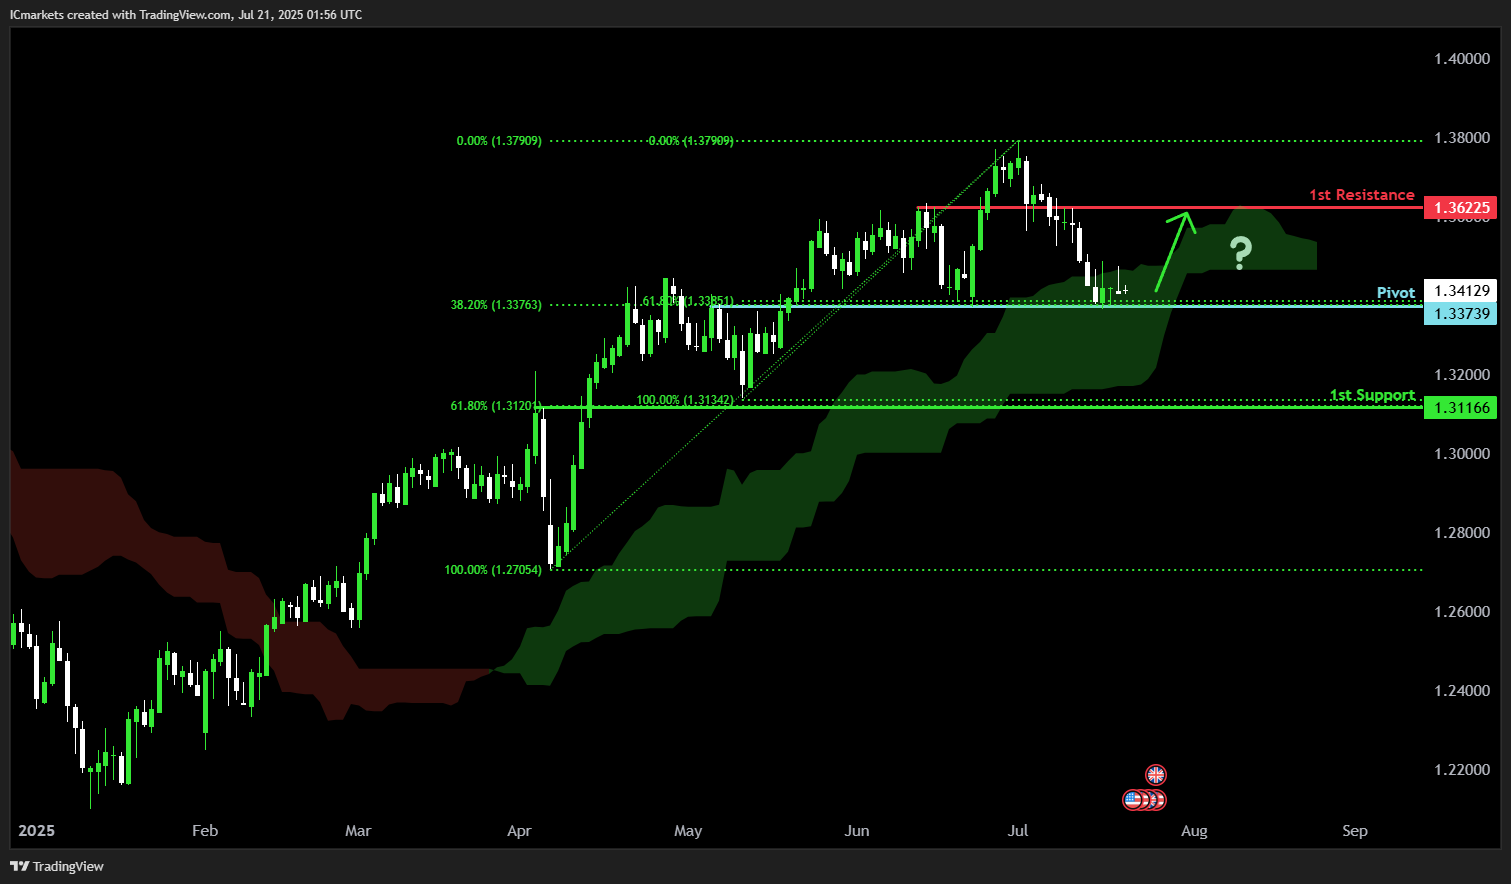
GBP/USD:
Potential Direction: Bullish
Overall momentum of the chart: Bullish
The price could make a bullish bounce off the pivot and rise toward the 1st resistance. Additionally, the price is above the Ichimoku Cloud, which adds further significance to the strength of the bullish momentum.
Pivot: 1.2273
Supporting reasons: Identified as an overlap support that aligns closely with the 38.2% Fibonacci retracement, indicating a potential area where buying interest could pick up to resume the uptrend.
1st support: 1.3116
Supporting reasons: Identified as an overlap support that aligns with the 61.8% Fibonacci retracement, indicating a potential area where the price could stabilize once more.
1st resistance: 1.3622
Supporting reasons: Identified as an overlap resistance, indicating a potential level that could cap further upward movement.
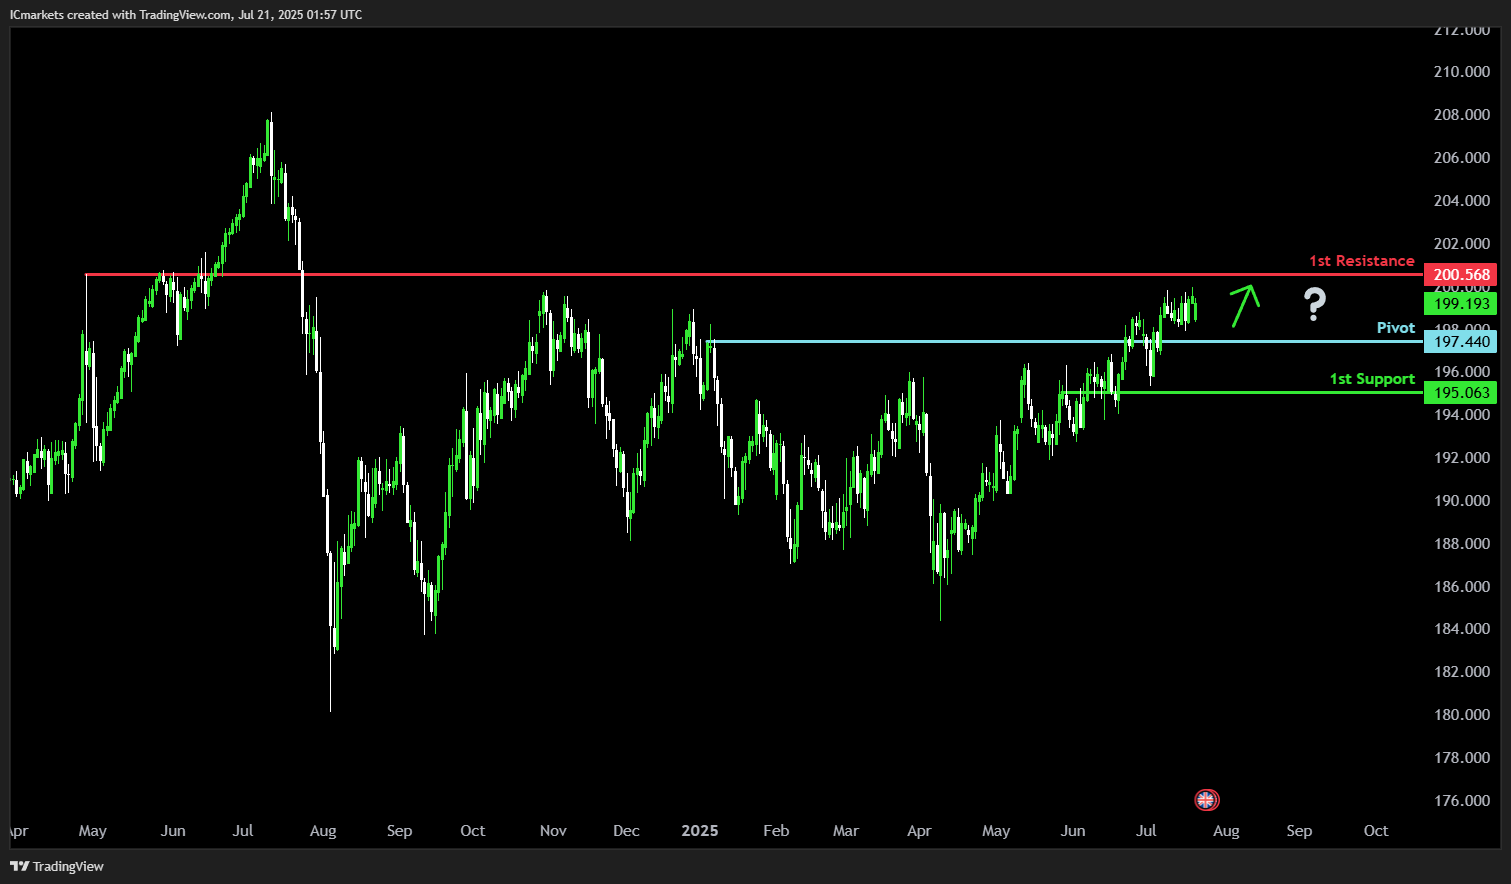
GBP/JPY:
Potential Direction: Bullish
Overall momentum of the chart: Bullish
The price could fall toward the pivot and make a bullish bounce off the pivot and rise toward the 1st resistance.
Pivot: 197.44
Supporting reasons: Identified as a pullback support, indicating a potential area where buying interest could pick up to resume the uptrend.
1st support: 195.06
Supporting reasons: Identified as an overlap support, indicating a potential level where the price could stabilize once more.
1st resistance: 200.56
Supporting reasons: Identified as a pullback resistance, acting as a key area that could halt any further upward movement.
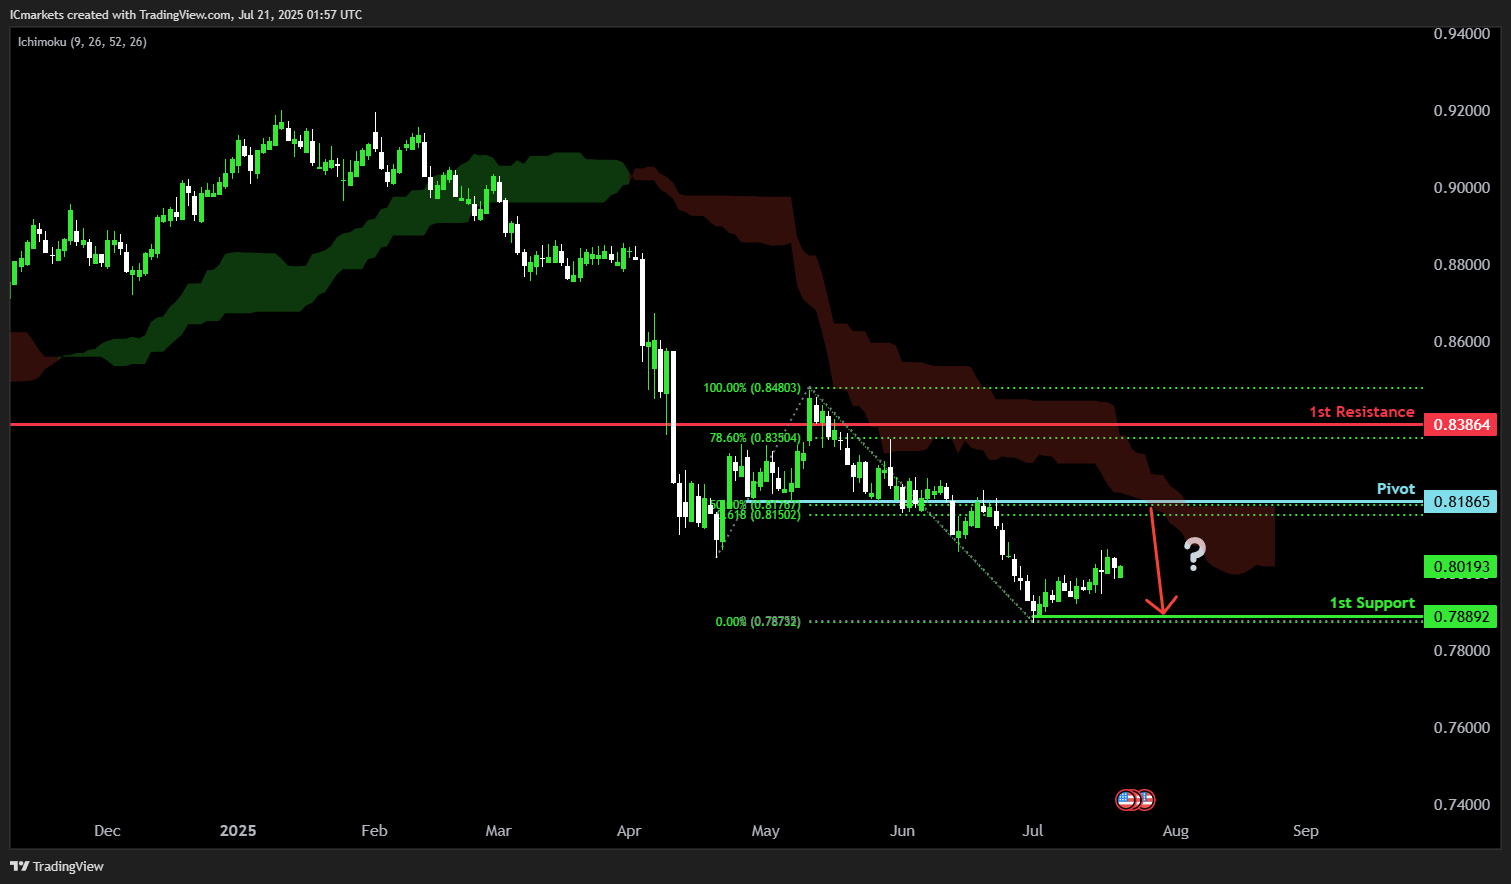
USD/CHF:
Potential Direction: Bearish
Overall momentum of the chart: Bearish
The price could make a bearish reversal off the pivot and fall toward the 1st support. Additionally, the price is below the Ichimoku Cloud, which adds further significance to the strength of the bearish momentum.
Pivot: 0.8186
Supporting reasons: Identified as an overlap resistance that aligns with the 50% Fibonacci retracement, indicating a potential area where selling pressures could intensify.
1st support: 0.7889
Supporting reasons: Identified as a swing low support, indicating a potential level where the price could stabilize once again.
1st resistance: 0.8386
Supporting reasons: Identified as a pullback resistance that aligns closely with the 78.6% Fibonacci retracement, indicating a potential level that could cap further upward movement.
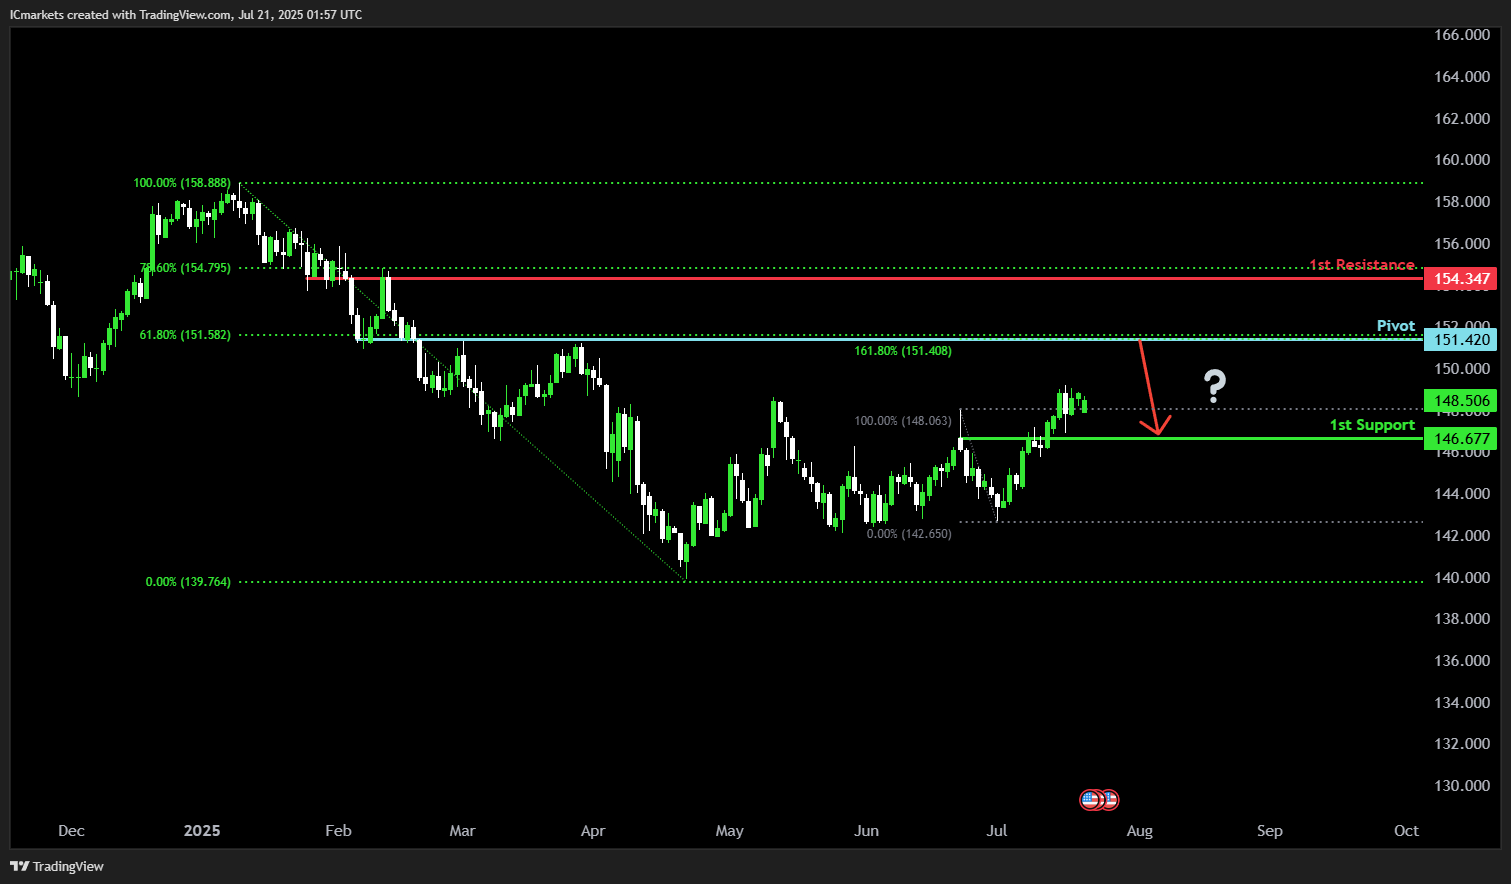
USD/JPY:
Potential Direction: Bearish
Overall momentum of the chart: Bearish
The price could make a bearish reversal off the pivot and fall toward the 1st support.
Pivot: 151.42
Supporting reasons: Identified as an overlap resistance that aligns with the 61.8% Fibonacci retracement, indicating a potential area where selling pressures could intensify.
1st support: 146.67
Supporting reasons: Identified as a pullback support, suggesting a potential area where the price could stabilize once more.
1st resistance: 154.34
Supporting reasons: Identified as an overlap resistance that aligns closely with the 78.6% Fibonacci retracement, indicating a potential level that could cap further upward movement.
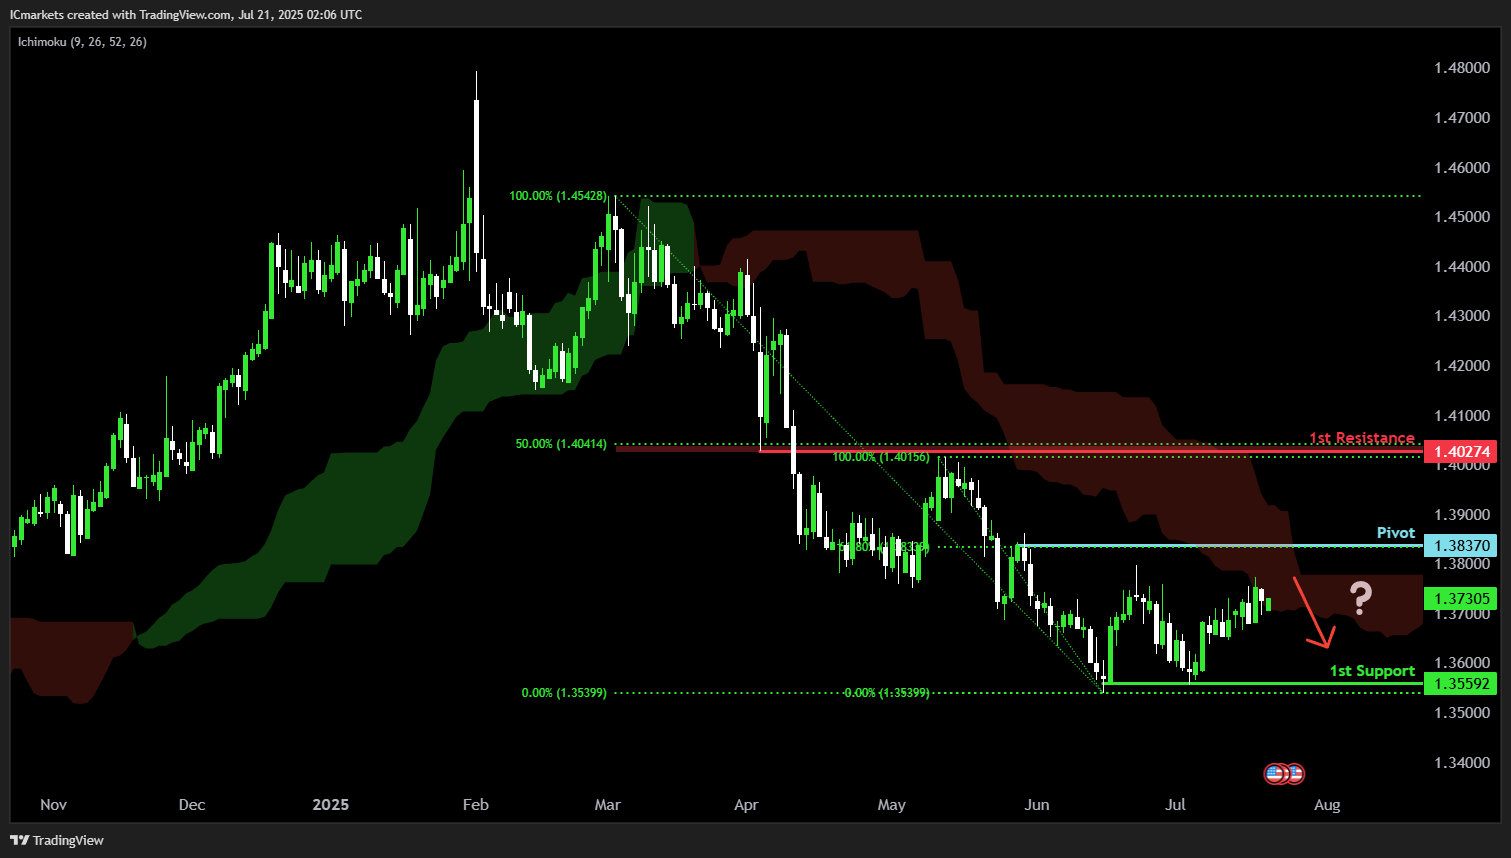
USD/CAD:
Potential Direction: Bearish
Overall momentum of the chart: Neutral
The price is rising toward the pivot and could potentially make a bearish reversal off this level to fall toward the 1st support. The presence of the red Ichimoku Cloud adds further significance to the strength of the downward momentum.
Pivot: 1.3837
Supporting reasons: Identified as a swing-high resistance that aligns with a 61.8% Fibonacci retracement, indicating a potential area where selling pressures could intensify.
1st support: 1.3559
Supporting reasons: Identified as a multi-swing-low support, indicating a key level where the price could stabilize once more.
1st resistance: 1.4027
Supporting reasons: Identified as an overlap resistance that aligns closely with a 50% Fibonacci retracement, indicating a potential area that could halt any further upward movement.
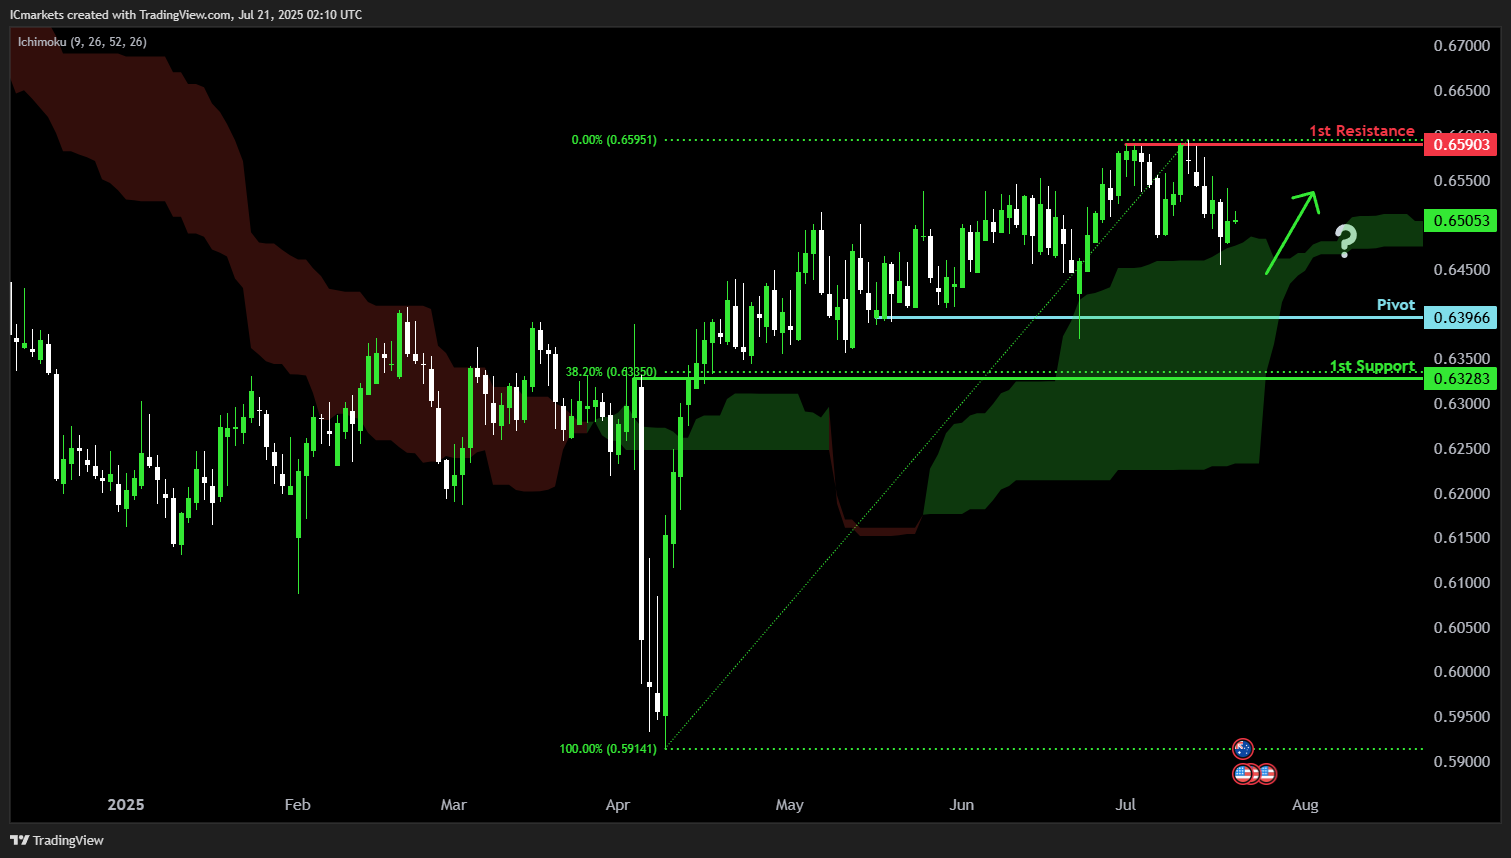
AUD/USD:
Potential Direction: Bullish
Overall momentum of the chart: Neutral
The price could fall toward the pivot and potentially make a bullish bounce off this level to rise toward the 1st resistance. The presence of the green Ichimoku Cloud adds further significance to the strength of the upward momentum.
Pivot: 0.6396
Supporting reasons: Identified as a multi-swing-low support, indicating a potential area where buying interests could pick up to stage a rebound.
1st support: 0.6328
Supporting reasons: Identified as a pullback support that aligns closely with a 38.2% Fibonacci extension, suggesting a potential area where the price could stabilize once again.
1st resistance: 0.6590
Supporting reasons: Identified as a multi-swing-high resistance, indicating a potential area that could halt any further upward movement.
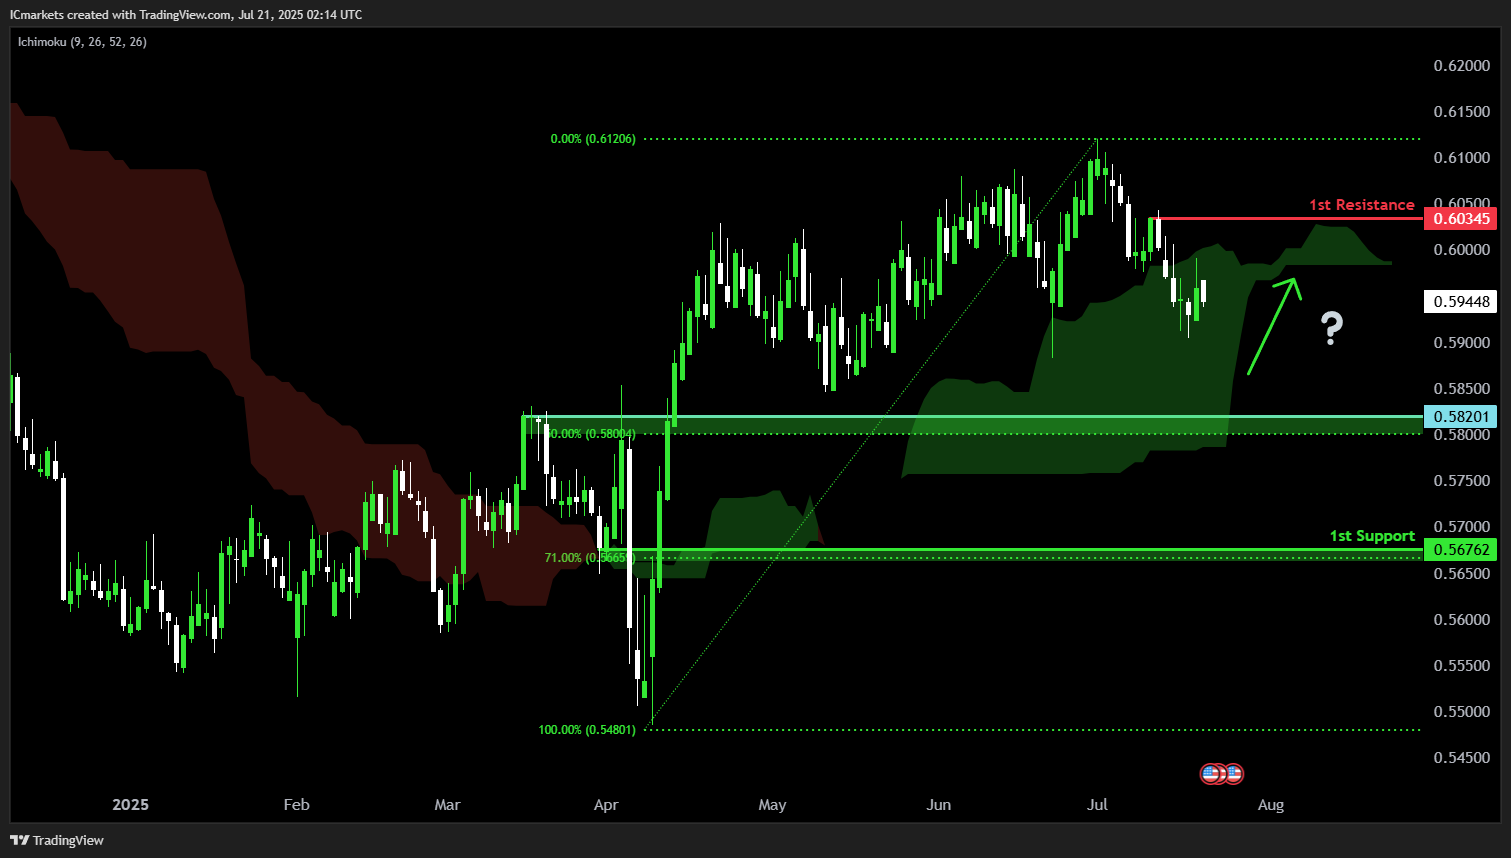
NZD/USD
Potential Direction: Bullish
Overall momentum of the chart: Neutral
The price could fall toward the pivot and potentially make a bullish bounce off this level to rise toward the 1st resistance. The presence of the green Ichimoku Cloud adds further significance to the strength of the upward momentum.
Pivot: 0.5820
Supporting reasons: Identified as a pullback support that aligns closely with a 50% Fibonacci retracement, indicating a potential area where buying interests could pick up to stage a rebound.
1st support: 0.5676
Supporting reasons: Identified as a pullback support that aligns closely with a 78.6% Fibonacci retracement, suggesting a potential area where the price could stabilize once more.
1st resistance: 0.6034
Supporting reasons: Identified as a swing-high resistance, indicating a potential area that could halt any further upward movement.
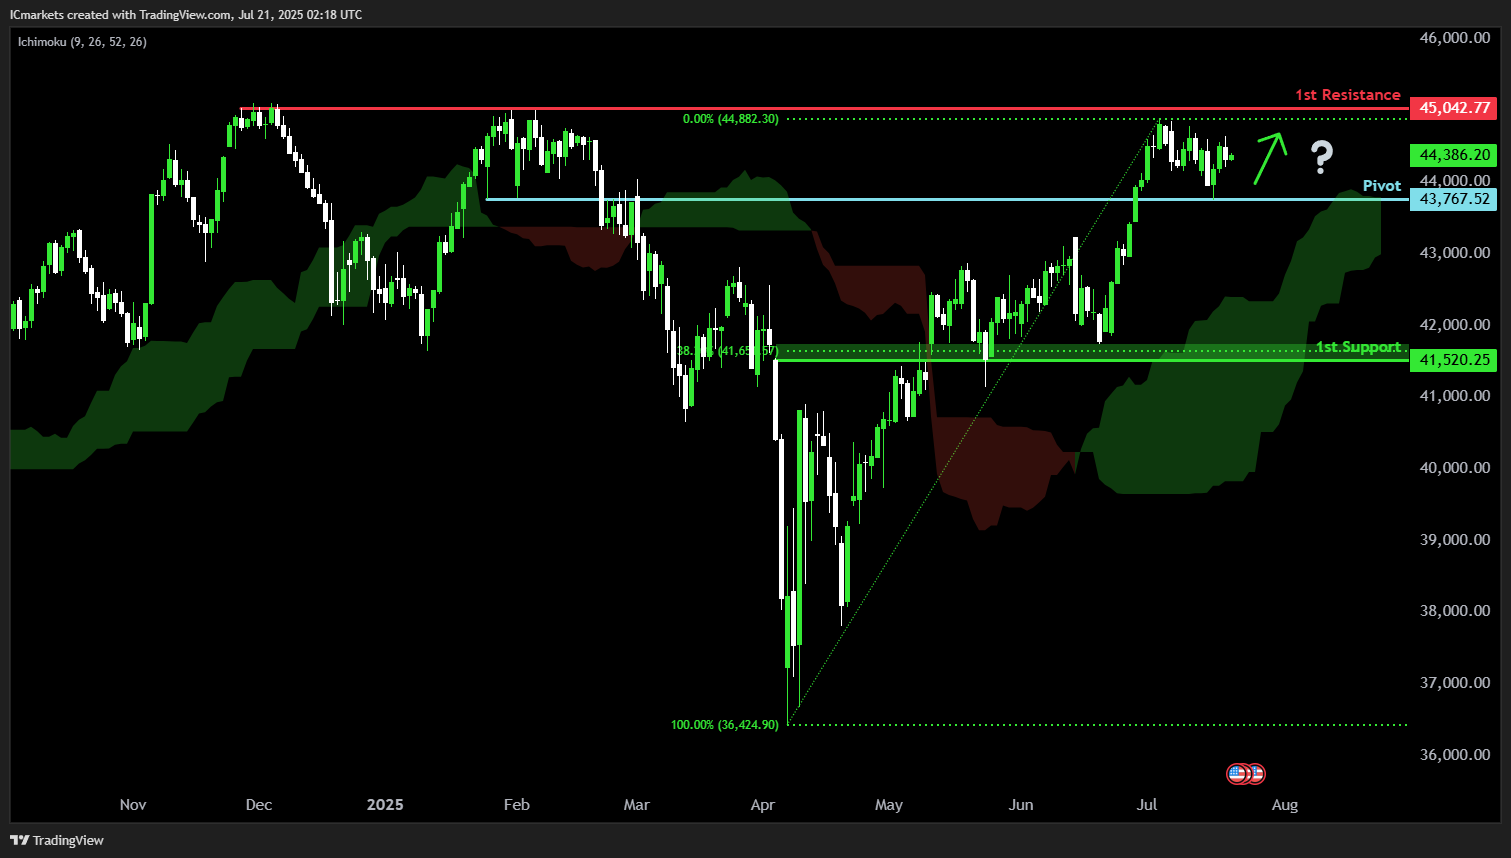
US30 (DJIA):
Potential Direction: Bullish
Overall momentum of the chart: Bullish
The price has made a bullish bounce off the pivot and could potentially rise toward the 1st resistance. The presence of the green Ichimoku Cloud adds further significance to the strength of the upward momentum.
Pivot: 43,767.52
Supporting reasons: Identified as an overlap support, indicating a potential area where buying interests could pick up to stage a rebound.
1st support: 41,520.25
Supporting reasons: Identified as an overlap support that aligns closely with a 38.2% Fibonacci retracement, suggesting a potential area where the price could stabilize once again.
1st resistance: 45,042.77
Supporting reasons: Identified as a multi-swing-high resistance that aligns close to the all-time high, indicating a potential area that could halt any further upward movement.
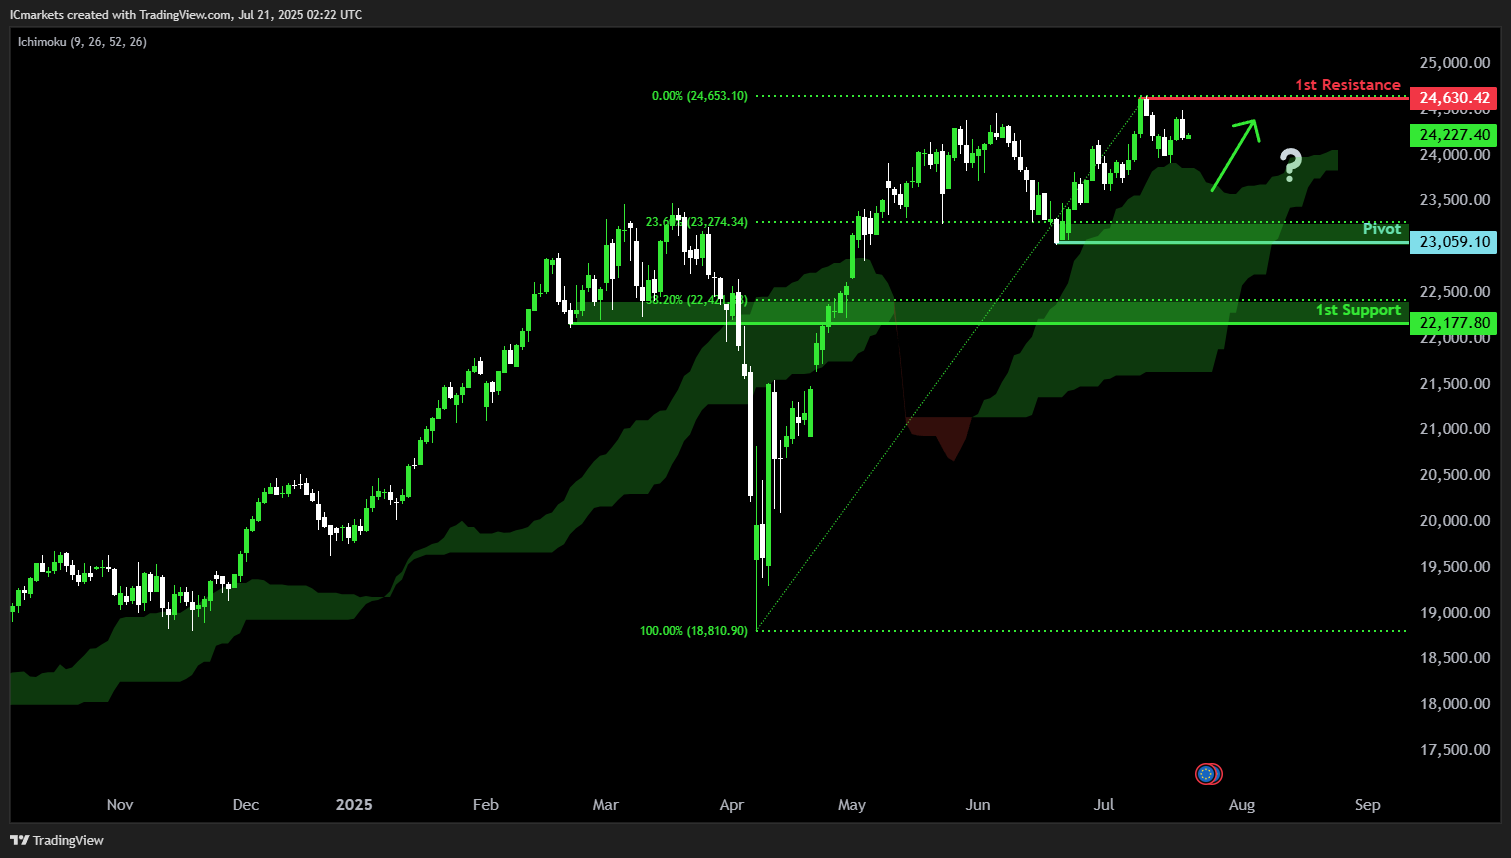
DE40 (DAX):
Potential Direction: Bullish
Overall momentum of the chart: Bullish
The price could fall toward the pivot and potentially make a bullish bounce off this level to rise toward the 1st resistance. The presence of the green Ichimoku Cloud adds further significance to the strength of the upward momentum.
Pivot: 23,059.10
Supporting reasons: Identified as a swing-low support that aligns closely with a 23.6% Fibonacci retracement, indicating a potential area where buying interests could pick up to resume the uptrend.
1st support: 22,177.80
Supporting reasons: Identified as a pullback support that aligns closely with a 38.2% Fibonacci retracement, indicating a key level where the price could stabilize once more.
1st resistance: 24,630.42
Supporting reasons: Identified as a swing-high resistance that aligns with close to the all-time high, indicating a potential area that could halt any further upward movement.
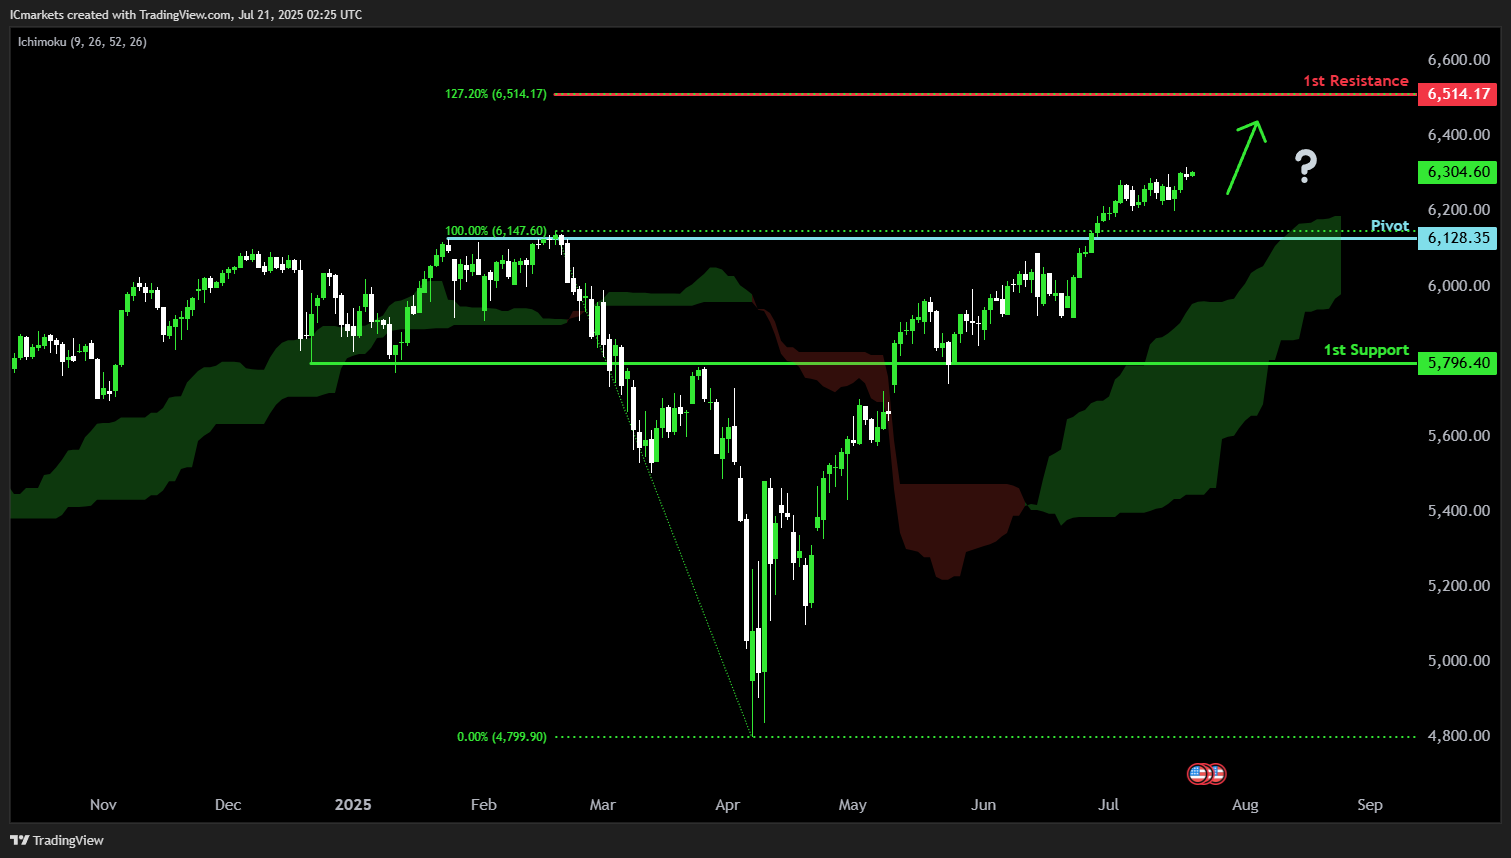
US500 (S&P 500):
Potential Direction: Bullish
Overall momentum of the chart: Bullish
The price could fall toward the pivot and potentially make a bullish bounce off this level to rise toward the 1st resistance. The presence of the green Ichimoku Cloud adds further significance to the strength of the upward momentum.
Pivot: 6,128.35
Supporting reasons: Identified as a pullback support, indicating a potential area where buying interests could pick up to resume the uptrend.
1st support: 5,796.40
Supporting reasons: Identified as an overlap support, indicating a potential level where the price could stabilize once again.
1st resistance: 6,514.17
Supporting reasons: Identified as a resistance that aligns with a 127.2% Fibonacci extension, indicating a potential area that could halt any further upward movement.
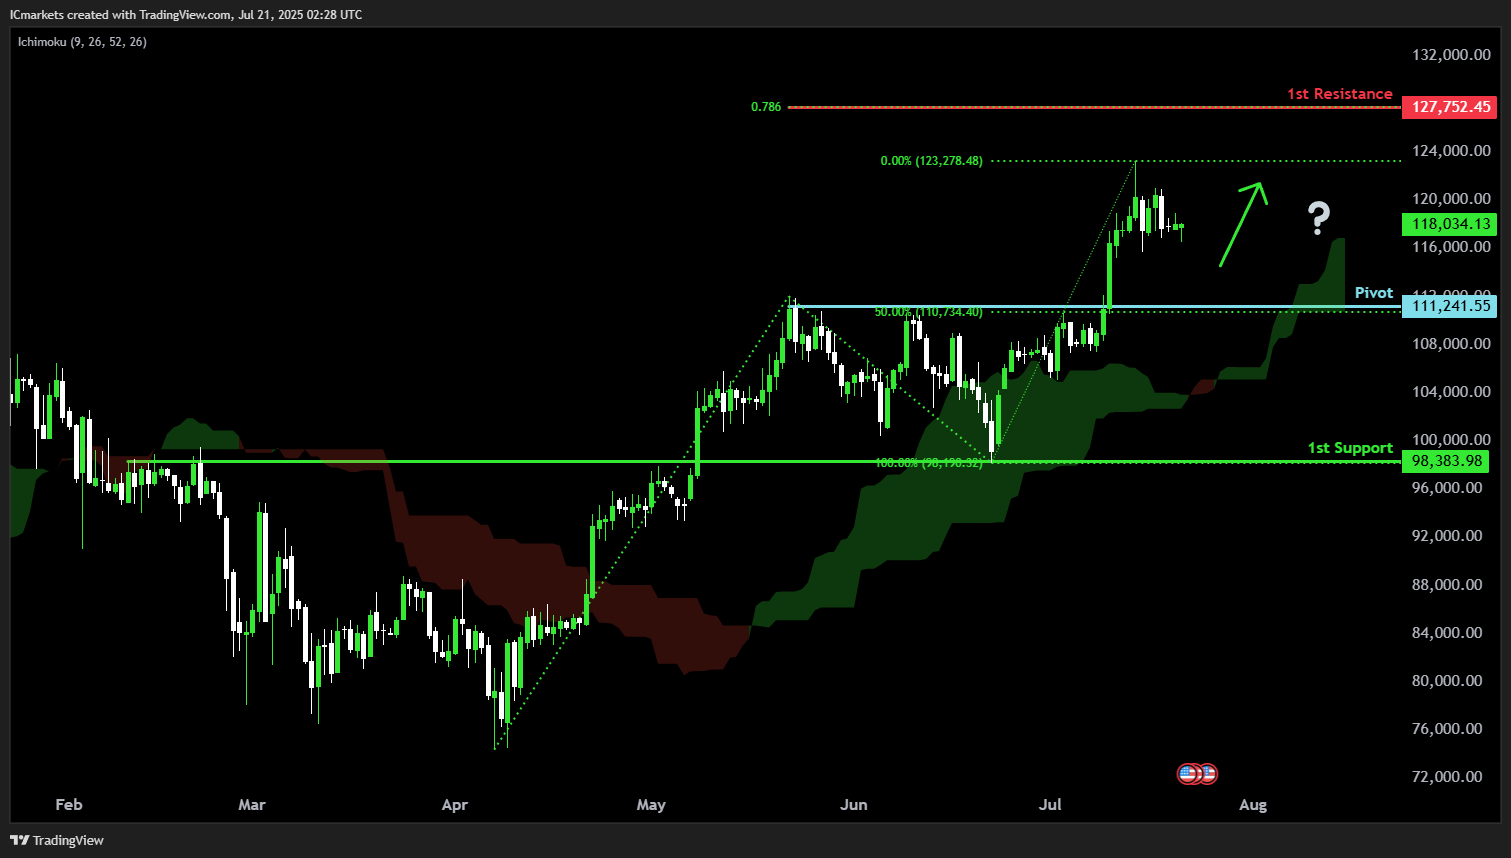
BTC/USD (Bitcoin):
Potential Direction: Bullish
Overall momentum of the chart: Bullish
The price could fall toward the pivot and potentially make a bullish bounce off this level to rise toward the 1st resistance. The presence of the green Ichimoku Cloud adds further significance to the strength of the upward momentum.
Pivot: 111,241.55
Supporting reasons: Identified as a pullback support that aligns with a 50% Fibonacci retracement, indicating a potential area where buying interests could pick up to resume the uptrend.
1st support: 98,383.98
Supporting reasons: Identified as an overlap support, indicating a potential level where the price could stabilize once more.
1st resistance: 127,752.45
Supporting reasons: Identified as a resistance that aligns with a 78.6% Fibonacci projection, indicating a potential area that could halt any further upward movement.
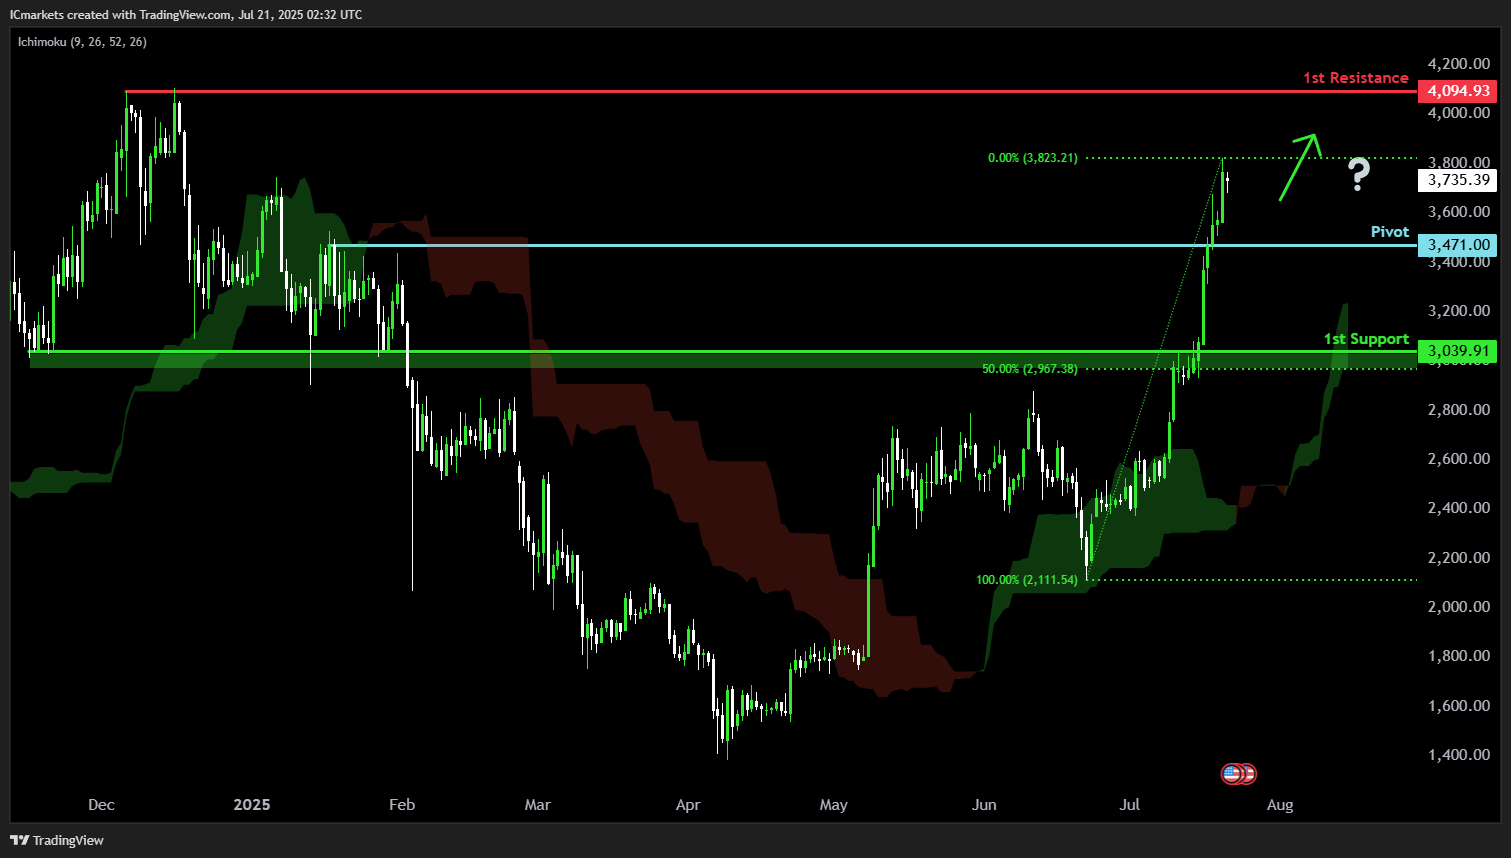
ETH/USD (Ethereum):
Potential Direction: Bullish
Overall momentum of the chart: Bullish
The price could fall toward the pivot and potentially make a bullish bounce off this level to rise toward the 1st resistance. The presence of the green Ichimoku Cloud adds further significance to the strength of the upward momentum.
Pivot: 3,471.00
Supporting reasons: Identified as a pullback support, indicating a potential area where buying interests could pick up to resume the uptrend.
1st support: 3,039.91
Supporting reasons: Identified as a pullback support that aligns closely with a 50% Fibonacci retracement, indicating a potential level where the price could stabilize once more.
1st resistance: 4,094.93
Supporting reasons: Identified as a multi-swing-high resistance, indicating a potential area that could halt any further upward movement.
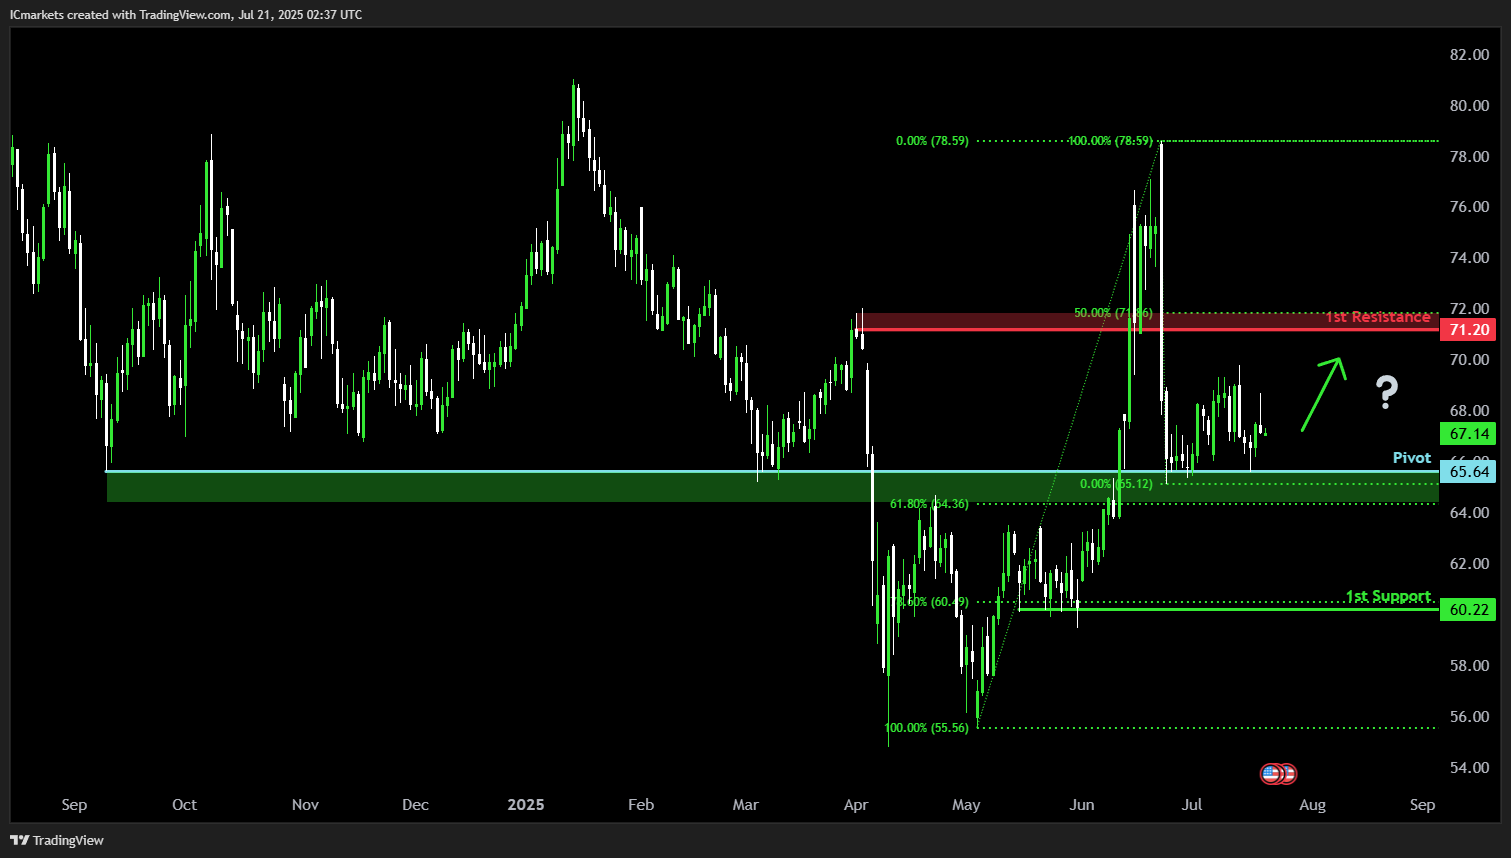
WTI/USD (Oil):
Potential Direction: Bullish
Overall momentum of the chart: Neutral
The price could fall toward the pivot and potentially make a bullish bounce off this level to rise toward the 1st resistance.
Pivot: 65.64
Supporting reasons: Identified as a multi-swing-low support that aligns closely with a 61.8% Fibonacci retracement, indicating a potential area where buying interests could pick up to stage a minor rebound.
1st support: 60.22
Supporting reasons: Identified as a multi-swing-lowk support that aligns closely with a 78.6% Fibonacci retracement, indicating a key level where the price could stabilize once more.
1st resistance: 71.20
Supporting reasons: Identified as a pullback resistance that aligns closely with a 50% Fibonacci retracement, indicating a potential area that could halt any further upward movement.
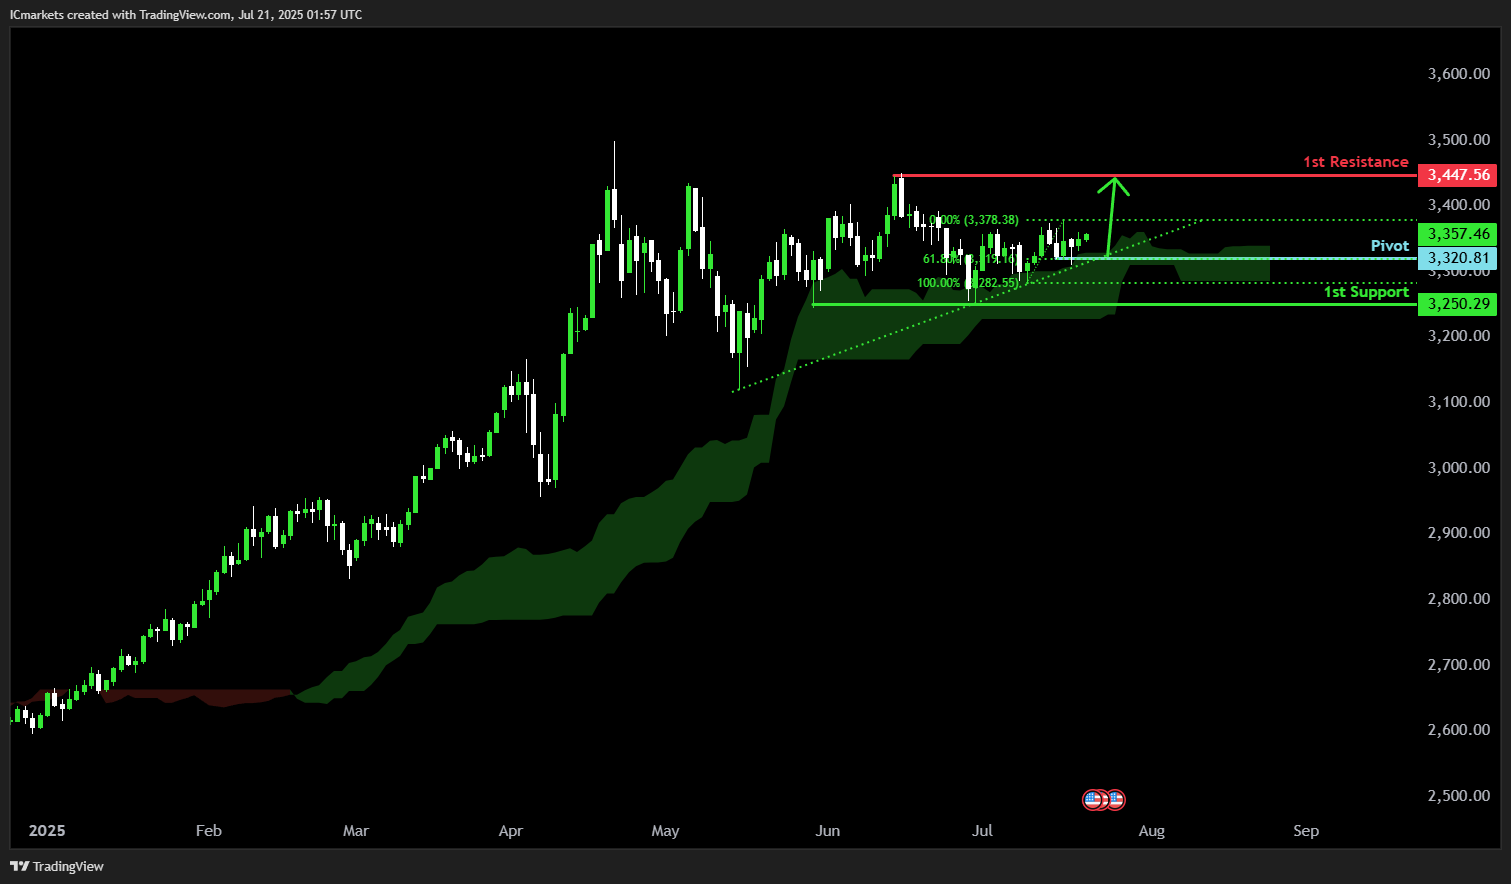
XAU/USD (GOLD):
Potential Direction: Bullish
Overall momentum of the chart: Bullish
The price could make a bullish bounce off the pivot and rise toward the 1st resistance. Additionally, the price is above the Ichimoku Cloud, which adds further significance to the strength of the bullish momentum.
Pivot: 3320.81
Supporting reasons: Identified as an overlap support that aligns with the 61.8% Fibonacci retracement, indicating a potential area where buying interests could pick up to resume the uptrend.
1st support: 3250.29
Supporting reasons: Identified as a swing low support, indicating a key level where the price could stabilize once more.
1st resistance: 3447.56
Supporting reasons: Identified as a swing high resistance, indicating a potential area that could halt any further upward movement.
The accuracy, completeness and timeliness of the information contained on this site cannot be guaranteed. IC Markets does not warranty, guarantee or make any representations, or assume any liability regarding financial results based on the use of the information in the site.
News, views, opinions, recommendations and other information obtained from sources outside of www.icmarkets.com, used in this site are believed to be reliable, but we cannot guarantee their accuracy or completeness. All such information is subject to change at any time without notice. IC Markets assumes no responsibility for the content of any linked site.
The fact that such links may exist does not indicate approval or endorsement of any material contained on any linked site. IC Markets is not liable for any harm caused by the transmission, through accessing the services or information on this site, of a computer virus, or other computer code or programming device that might be used to access, delete, damage, disable, disrupt or otherwise impede in any manner, the operation of the site or of any user’s software, hardware, data or property.