
A note on lower timeframe confirming price action…
Waiting for lower timeframe confirmation is our main tool to confirm strength within higher timeframe zones, and has really been the key to our trading success. It takes a little time to understand the subtle nuances, however, as each trade is never the same, but once you master the rhythm so to speak, you will be saved from countless unnecessary losing trades. The following is a list of what we look for:
- A break/retest of supply or demand dependent on which way you’re trading.
- A trendline break/retest.
- Buying/selling tails – essentially we look for a cluster of very obvious spikes off of lower timeframe support and resistance levels within the higher timeframe zone.
- Candlestick patterns. We tend to only stick with pin bars and engulfing bars as these have proven to be the most effective.
For us, lower timeframe confirmation starts on the M15 and finishes up on the H1, since most of our higher timeframe areas begin with the H4.
EUR/USD:
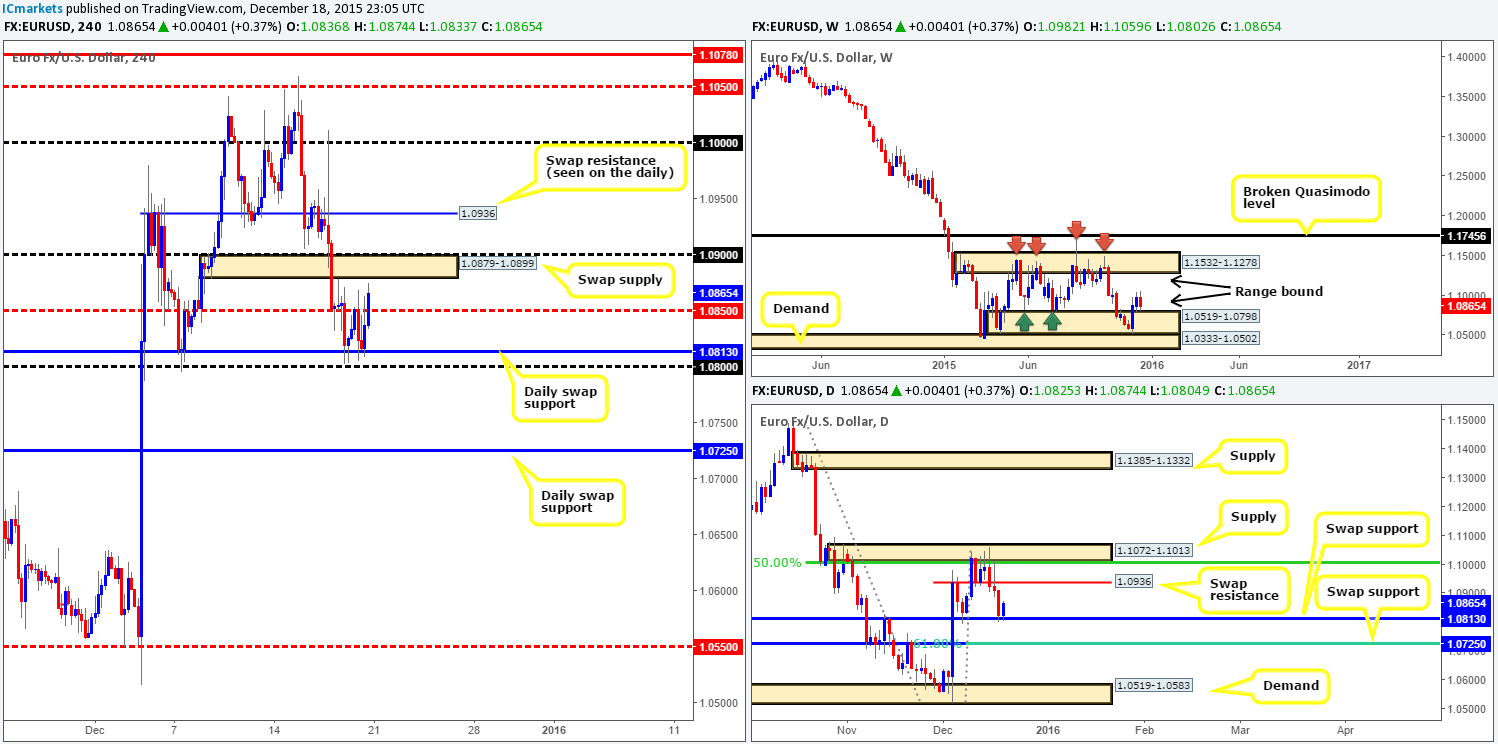
Following two weeks of buying from deep within a weekly range demand at 1.0519-1.0798, the single currency changed tracks last week. As a result of this, all gains accrued the week prior were erased and price was sent back down to the top-side of the above said demand into the close 1.0865. We doubt there will be much movement on the weekly timeframe this week due to most traders winding down for the festive period. With that being said though, low liquidity does not always mean less movement. Therefore, upside targets fall in around range supply coming in at 1.1532-1.1278, whilst a break below the range demand would see price enter into the jaws of another demand below it drawn from 1.0333-1.0502.
On the other side of the field, daily action shows that other than the indecision candle printed on Monday, and the rebound from the swap support level at 1.0813 on Friday, the EUR was painted red! However, if the buyers continue to defend the 1.0813 hurdle this week, then we see a clear run on this timeframe up to a minor, but quite obvious, swap resistance level at 1.0936. A violation of 1.0813 on the other hand places the swap support level at 1.0725 (converges with a 61.8% Fibonacci level) in the limelight.
A quick look at Friday’s activity on the H4 reveals that with the help of the current daily swap (support) barrier, psychological support 1.0800 held steady, forcing price to close above mid-level resistance 1.0850 by the week’s end. Although the close was strong, there’s trouble lurking directly above in the form of not only a swap supply zone at 1.0879-1.0899, but also psychological resistance placed at 1.0900.
Given that today’s fundamental docket is relatively light, we are not expecting much action. Considering the position of price on the higher timeframe picture (see above) though, we may, however, see further buying take form going into the week. From this, we’d expect the above said H4 swap supply/psychological resistance to be engulfed, and price touch gloves with the H4 swap resistance level at 1.0936 (seen as resistance on the daily chart too), and at a push, the large psychological resistance 1.1000 (sits just below daily supply at 1.1072-1.1013), which are both potential sell zones.
Nevertheless, should price retest 1.0800 again, we’d also be interested in looking to buy here due to the clear relationship this number has with the higher timeframe supports (see above). In the event that this level gives way, which is not something we see playing out, then there’s little to stop price from connecting with 1.0725 – the daily swap (support) barrier mentioned above.
Levels to watch/live orders:
- Buys: 1.0800 [Tentative – confirmation required] (Stop loss: dependent on where one confirms this level).
- Sells: 1.0936 [Tentative – confirmation required] (Stop loss: dependent on where one confirms this level). 1.1000 [Tentative – confirmation required] (Stop loss: dependent on where one confirms this level).
GBP/USD:
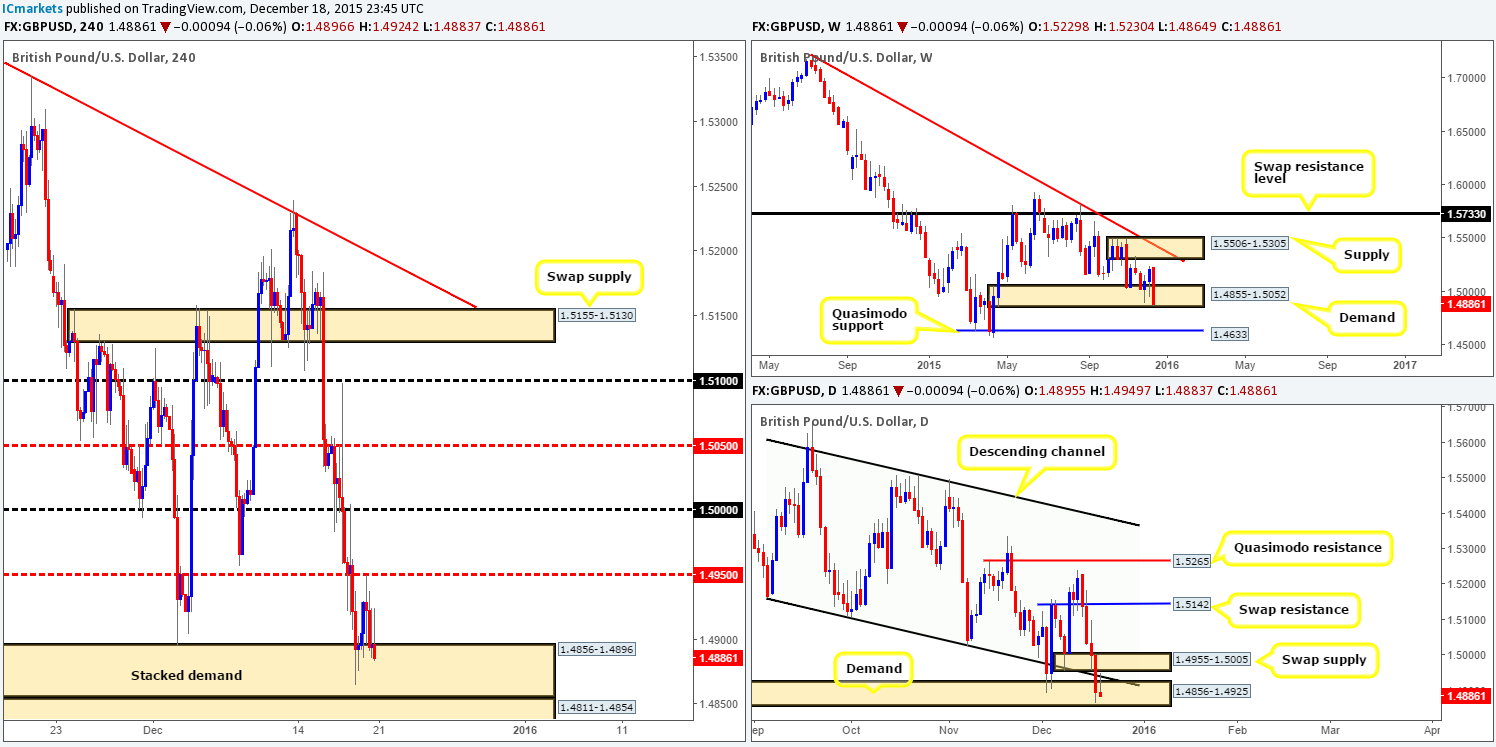
It’s amazing what a new week of trade can bring. This time last week, weekly action was riding strong from demand at 1.4855-1.5052. This all came to an end last week, nevertheless, as the GBP plummeted around 330 pips, printing a full-bodied bearish candle into the depths of the aforementioned weekly demand by the close 1.4886. Assuming that this bearish momentum continues this Christmas week and this area is taken out, we see little stopping this pair from continuing lower towards the Quasimodo support level at 1.4633.
Rolling down into the daily chart, one can see just how bearish last week was! Demand (now supply) at 1.4955-1.5005 along with channel support taken from the low 1.5162 were consumed, leaving price free to test bids around demand at 1.4856-1.4925. As can be seen on the chart, an inverted pin-bar was printed within this demand which retested the underside of the recently broken channel line. Although an inverted pin-bar can mean a reversal, we’re concerned that both the underside of the current channel (resistance) line and the swap supply area mentioned above at 1.4955-1.5005 may prove too much for the buyers this week. With that, we could see a break below the current demand, which may lead to a drive lower to a Quasimodo support level given at 1.4739.
A quick recap of Friday’s H4 trade shows that price was bid from demand at 1.4856-1.4896 going into the early hours of the day. The rally, however, was short-lived since offers were just too strong at mid-level resistance 1.4950, consequently forcing the Pound back into the jaws of demand by the close.
As far as supply and demand goes (seen on each of the above timeframes), we should be looking to buy this currency now as this market appears oversold. Granted, the enthusiasm from the buyers is not ideal, but we cannot ignore the fact of where price is CURRENTLY trading. That being the case, here is how we intend to roll this one out… We will continue keeping an eye on lower timeframe action for buy opportunities within the present H4 demand. If a buy setup is found, we’ll take it with a smaller-than-usual position up to 1.4950 (we tend to go in lighter during the Christmas week). In case this demand is consumed, we’ll then be eyeing its partner demand below at 1.4811-1.4854 for potential (confirmed) buys. This demand, nevertheless, is planted below the higher timeframe demand areas noted above, so do keep this in mind, as it could either fail miserably, or act as a nice zone to facilitate a fakeout for higher prices.
Levels to watch/ live orders:
- Buys: 1.4856-1.4896 [Tentative – confirmation required] (Stop loss: dependent on where one confirms this area). 1.4811-1.4854 [Tentative – confirmation required] (Stop loss: dependent on where one confirms this area).
- Sells: Flat (Stop loss: N/A).
AUD/USD:
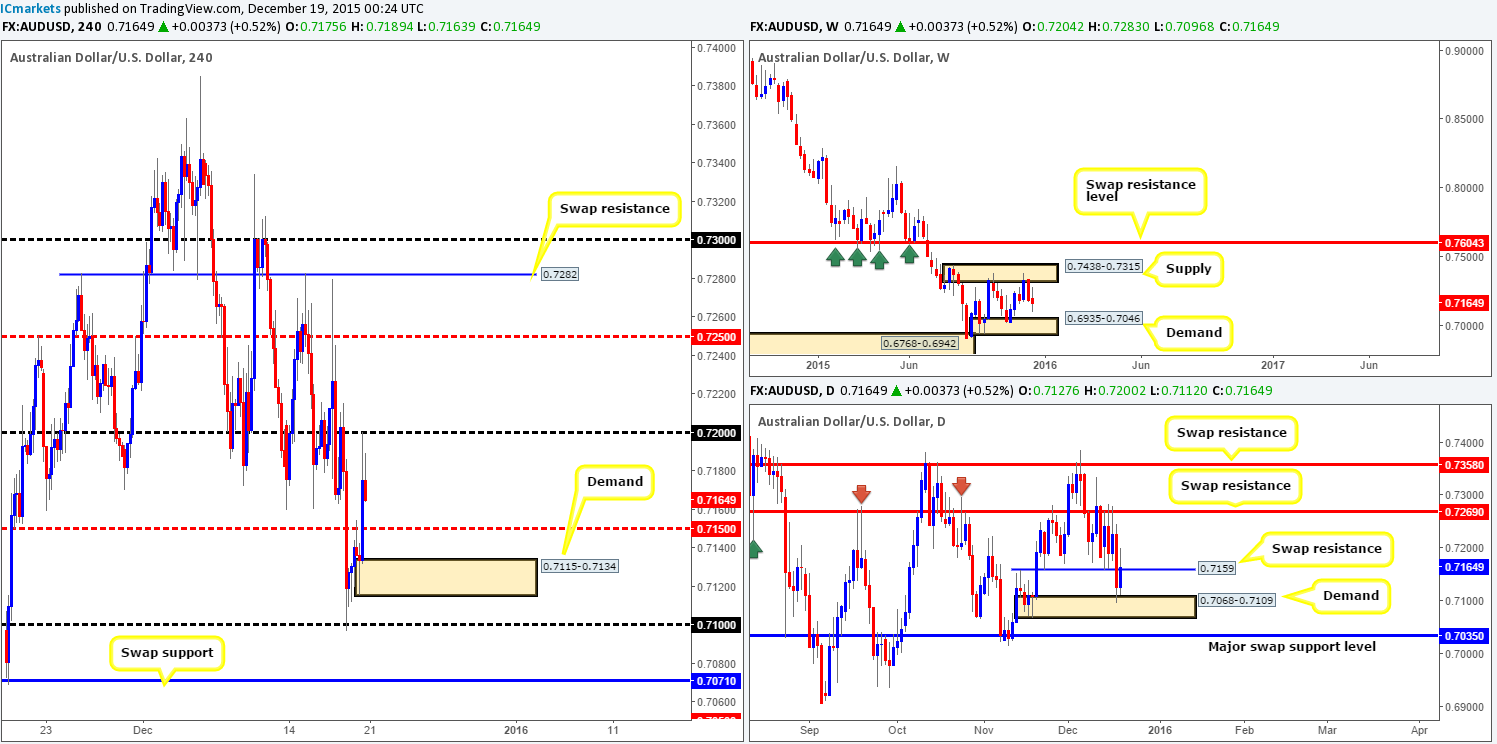
This past week has been a relatively busy one for the commodity currency, ranging over 200 pips. Despite this though, trade ended the week closing a mere twenty pips lower than the prior week’s close at 0.7164, resulting in an indecision candle forming. In our view, the Aussie dollar is now considered to be mid-range between supply at 0.7438-0.7315 and demand coming in at 0.6935-0.7046, which we do not see price breaking out of this year.
Turning our attention to the daily chart, we see that the AUD suffered during Thursday’s trade last week. Support at 0.7159 was taken out, consequently hitting and rebounding from demand at 0.7068-0.7109 on Friday which pulled prices back up to test 0.7159 as resistance. Should we see price bid above here this week, this could set the stage for a continuation move up to swap resistance at 0.7269. Conversely, if this market sells off from current prices and a break through demand is seen, the next barrier to have on your watch list should be 0.7035 – a major swap (support) level.
Regarding H4 action, following the rebound from psychological support 0.7100 on Thursday, bids held firm going into Friday’s trade, pushing the Aussie up to psychological resistance 0.7200 which aggressively repelled price into the close. From this, at least technically, H4 action is now likely support-free until the mid-level number 0.7150, followed closely by H4 demand at 0.7115-0.7134 (sits just above the aforementioned daily demand), so expect to see a touch of these areas (potential buy zones) before buyers come into the market. However, do bear in mind that daily sellers could also be active from the swap (resistance) level at 0.7159, so we’d recommend only entering long from the above said areas with lower timeframe confirming action.
Due to end-of-year flows beginning to kick in and with absolutely no fundamental data on the Aussie this week (at least not high impacting), the aforementioned H4 areas in bold are the only zones on our watch list for the time being.
Levels to watch/ live orders:
- Buys: 0.7150 [Tentative – confirmation required] (Stop loss: dependent on where one confirms this level). 0.7115-0.7134 [Tentative – confirmation required] (Stop loss: dependent on where one confirms this area).
- Sells: Flat (Stop loss: N/A).
USD/JPY:
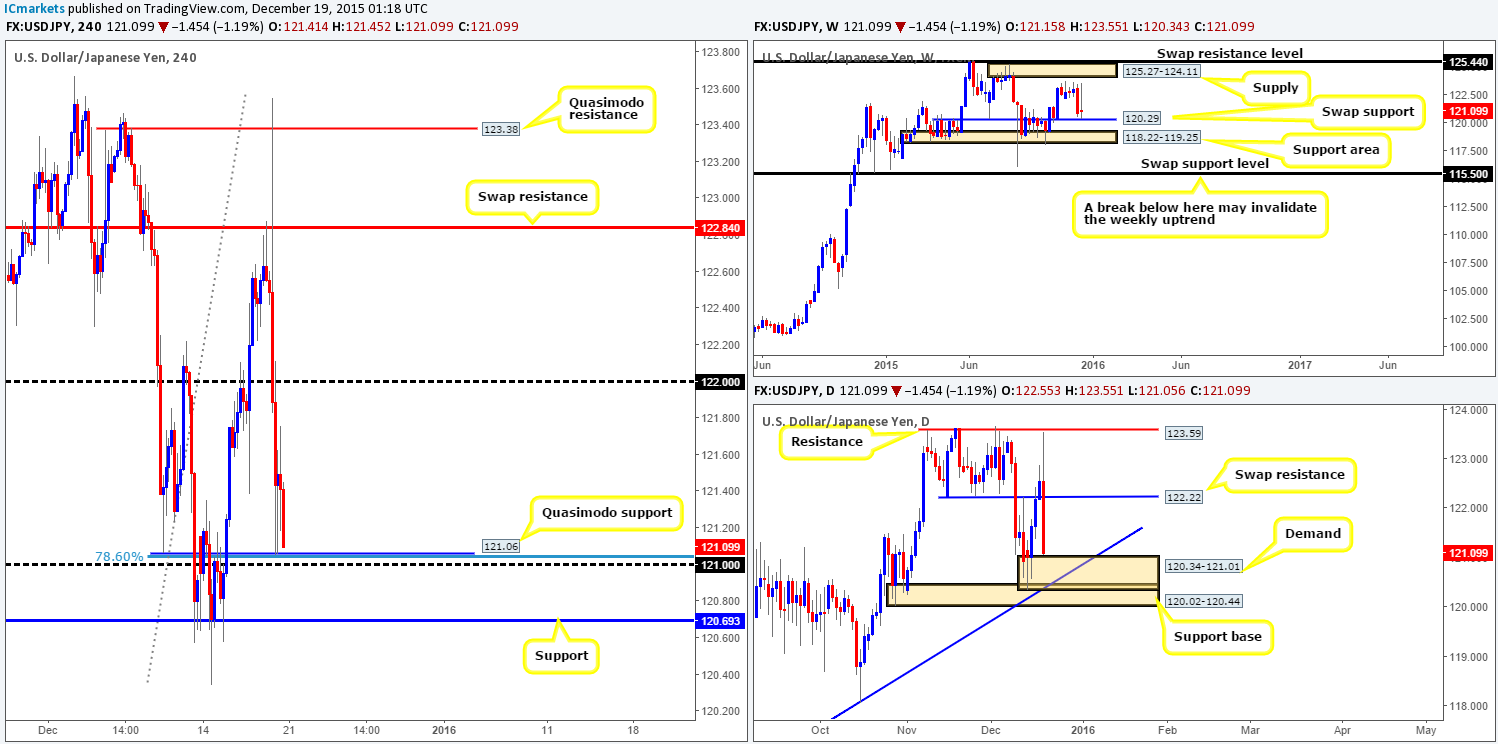
Like the Aussie dollar, the USD/JPY also had a relatively busy week ranging over 300 pips all in all. The closing difference, however, was a mere twenty pips or so at 121.09, as the pair continued to hold above the weekly swap (support) level at 120.29. Should bids fail here this week, do keep a close watch on the support area seen directly below it at 118.22-119.25.
Down on the daily chart, price came within four pips of stabbing into resistance seen at 123.59 before aggressively diving south on Friday. During this sell-off, support (now resistance) at 122.22 was taken out and price settled for the week at the tip of demand drawn from 120.34-121.01. Fundamentally, we believe this movement was triggered during the BoJ meeting.
Moving down a level to the H4 timeframe, multiple supports were taken out during Friday’s bearish onslaught, ending with candle action beautifully testing a Quasimodo support level at 121.06. Now, considering that price closed the week out just above this barrier, this will be a level we’ll have our eye on around the open today. There are a number of technical aspects that support this view: it’s not only supported by both psychological support 121.00 and a deep 78.6% Fibonacci level at 121.03, but if you remember from our higher timeframe analysis above, it’s also supported by daily demand lurking just below it at 120.34-121.01. However, as technically sound as the H4 Quasimodo may appear, price could fake below our H4 level into the aforementioned daily demand. Therefore, we’d recommend only buying from the H4 level with the aid of lower timeframe confirmation. Should all go to plan and we manage to locate a buy setup around 121.06, we’d look to ultimately trail our position behind lower timeframe supports up to psychological resistance 122.00.
Supposing that the 121.00 region gives way, however, all eyes will be on H4 support coming in at 120.69. Not only is this level located deep within the above said daily demand, it also withstood multiple touches in a short space of time early last week, likely indicating strong support. If one is interested in entering long from here using a pending order, we’d recommend placing your stop below the daily demand zone itself. For us, however, we’d still prefer waiting for confirmation from the lower timeframes here due to the possibility price may fake below this daily demand into a daily support area lurking just below it at 120.02-120.44.
Levels to watch/ live orders:
- Buys: 121.06 [Tentative – confirmation required] (Stop loss: dependent on where one confirms this level). 120.69 [Tentative – confirmation required] (Stop loss: dependent on where one confirms this level).
- Sells: Flat (Stop loss: N/A).
USD/CAD:
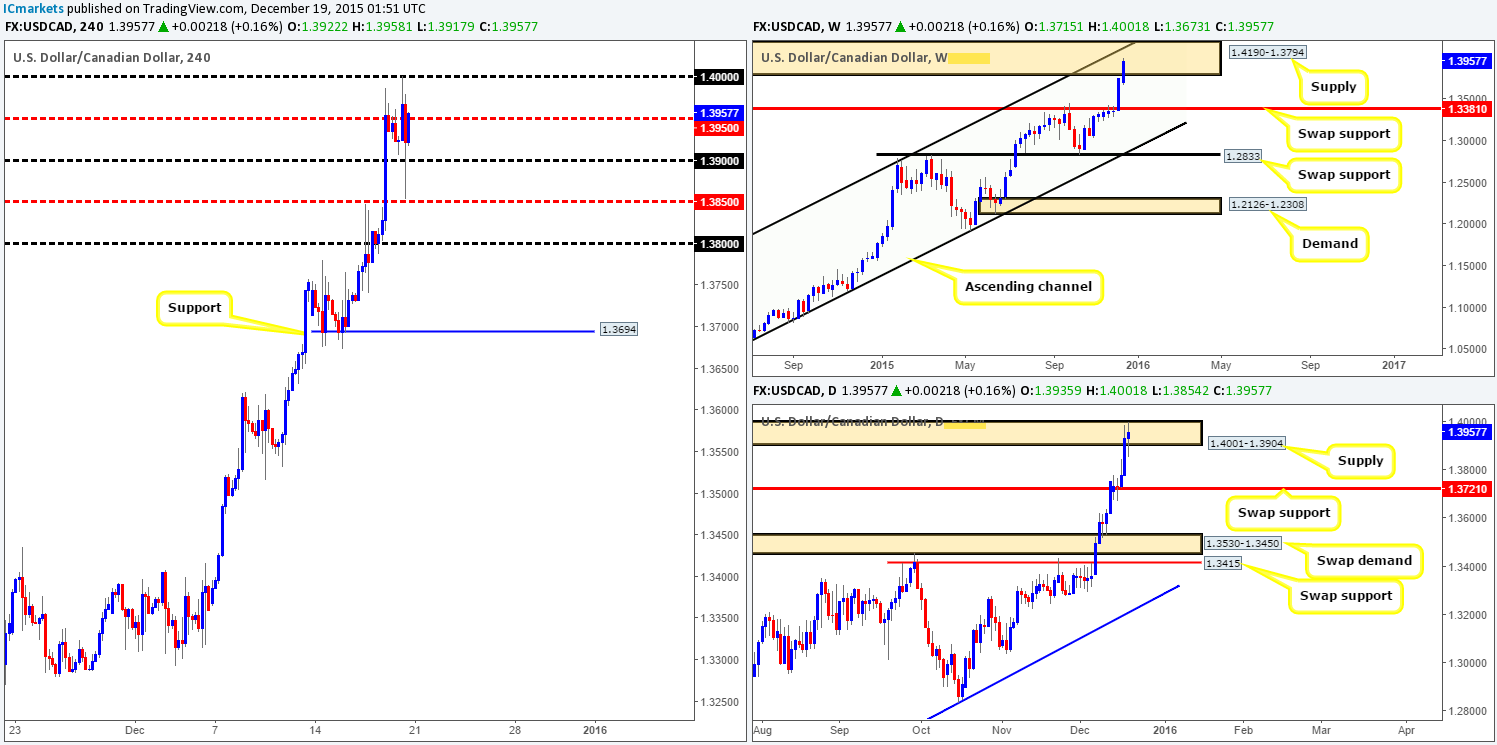
It was yet another depressing week for the Canadian dollar, as the U.S. dollar rallied a further 200 pips into the close 1.3957. This recent surge of buying brought this pair high into a major weekly supply seen at 1.4190-1.3794, which coincides beautifully with a long-term channel resistance taken from the high 1.1172.
Zooming in and looking at the daily picture, shows that this well-bid market drove into the extremes of supply drawn from 1.4001-1.3904 going into the end of the week, with Friday’s candle action printing somewhat of an indecision candle. Should this buying frenzy continue above here this week, we’ll then be watching the swap resistance level at 1.4103 (located deep within the above said weekly supply).
Looking across to the H4 timeframe, we can see that even with disappointing Canadian inflation data, strong offers at the large psychological resistance 1.4000 were able to hold this market lower during the course of Friday’s sessions. In spite of this, the pair still managed to end the week peaking above mid-level resistance 1.3950.
With both the weekly and daily charts showing price trading within supplies right now (see above) and this pair clearly trending north, where do we go from here? Well, for us right now, the 1.4000 figure is key since we believe traders may use this number to cover longs going into the festive period, thus potentially provide a ceiling of resistance which in itself may be tradable.
Therefore, with everything taken into consideration, our team has agreed to take a back seat on this pair and wait for price to hit 1.4000 again before making any further decisions.
Levels to watch/ live orders:
- Buys: Flat (Stop loss: N/A).
- Sells: Flat (Stop loss: N/A).
USD/CHF:
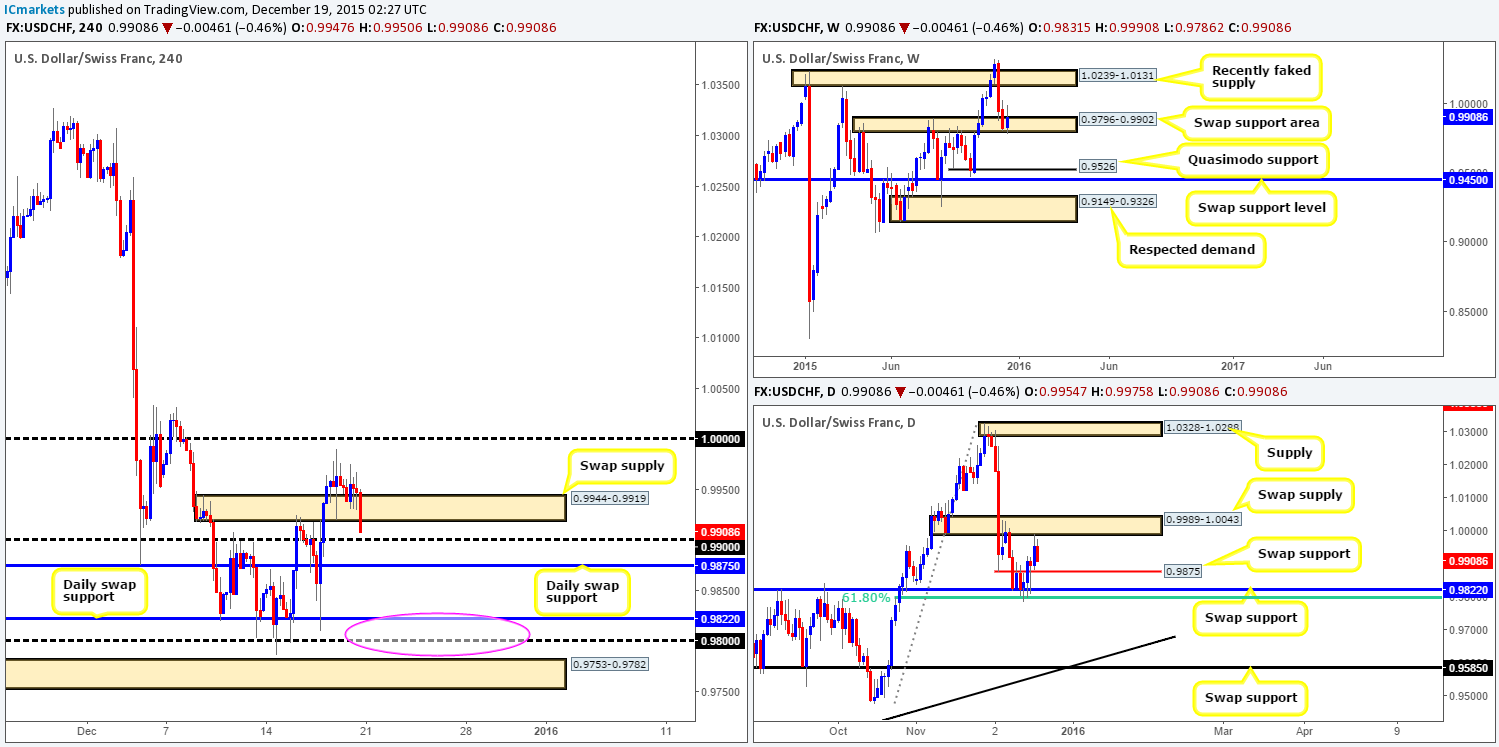
Last week’s candle movement saw renewed buying interest come in from the weekly swap (support) area at 0.9796-0.9902, gaining around 85 pips and concluding trade for the week at 0.9908. On the condition that the buyers are able to maintain this momentum this week, we might, just might, see this pair appreciate back up to the recently faked supply area given at 1.0239-1.0131. On the other hand, a decisive break below the current swap support area could prompt further downside towards a Quasimodo support level at 0.9526.
Branching lower to the daily chart, it’s clear to see that the buyers and sellers are now capped by a swap supply zone coming in at 0.9989-1.0043 and a swap support level at 0.9875. A break above here likely opens the gates for weekly buyers to stretch their legs from the aforementioned weekly swap (support) area, which is something we’d love to be part of. A push below, nonetheless, may allow price to cross swords with swap support at 0.9822 (converges with a 61.8% Fibonacci level at 0.9800), which, in effect, is the last barrier of defense for the current weekly swap area.
Based on Friday’s H4 activity closing below swap demand (now supply) at 0.9944-0.9919, and opening up the possibility for a touch of 0.9900 today, where do we stand this week?
Risk/reward considerations would argue against buying from 0.9900 due to the swap supply lurking just above. By the same token, buying from the daily swap (support) level just below it at 0.9875 is not something we’d label high probability due to probable resistance from 0.9900. Under these circumstances, the only areas we’re likely going to be paying interest to this week are as follows:
- The daily swap (support) level at 0.9822 combined with psychological support 0.9800 and H4 demand at 0.9753-0.9782 (buy zone within pink circle). We’re quite confident a bounce from this region is likely, but to enter at market the stop-loss distance would be too big for us (below the H4 demand itself at 0.9750). Therefore, if we do manage to spot a lower timeframe buy setup within this buy zone, we’d happily take it due to the smaller stop loss required.
- Ultimately, we’d also really like to see parity (1.0000) consumed and retested as support. This would, assuming a lower timeframe buy setup formed following the retest, allow us to buy into this market in an attempt to try and catch a ride with the weekly buyers from the weekly swap (support) area at 0.9796-0.9902.
Levels to watch/ live orders:
- Buys: Watch for offers at 1.0000 to be consumed and then look to trade any retest seen thereafter (confirmation required). 0.9822/0.9782 [Tentative – confirmation required] (Stop loss: dependent on where one confirms this area).
- Sells: Flat (Stop loss: N/A).
DOW 30
The DOW suffered further losses last week, closing 165 points in the red below a weekly swap (support-turned resistance) at 17135. Contingent upon the sellers remaining dominant below this level this week, the next downside target to keep an eye on can be seen at 16935 – a minor weekly swap (support) level.
By contrast, the daily picture shows that price is now within touching distance of hitting demand seen at 16889-17056. This could, as it ties in nicely with the minor weekly swap (support) level mentioned above, potentially hold this market higher this week.
Moving down into the pits of the H4 timeframe, one can see prices heavily sold off from the underside of swap resistance at 17440 going into the close 17093. To our way of seeing things right now, as long as the sellers hold the market below the recently broken weekly swap (support) level, then price, at least on the H4 timeframe, appears free to continue selling off until reaching demand coming in at 16889-16976.
With all the above taken on board, battle lines going into today’s sessions and possibly into the week are as follows:
For buys:
- We’re looking at the H4 demand drawn from 16889-16976. Not only is this beast surrounded by a daily demand at 16889-17056, it’s also positioned around the minor weekly swap (support) barrier at 16935. Dependent on the approach and the time of day, we would likely consider a market entry here.
For sells:
- Should price retest the recently broken weekly level 17135 as resistance along with a lower timeframe sell setup, we’d jump in short here and look to ride the wave down to our buy zone (see above).

Levels to watch/ live orders:
- Buys: 16889-16976 [Tentative – confirmation required] (Stop loss: dependent on where one confirms this area).
- Sells: 17135 [Tentative – confirmation required] (Stop loss: dependent on where one confirms this level).
XAU/USD: (Gold)
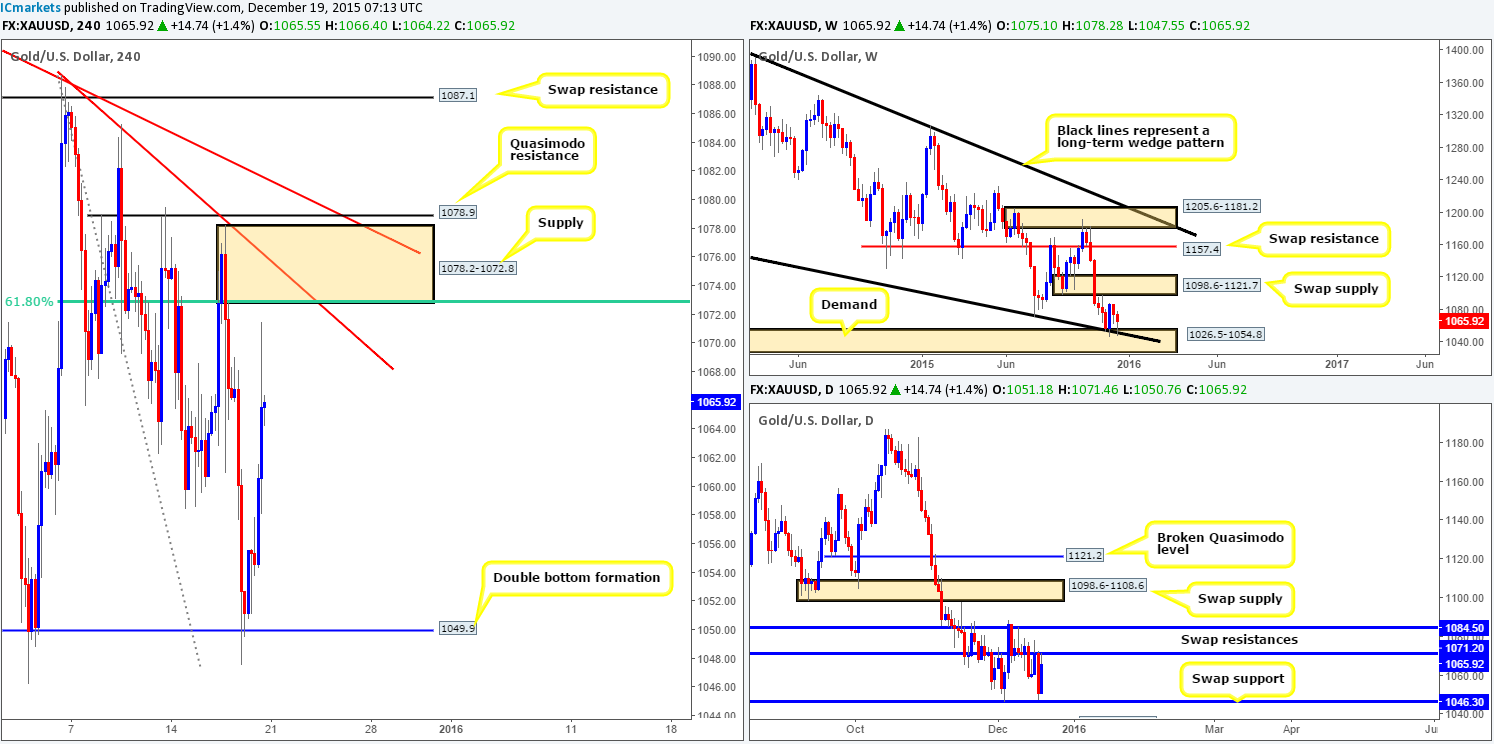
Although last week’s trading saw the yellow metal lose close to $10 in value at the close 1065.9, price continues to find supportive bids around demand at 1026.5-1054.8 (merges with the lower limit of a long-term wedge pattern from the low 1180.1). Assuming that the buyers remain defensive here, the next upside target in the firing range can be seen at 1098.6-1121.7 – a weekly swap (supply) zone.
As we scroll down to the daily picture, we can see that volatility picked up going into Thursday’s trade. Gold sold off from swap resistance at 1071.2 down to just above a swap support at 1046.3, which just as quickly whipsawed back up to 1071.2 by the week’s end. We believe that if a daily close above this level is seen this week, then this would set the stage for a rally higher up to at least swap resistance coming in at 1084.5, and even possibly up to the swap supply at 1098.6-1108.6 (coincides with the weekly swap [supply] zone at 1098.6-1121.7).
Stepping down one more level to the H4 shows us that following a rebound from the 1049.9 region late on Thursday, Gold aggressively extended higher going into the American session on Friday, reaching highs of 1071.4 by the day’s end. This recent movement has opened up what looks to be a nice-looking sell opportunity this week.
Check out the H4 supply area fixed between 1078.2-1072.8. Not only does this area merge with a H4 trendline taken from the high 1088.7 and the widely-respected 61.8% Fibonacci number at 1072.8, it’s also trading just above the daily swap (resistance) level at 1071.2. The only drawback we see to a short here is obviously the fact that weekly buyers are currently defending demand at 1026.5-1054.8, and the fact that there is a H4 Quasimodo resistance level at 1078.9 lurking just above our chosen H4 supply (fakeout possible). All this means, at least for us anyway, is we will not be placing any pending orders here, and will only trade if lower timeframe confirmation is seen.
In the event that this does not come to fruition, and Gold drops from current prices, all eyes will then be on the double bottom support at 1049.9 for possible longs. This barrier boasts confluence from a daily swap (support) level at 1046.3 and also from weekly demand just mentioned above.
Levels to watch/ live orders:
- Buys: 1049.9 [Tentative – confirmation required] (Stop loss: dependent on where one confirms this level).
- Sells: 1078.2-1072.8 [Tentative – confirmation required] (Stop loss: dependent on where one confirms this area).


