
DXY:
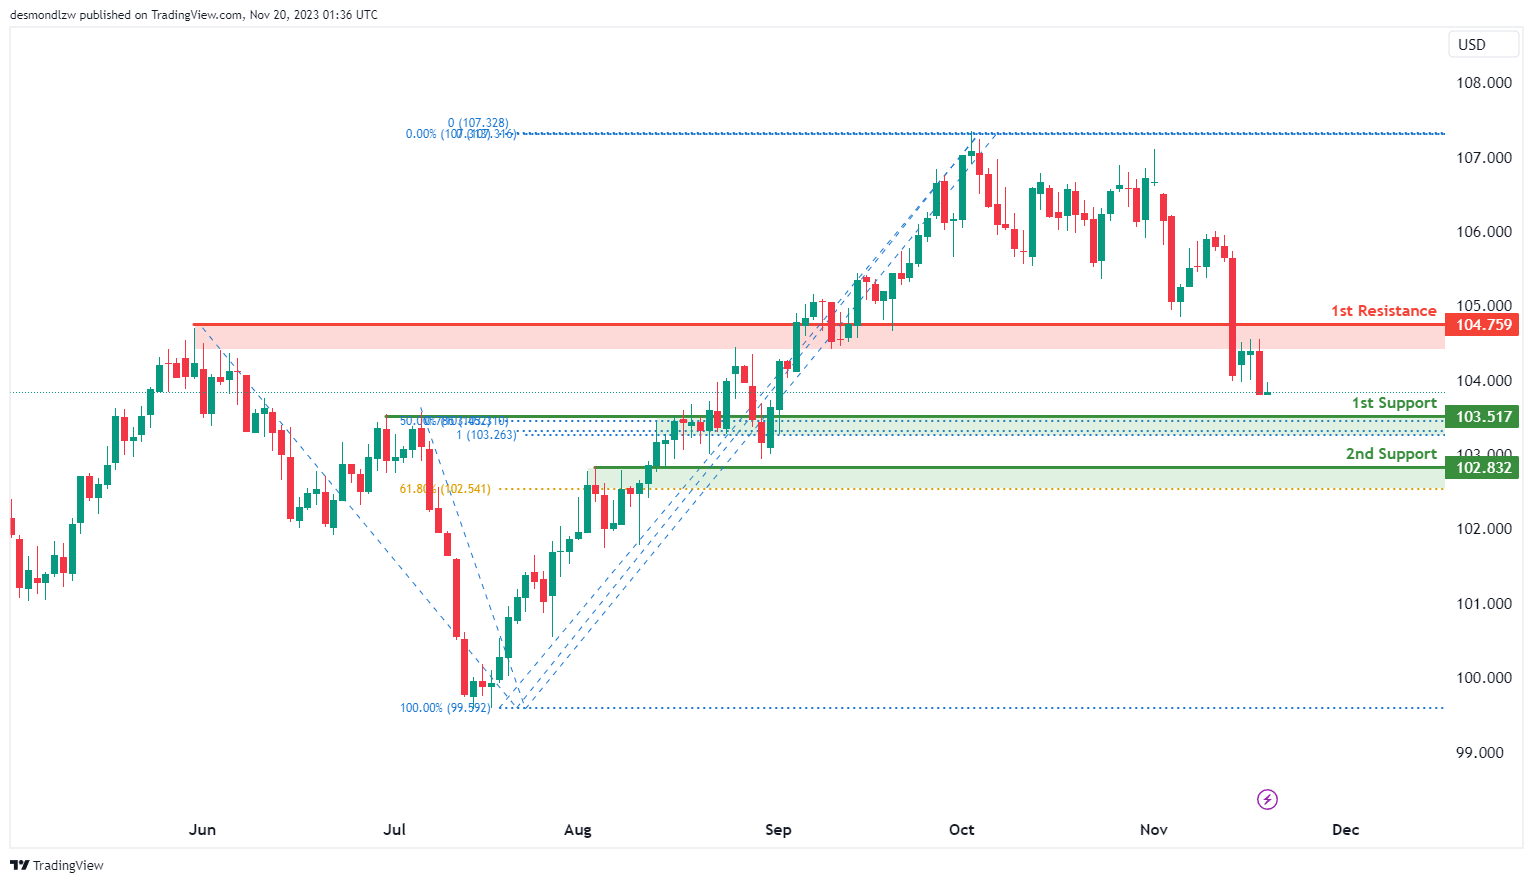
The DXY (US Dollar Index) chart currently has a bullish overall momentum, suggesting the potential for a bullish bounce off the 1st support level, with a potential move towards the 1st resistance.
The 1st support at 103.51 is identified as a pullback support and coincides with the 50% Fibonacci Retracement level. This confluence of support factors suggests that there could be a significant level of buying interest or a pause in the bearish movement around this area.
The 2nd support at 102.83 is considered an overlap support, further reinforcing its potential as a support level.
On the resistance side, the 1st resistance at 107.75 is categorized as an overlap resistance. This level may act as a barrier to further upward movement, and traders may expect selling interest in this area.
EUR/USD:
The EUR/USD chart currently has a bearish overall momentum, suggesting the potential for a bearish
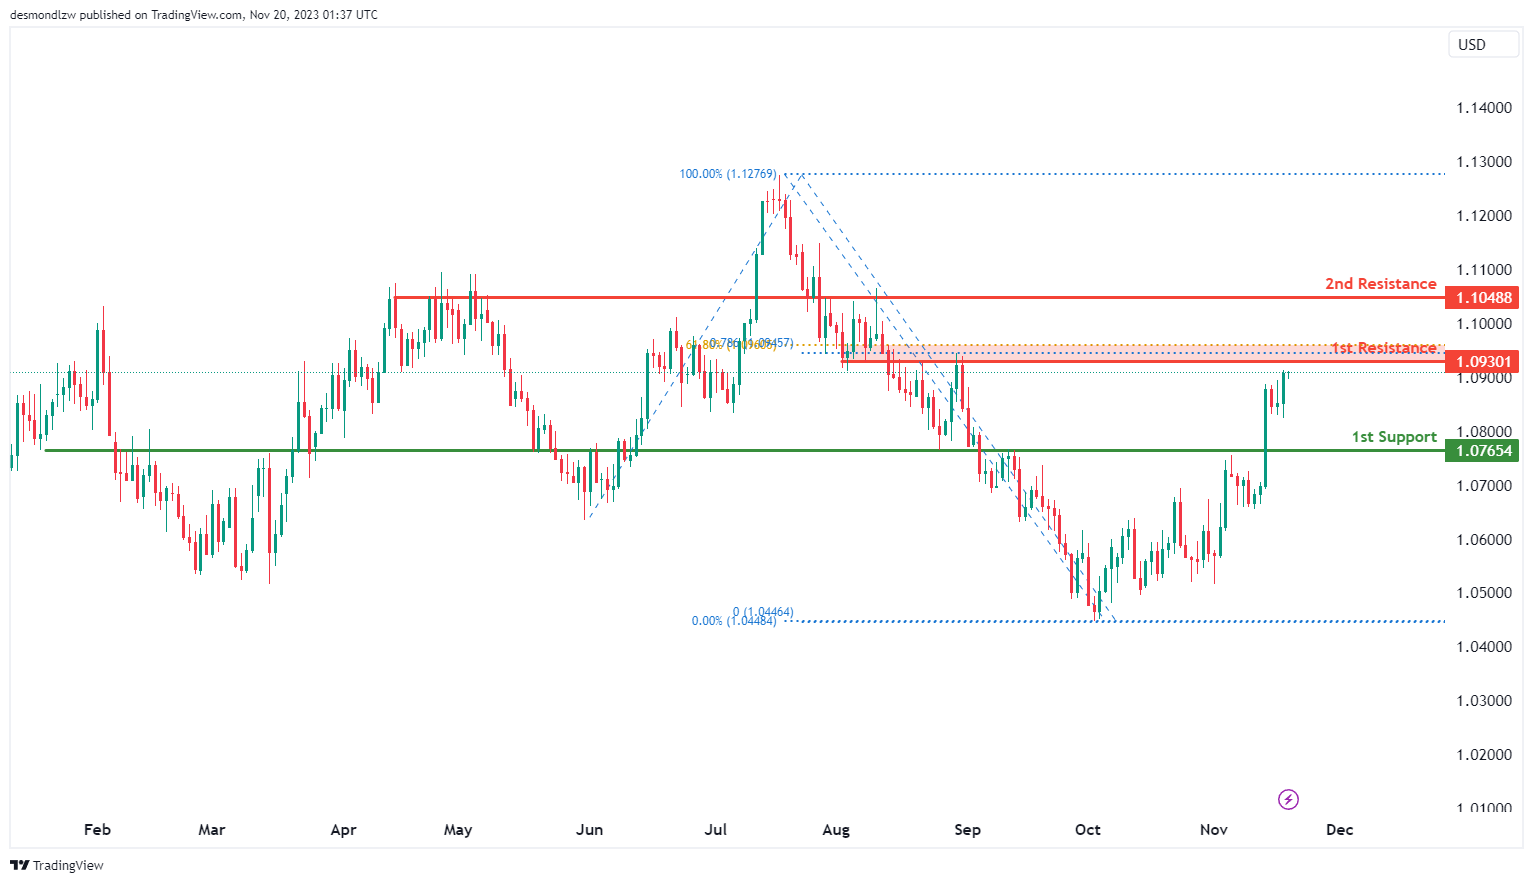
The EUR/USD chart currently has a bearish overall momentum, suggesting the potential for a bearish reaction off the 1st resistance level with a potential drop towards the 1st support.
The 1st support at 1.0765 is identified as a pullback support, indicating a level where buyers may step in or where the bearish movement could pause.
On the resistance side, the 1st resistance at 1.0930 is considered a significant level of pullback resistance. This level coincides with the 61.80% Fibonacci Retracement and the 78.60% Fibonacci Projection, indicating a strong area of potential selling interest and Fibonacci confluence.
The 2nd resistance at 1.1048 is categorized as an overlap resistance, suggesting another potential level where the price may encounter selling pressure during its bearish reaction.
EUR/JPY:
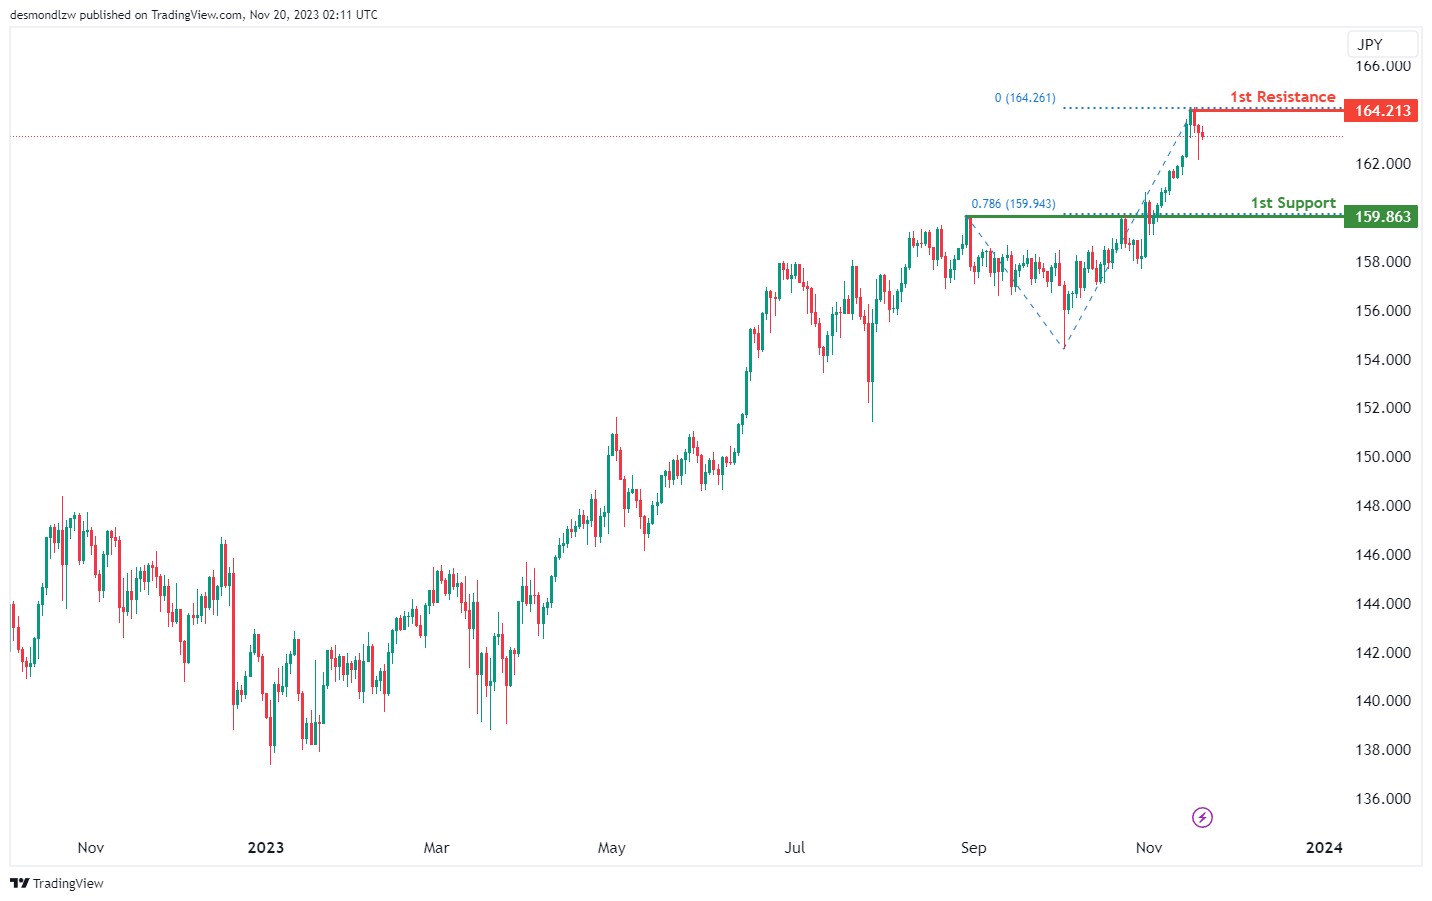
The EUR/JPY chart currently indicates a bearish momentum, suggesting a potential bearish continuation towards the first support at 159.86.
The first support at 159.86 is identified as a pullback support, coinciding with the 78.60% Fibonacci Projection, indicating a significant level where the price might find support and potentially rebound.
On the resistance side, the first resistance at 164.21 represents a point of swing high resistance, marking a crucial level where the price might face selling pressure. This swing high resistance is a significant hurdle for the price and could influence the continuation of the bearish trend.
EUR/GBP:
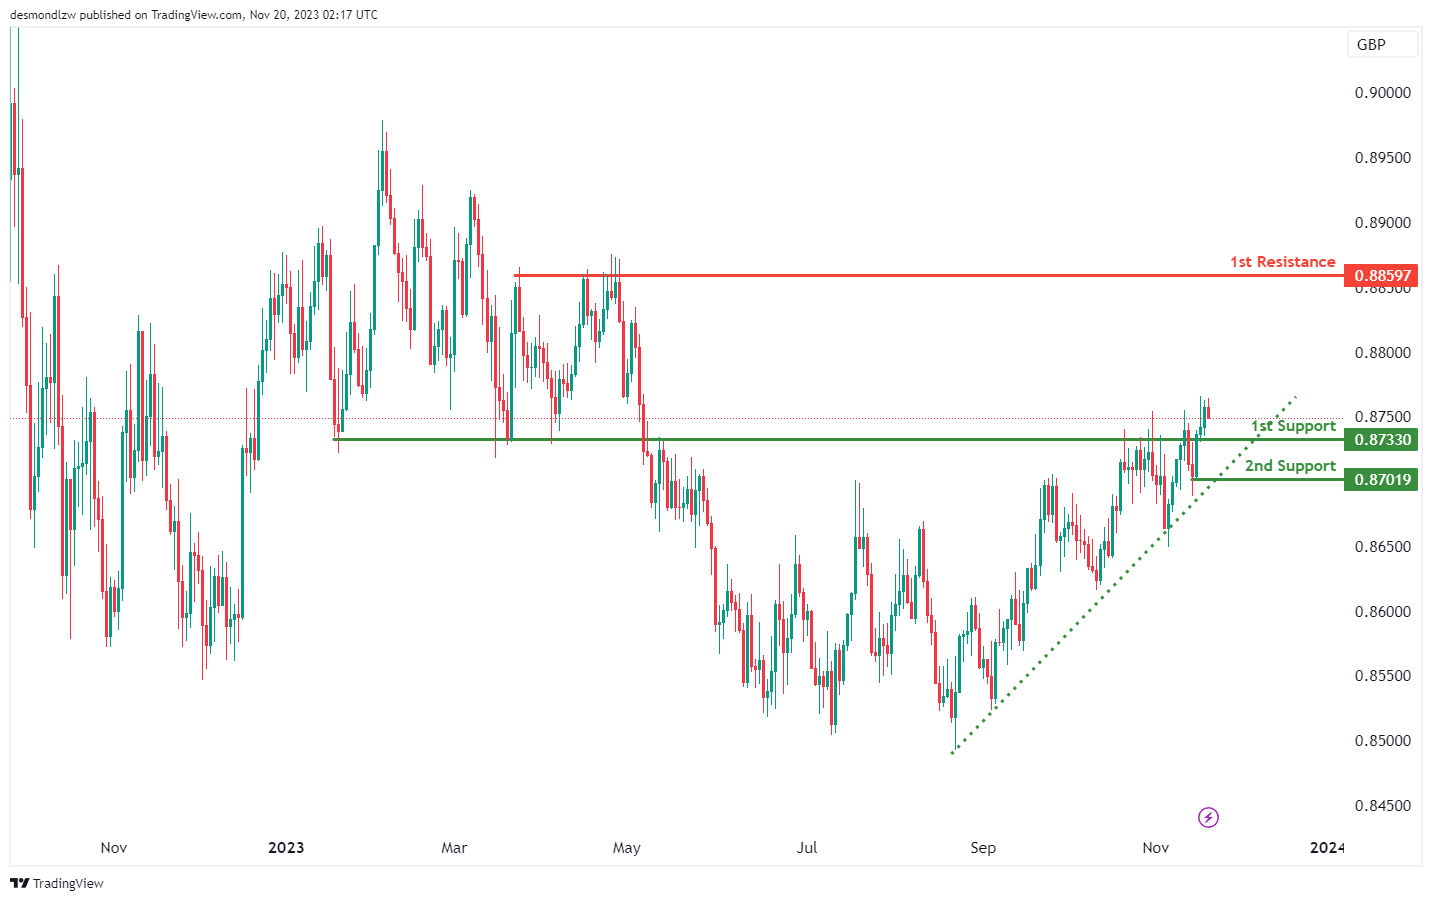
The EUR/GBP chart currently exhibits a bullish momentum, supported by the fact that the price is above a major ascending trend line, indicating the likelihood of further bullish movement.
There is a potential scenario where the price could drop further in the short term to the first support at 0.8733 before bouncing from there and rising towards the first resistance at 0.8859.
The first support at 0.8733 is identified as a pullback support, indicating a potential level where the price might find support and rebound. Additionally, the second support at 0.8701 is recognized as a swing low support, reinforcing the potential strength of the support zone.
On the resistance side, the first resistance at 0.8859 represents a point of multi-swing high resistance, suggesting a crucial level where the price might face selling pressure. This level is important for traders to monitor as it could influence the continuation of the bullish trend.
GBP/USD:
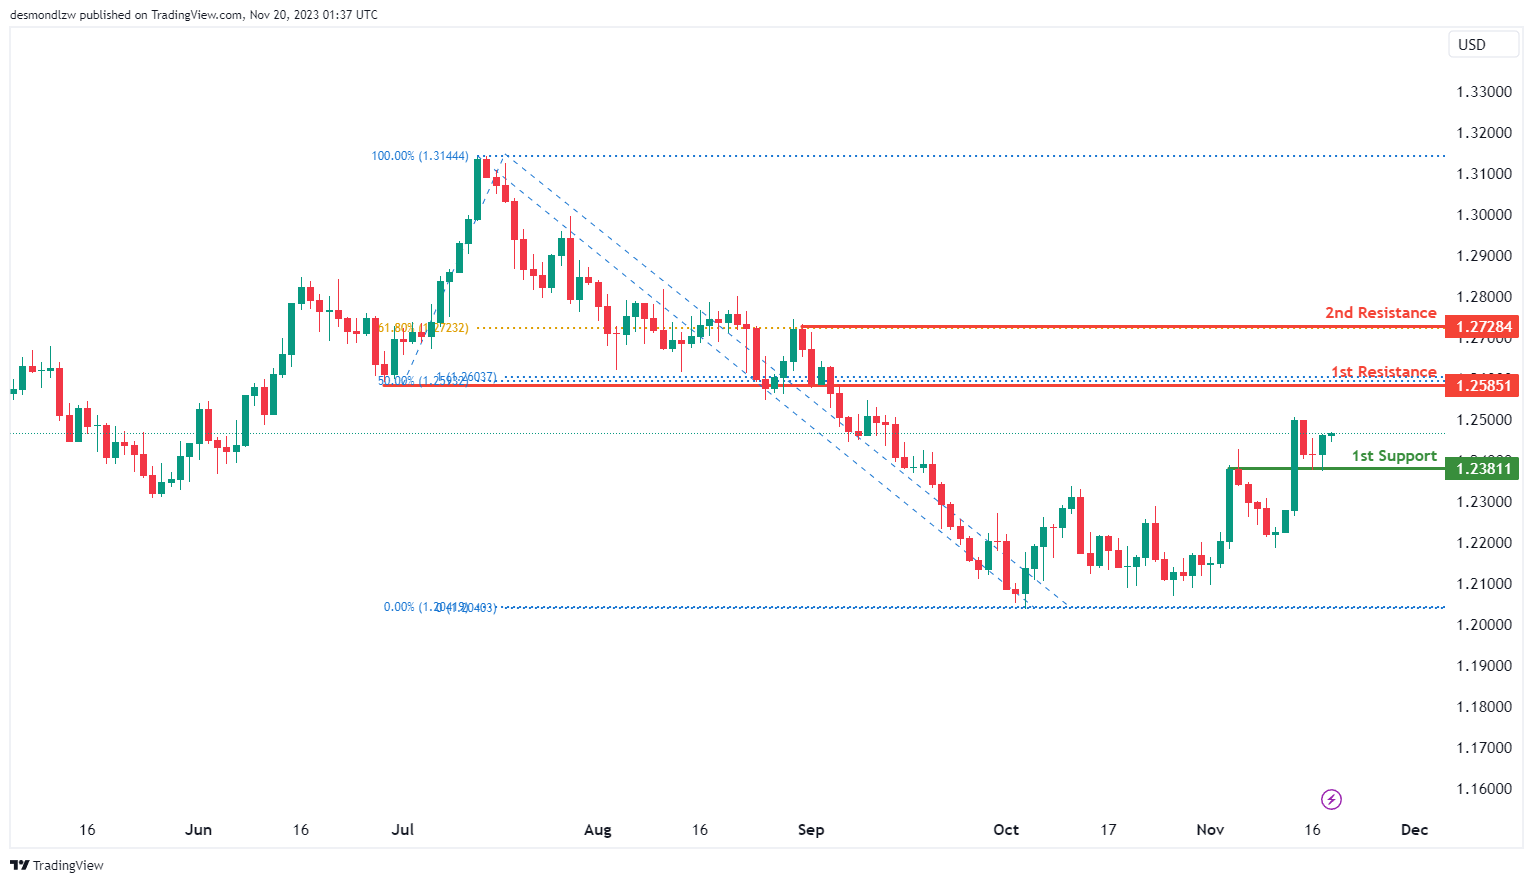
The GBP/USD chart currently has a bearish overall momentum, suggesting the potential for a bearish reaction off the 1st resistance level with a potential drop towards the 1st support.
The 1st support at 1.2381 is identified as an overlap support, indicating a level where buying interest or a pause in the bearish movement may occur.
On the resistance side, the 1st resistance at 1.2585 is considered a significant level of pullback resistance. This level coincides with the 50% Fibonacci Retracement, making it a relevant area for potential selling interest.
The 2nd resistance at 1.2728 is also noteworthy as it aligns with the 61.80% Fibonacci Retracement level, further reinforcing its potential as a resistance level where the price may encounter selling pressure during its bearish reaction.
GBP/JPY:
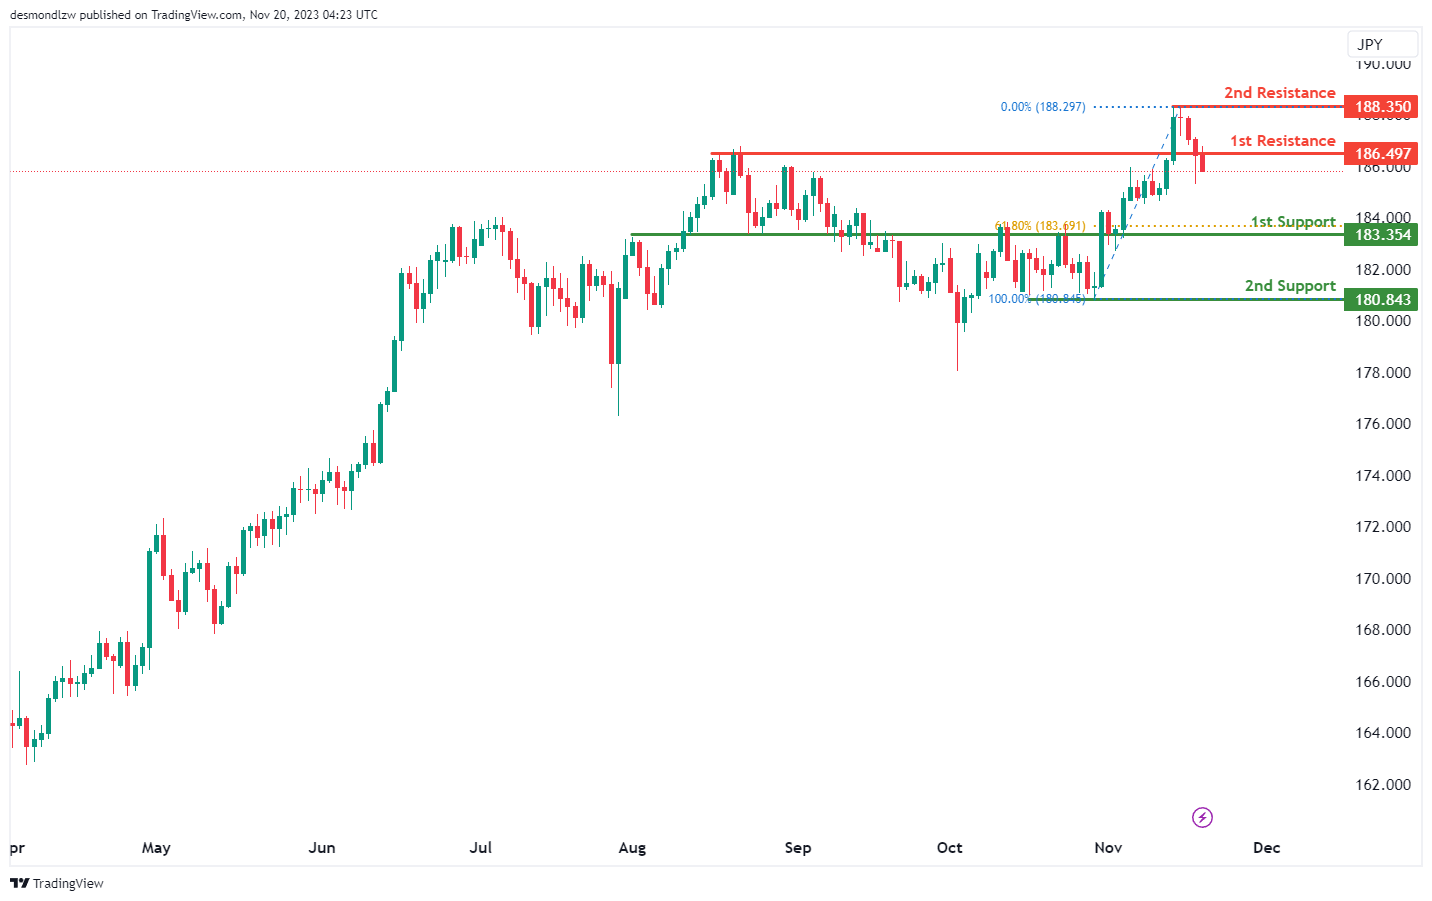
The GBP/JPY chart currently suggests a bearish momentum, indicating a potential bearish continuation towards the first support at 183.35.
The first support at 183.35 is significant as an overlap support, coinciding with the 61.80% Fibonacci Retracement. This indicates a strong level of potential support, suggesting it might serve as a key area for a potential price rebound.
Additionally, the second support at 180.84 is identified as a multi-swing low support, further reinforcing the potential strength of the support zone.
On the resistance side, the first resistance at 186.49 represents a point of pullback resistance, indicating a potential area where the price might face selling pressure. Furthermore, the second resistance at 188.35 is characterized as a swing high resistance, marking another level where the price might encounter obstacles within its downward movement.
USD/CHF:
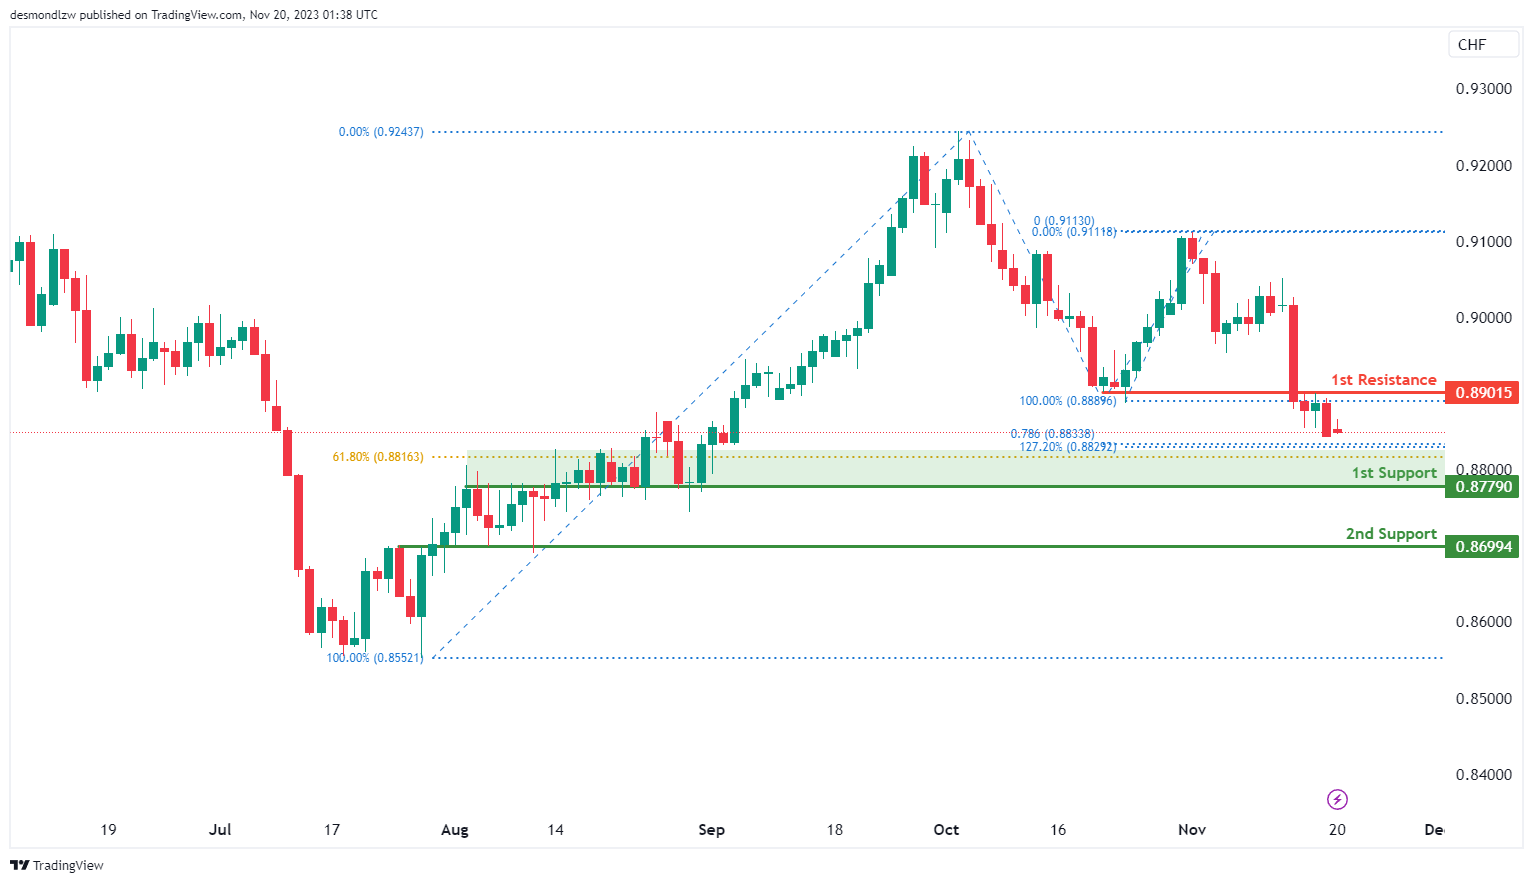
The USD/CHF chart currently has a bullish overall momentum, suggesting the potential for a bullish bounce off the 1st support level with a potential move towards the 1st resistance.
The 1st support at 0.8779 is identified as a strong support level, primarily due to its confluence with the 61.80% Fibonacci Retracement and the 127.20% Fibonacci Extension. This level suggests that there could be a significant level of support, and traders may expect the price to find buying interest or experience a bounce from this area.
The 2nd support at 0.8699 is also an overlap support, further reinforcing its potential as a support level where buyers may step in.
On the resistance side, the 1st resistance at 0.8901 is categorized as an overlap resistance. This level indicates a potential area of selling interest where traders might consider taking profits or initiating short positions.
USD/JPY:
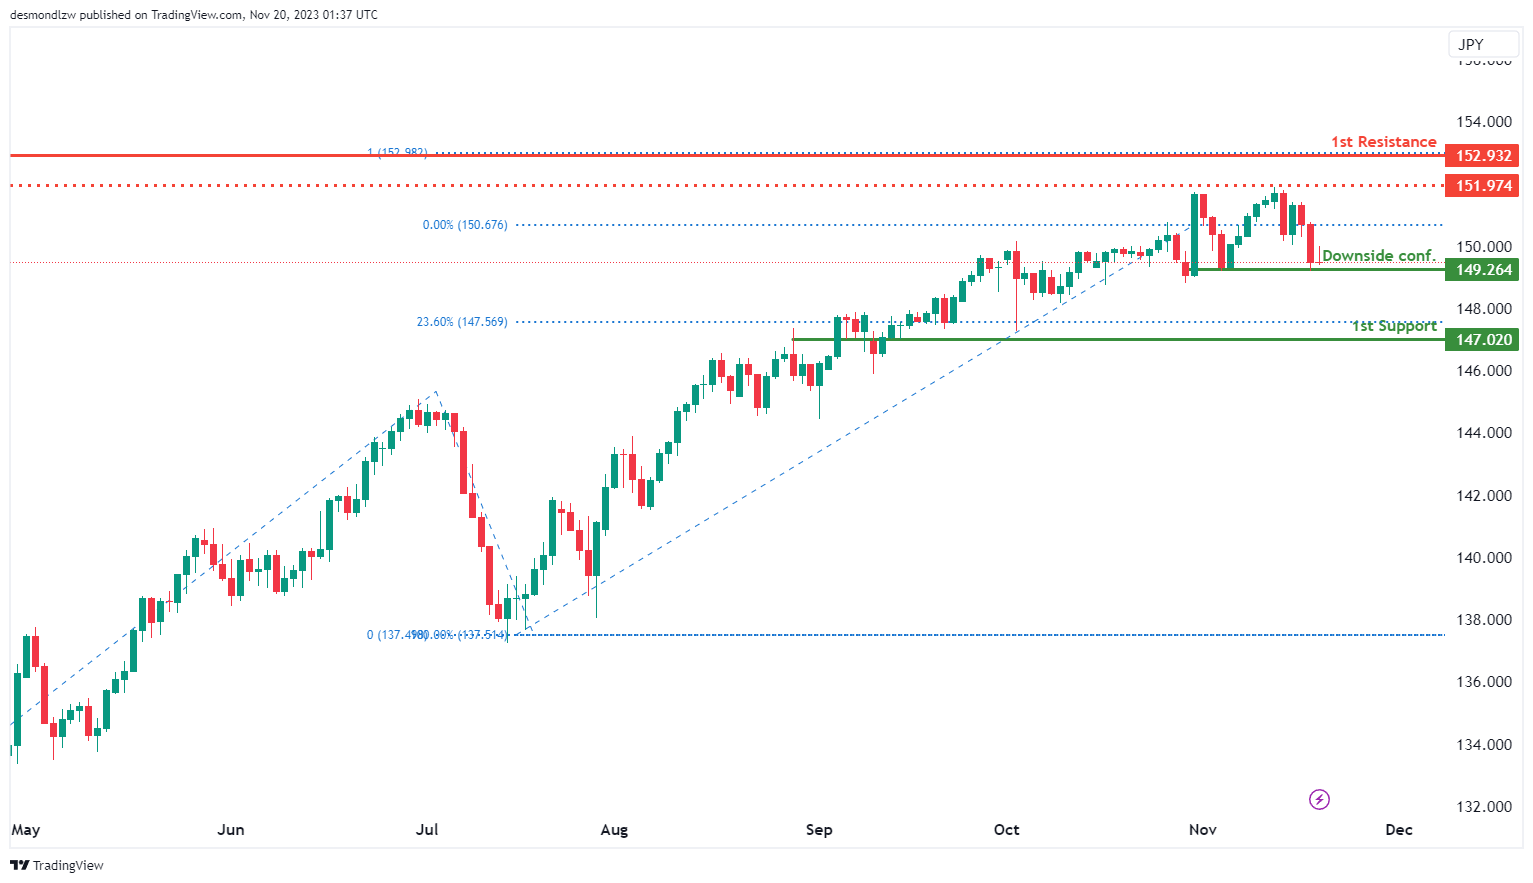
The USD/JPY chart currently has a bearish overall momentum, suggesting the potential for a bearish continuation towards the 1st support level.
The 1st support at 147.02 is identified as an overlap support and coincides with the 23.60% Fibonacci Retracement level. This level indicates that there could be a significant level of support, and traders may expect the price to find buying interest or experience a pause in the bearish movement around this area.
There is also a waiting for downside confirmation level at 149.26, which is considered a swing low support. Traders may monitor this level for potential confirmation of further downside movement.
On the resistance side, the 1st resistance at 152.93 is categorized as a swing high resistance and coincides with the 100% Fibonacci Projection. This level suggests that there could be selling interest in this area, potentially acting as a barrier to further upward movement.
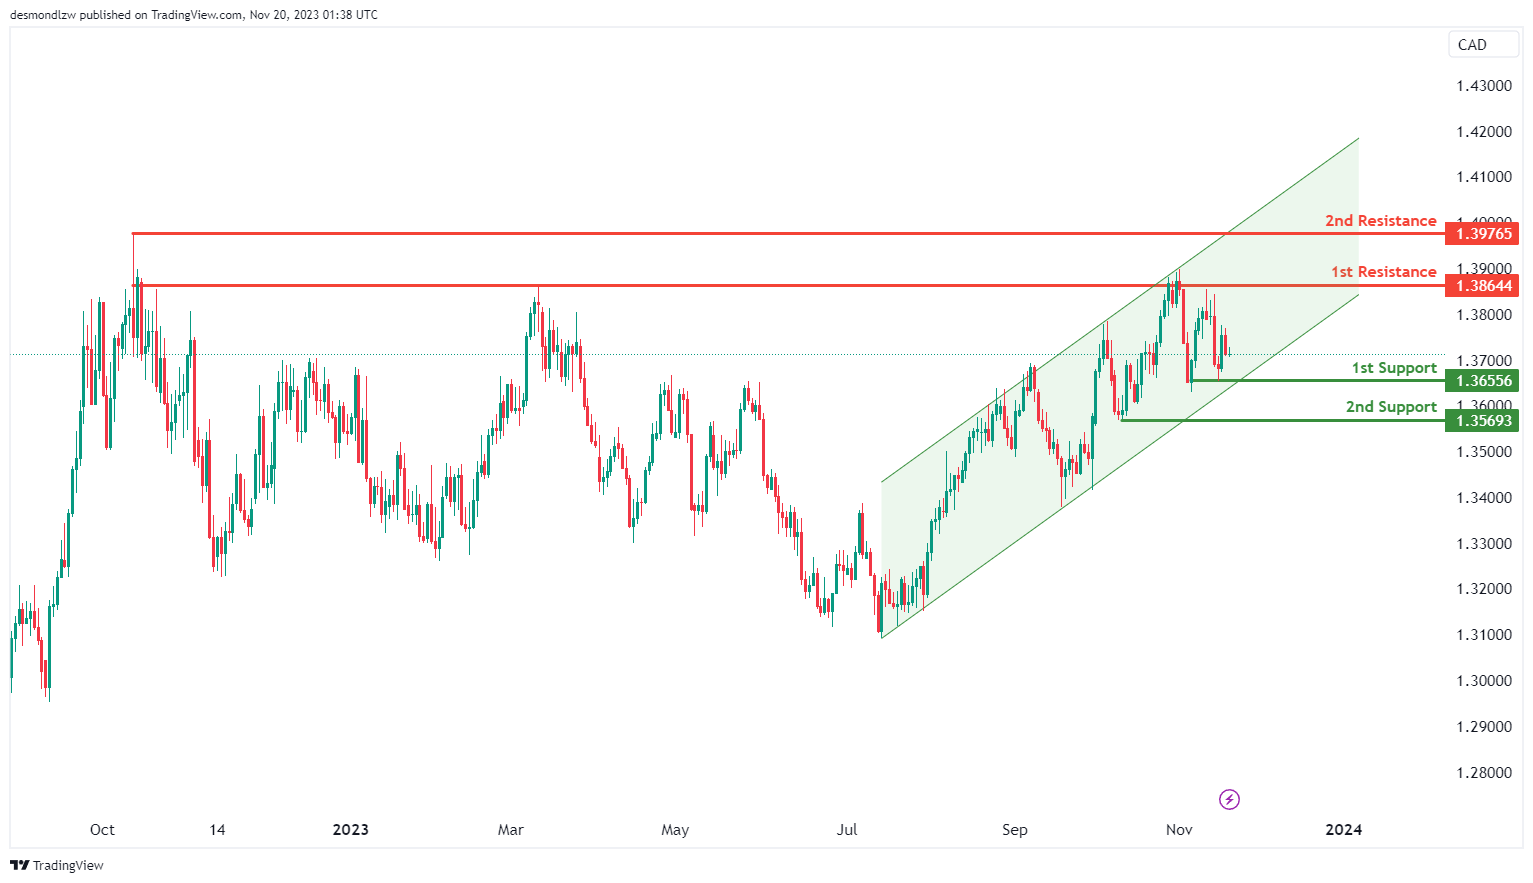
USD/CAD:
The USD/CAD chart currently exhibits a bearish overall momentum, indicating the potential for a bearish The USD/CAD chart currently exhibits a bullish overall momentum as it is within a bullish ascending channel. This suggests the potential for a bullish bounce off the 1st support level and a continuation towards the 1st resistance.
The 1st support at 1.3655 is considered a swing low support, indicating a level where buyers have previously shown interest in the currency pair. This support level may act as a potential area for a bullish bounce.
The 2nd support at 1.3569 is another swing low support level, further reinforcing the potential for price to find support in this region.
On the resistance side, the 1st resistance at 1.3864 is categorized as an overlap resistance, while the 2nd resistance at 1.3976 is noted as a swing high resistance. These resistance levels may act as barriers to further upward movement, where selling interest could potentially emerge.
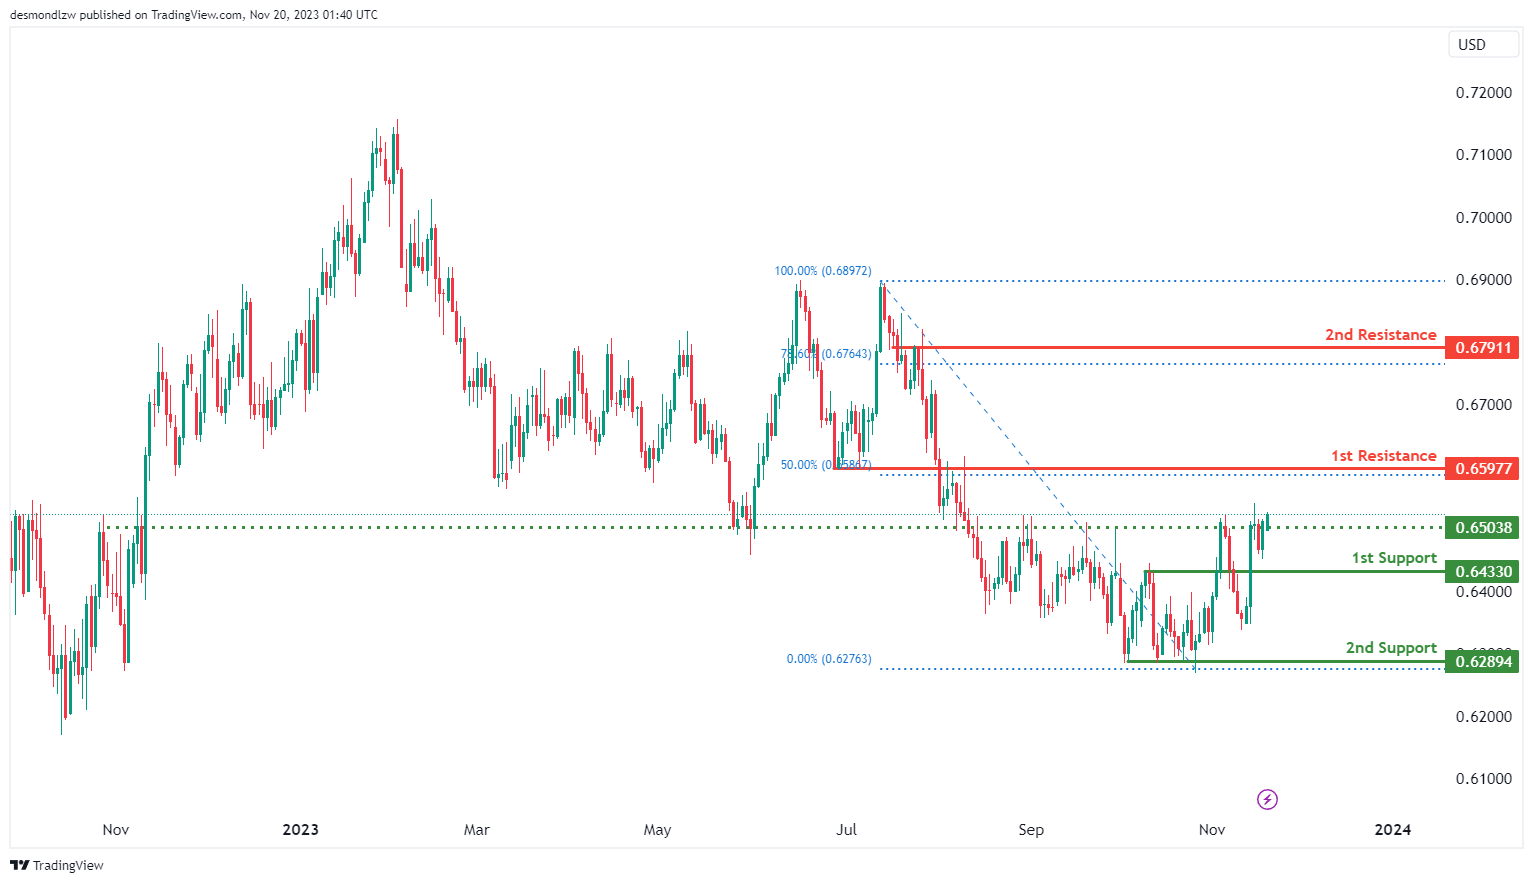
AUD/USD:
The AUD/USD chart currently has a bearish overall momentum, suggesting the potential for a bearish reaction off the 1st resistance level and a drop towards the 1st support.
The 1st support at 0.6433 is considered a pullback support, indicating a level where buyers may potentially step in or where a pause in the bearish movement could occur.
The 2nd support at 0.6289 is a multi-swing low support, signifying that it has acted as a relevant support level in the past, making it another area where buyers might show interest.
On the resistance side, the 1st resistance at 0.6597 is categorized as an overlap resistance and also coincides with the 50% Fibonacci Retracement level. This level suggests that there could be selling interest in this area, potentially acting as a barrier to further upward movement.
The 2nd resistance at 0.6791 is noted as an overlap resistance and coincides with the 78.60% Fibonacci Retracement level, indicating another potential level where the price may encounter selling pressure during its bearish continuation.
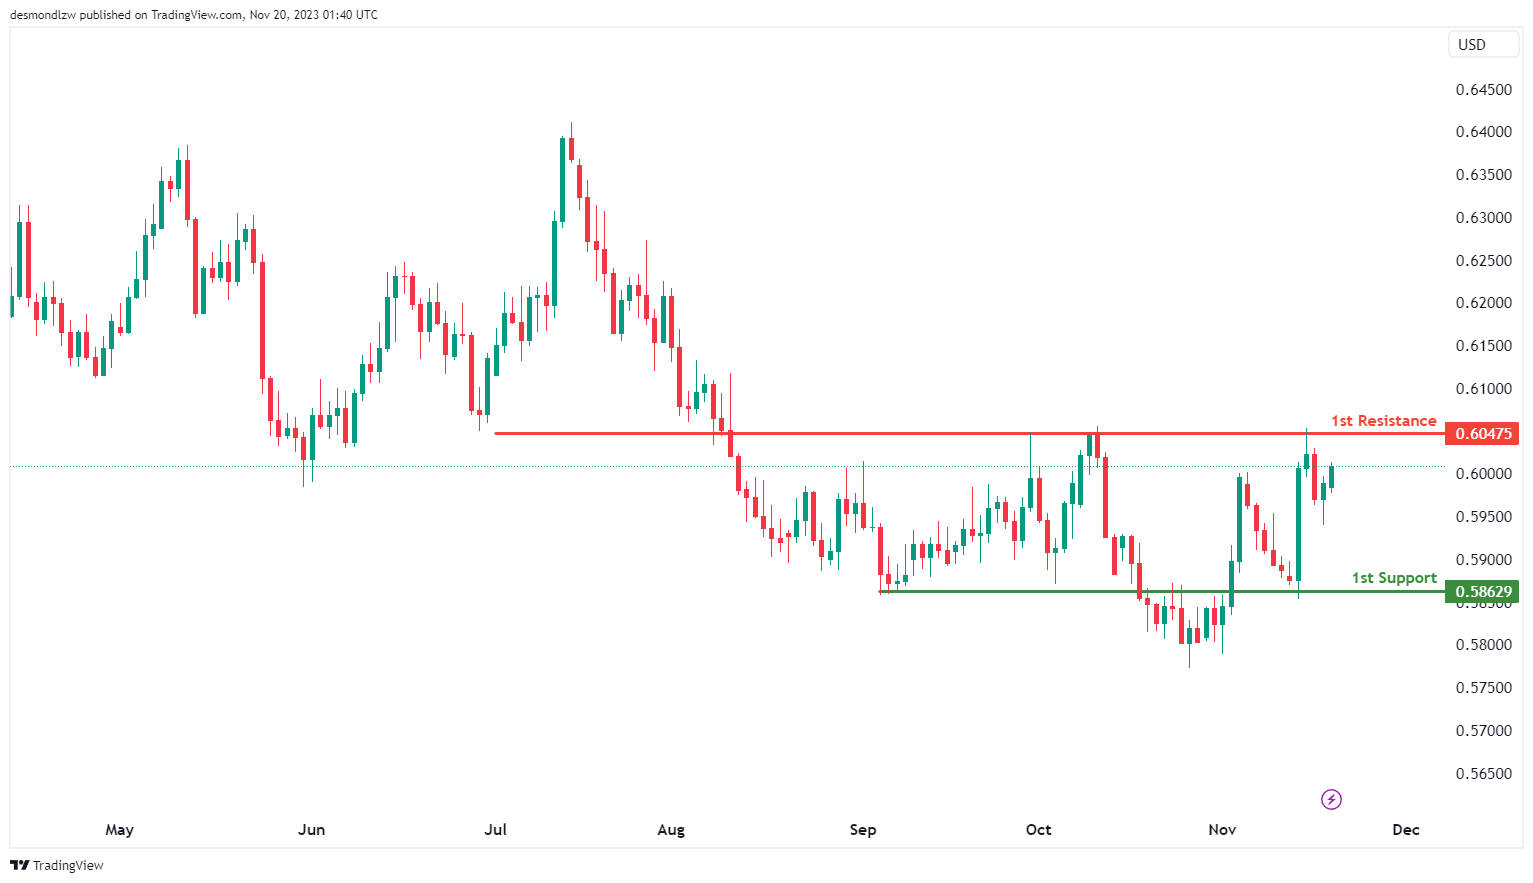
NZD/USD
The NZD/USD chart currently has a bearish overall momentum, suggesting the potential for a bearish reaction off the 1st resistance level and a drop towards the 1st support.
The 1st support at 0.5862 is identified as an overlap support, indicating a level where buyers have shown interest in the past, making it a relevant support level. Traders may expect the price to find buying interest or experience a pause in the bearish movement around this area.
On the resistance side, the 1st resistance at 0.6047 is categorized as an overlap resistance, signifying a level where selling interest may be concentrated, potentially acting as a barrier to further upward movement.
.
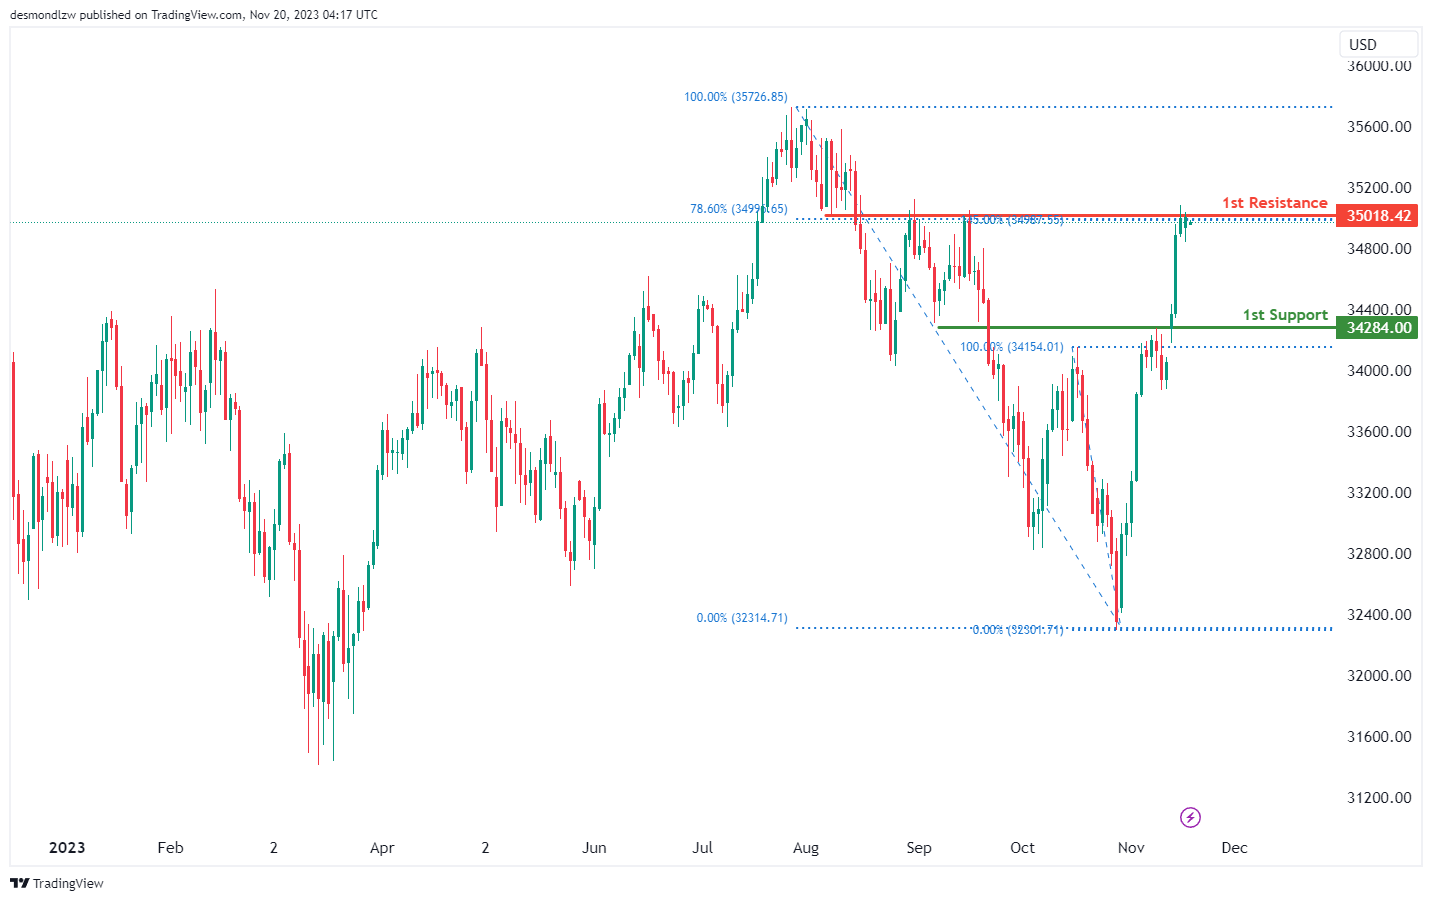
DJ30:
The DJ30 chart currently suggests a bearish momentum, indicating a potential bearish reaction off the first resistance at 35018.42, with a subsequent drop towards the first support at 34299.59.
The first support at 34299.59 is identified as a pullback support, suggesting a level where the price might find support and potentially rebound.
On the resistance side, the first resistance at 35018.42 is significant due to its overlap resistance, as well as the confluence with the 78.60% Fibonacci Retracement and the 145.00% Fibonacci Extension. This indicates a strong level of potential resistance, emphasizing its importance as a potential barrier for the price and a point where it might face selling pressure.
GER40:
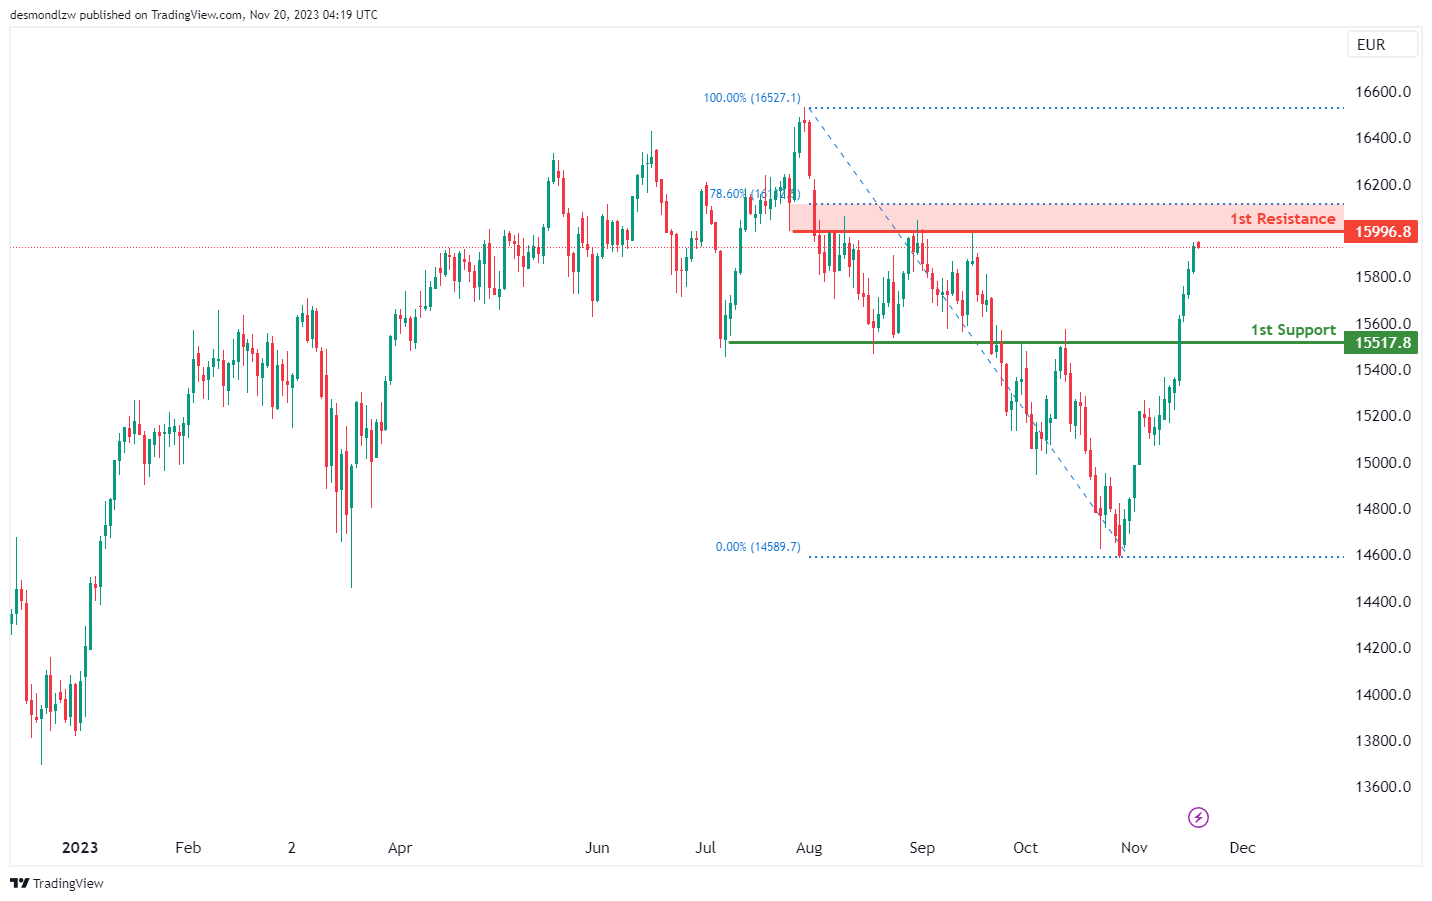
The GER40 chart currently displays a bearish momentum, suggesting a potential bearish reaction off the first resistance at 15996.8, with a subsequent drop towards the first support at 15517.8.
The first support at 15517.8 is identified as a pullback support, indicating a potential level where the price might find support and potentially rebound.
On the resistance side, the first resistance at 15996.8 is significant due to its overlap resistance and the confluence with the 78.60% Fibonacci Retracement. This suggests a strong level of potential resistance, emphasizing its importance as a potential barrier for the price and a point where it might face selling pressure, contributing to the bearish momentum.
.
`US500
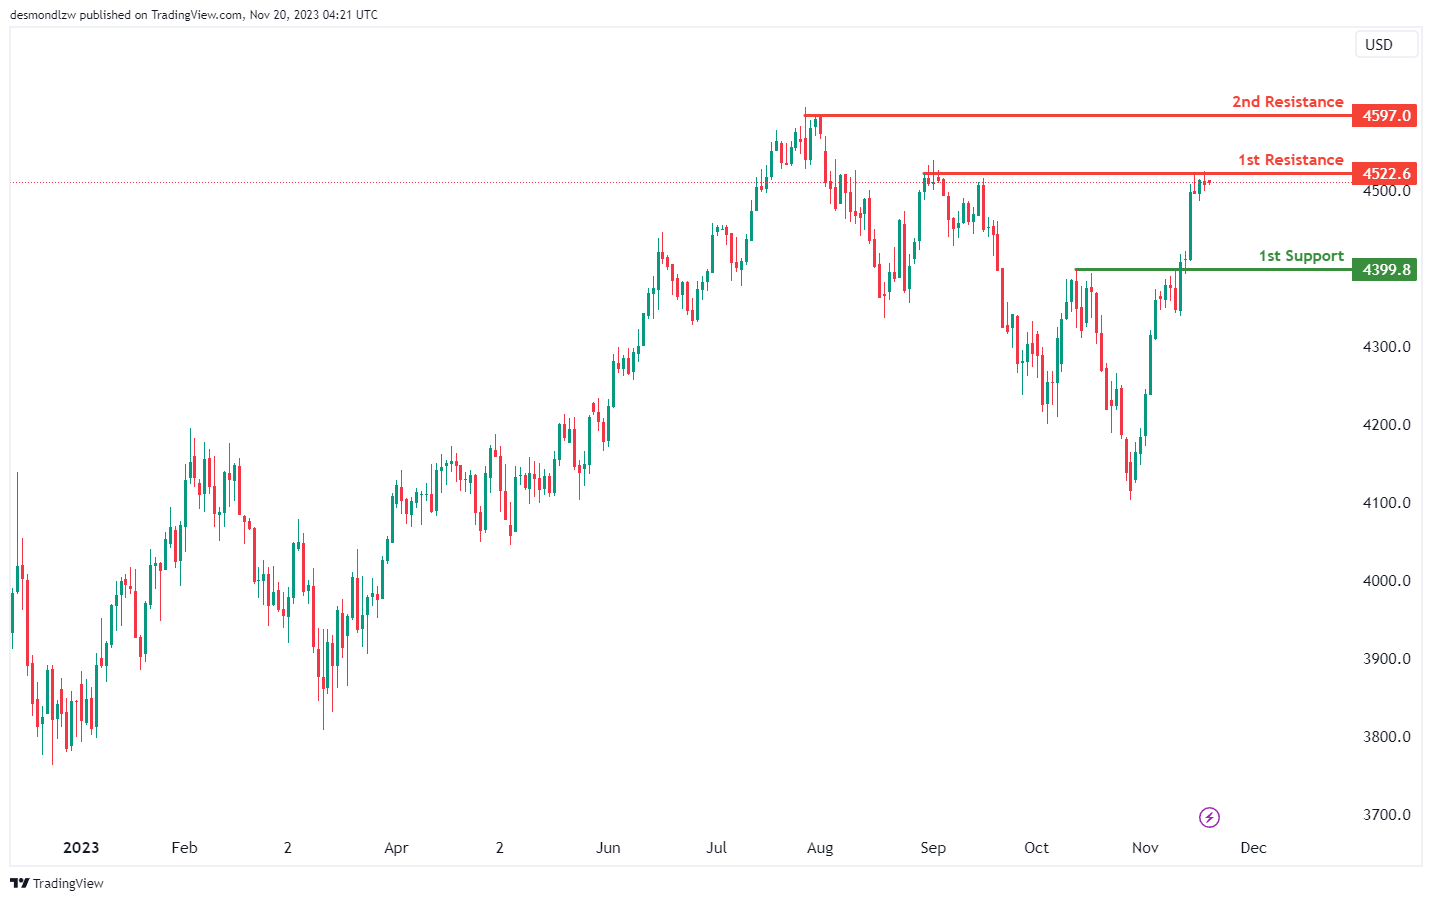
The US500 chart currently indicates a bearish momentum, suggesting a potential bearish reaction off the first resistance at 4522.6, with a subsequent drop towards the first support at 4399.8.
The first support at 4399.8 is identified as a pullback support, indicating a potential level where the price might find support and potentially rebound.
On the resistance side, the first resistance at 4522.6 represents a point of multi-swing high resistance, suggesting a crucial level where the price might face selling pressure. Furthermore, the second resistance at 4597.0 is characterized as a swing high resistance, marking another potential level where the price might encounter obstacles within its downward movement.
BTC/USD:
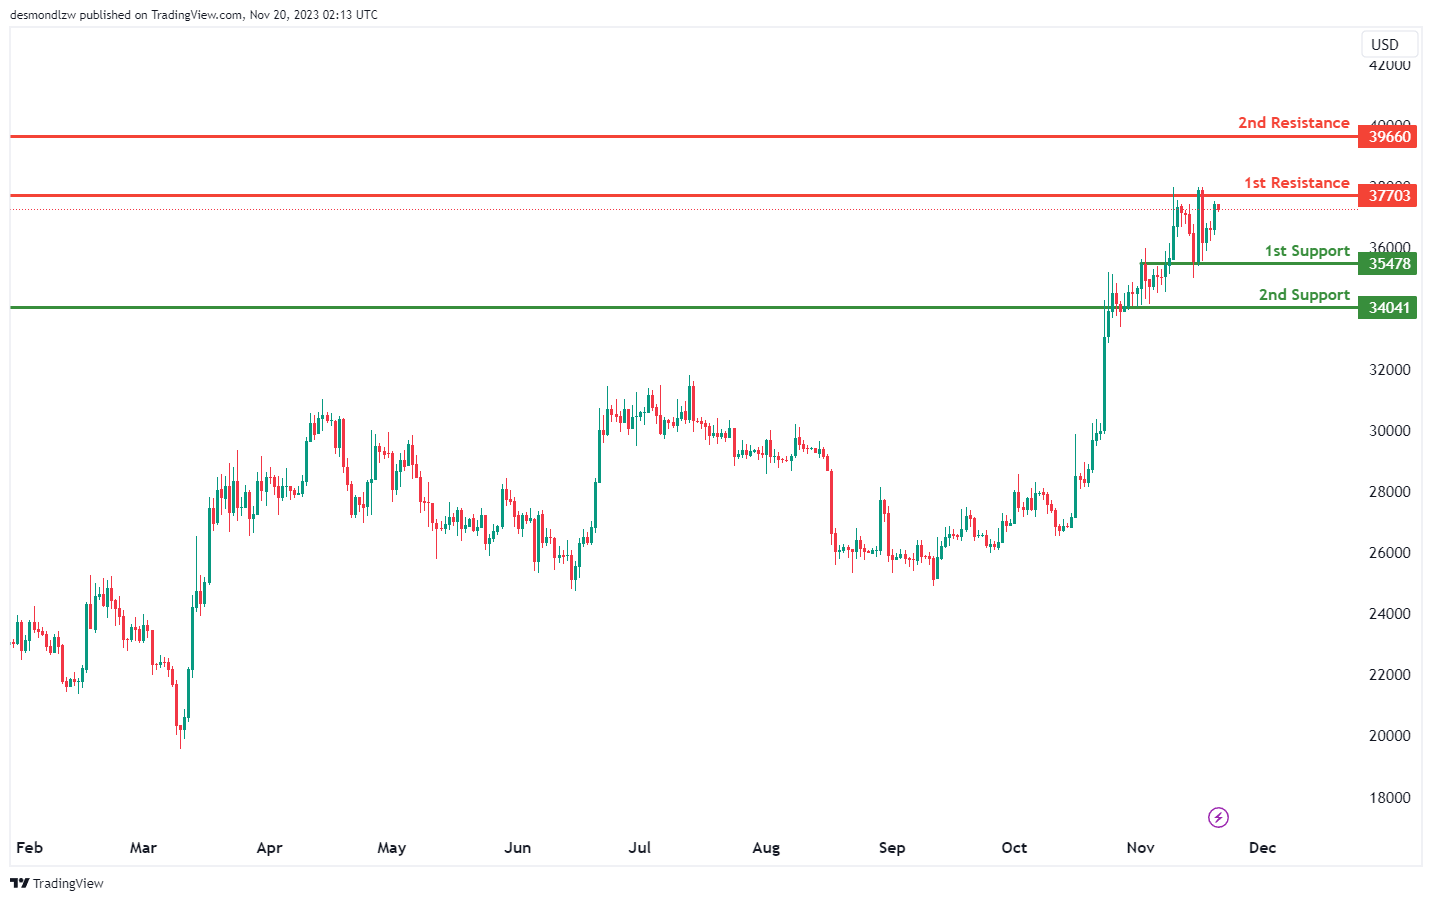
The BTC/USD chart currently indicates a bearish momentum, suggesting a potential bearish reaction off the first resistance at 37703, with a subsequent drop towards the first support at 35478.
The first support at 35478 is identified as an overlap support, indicating a level where the price might find some buying interest. Additionally, the second support at 34041 is recognized as another overlap support, reinforcing the potential strength of the support zone.
On the resistance side, the first resistance at 37703 represents a point of overlap resistance, suggesting a crucial level where the price might face selling pressure. Furthermore, the second resistance at 39660 is characterized as a swing high resistance, indicating another level where the price might encounter obstacles within its downward movement.
ETH/USD:
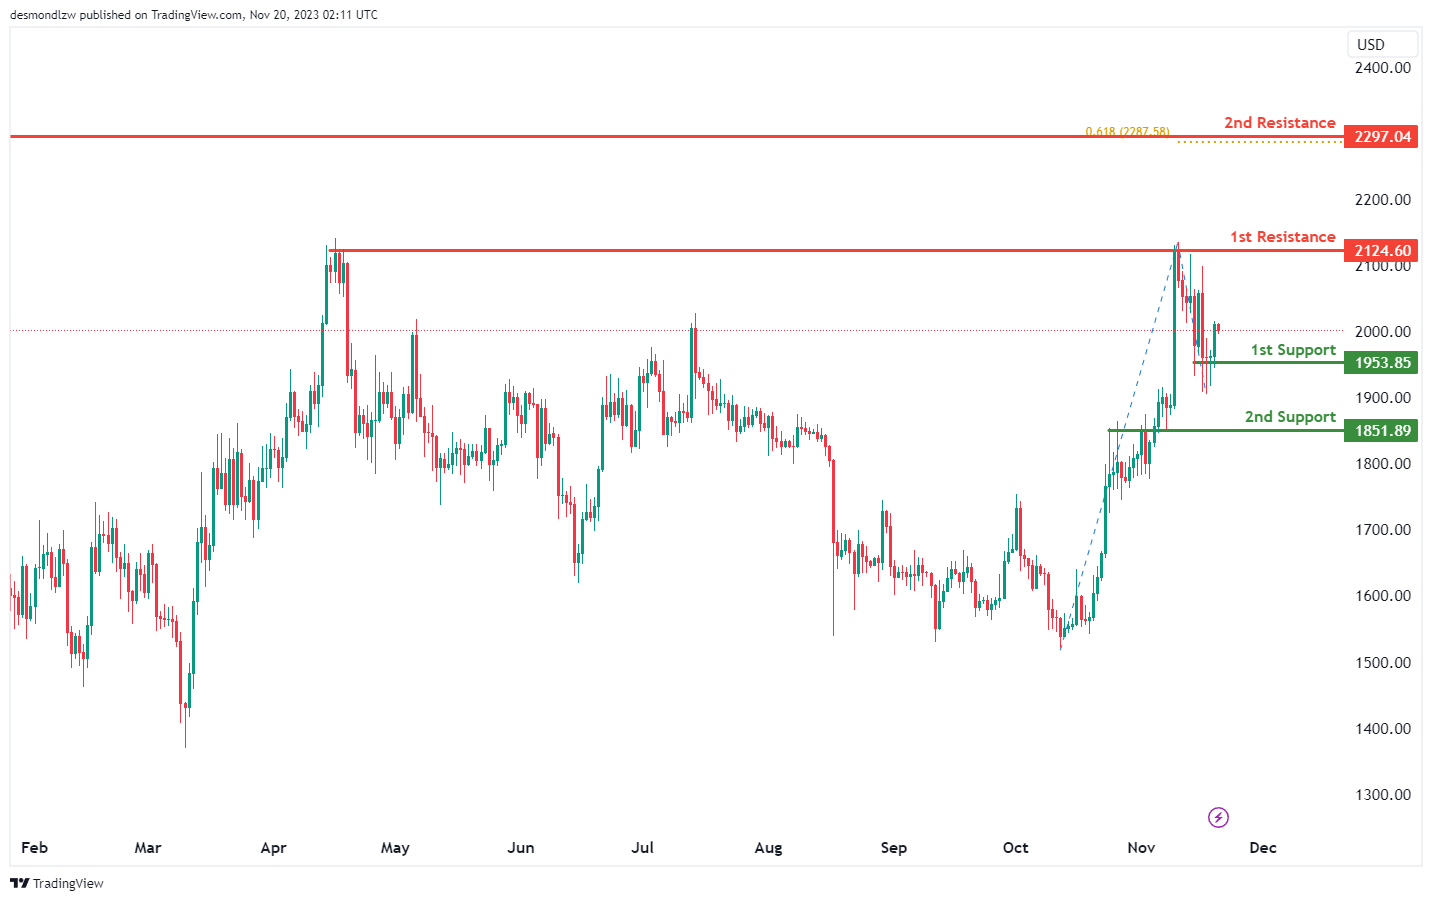
The ETH/USD chart currently indicates a bearish momentum, suggesting a potential bearish continuation towards the first support at 1953.85.
The first support at 1953.85 is identified as a multi-swing low support, indicating a level where the price might find some buying interest. Additionally, the second support at 1851.89 is recognized as an overlap support, reinforcing the potential strength of the support zone.
On the resistance side, the first resistance at 2124.60 represents a point of multi-swing high resistance, marking a crucial level where the price might face selling pressure. Furthermore, the intermediate resistance at 2297.04 is identified as a pullback resistance, coinciding with the 61.80% Fibonacci Projection level. This indicates another potential level where the price might encounter obstacles within its downward movement.
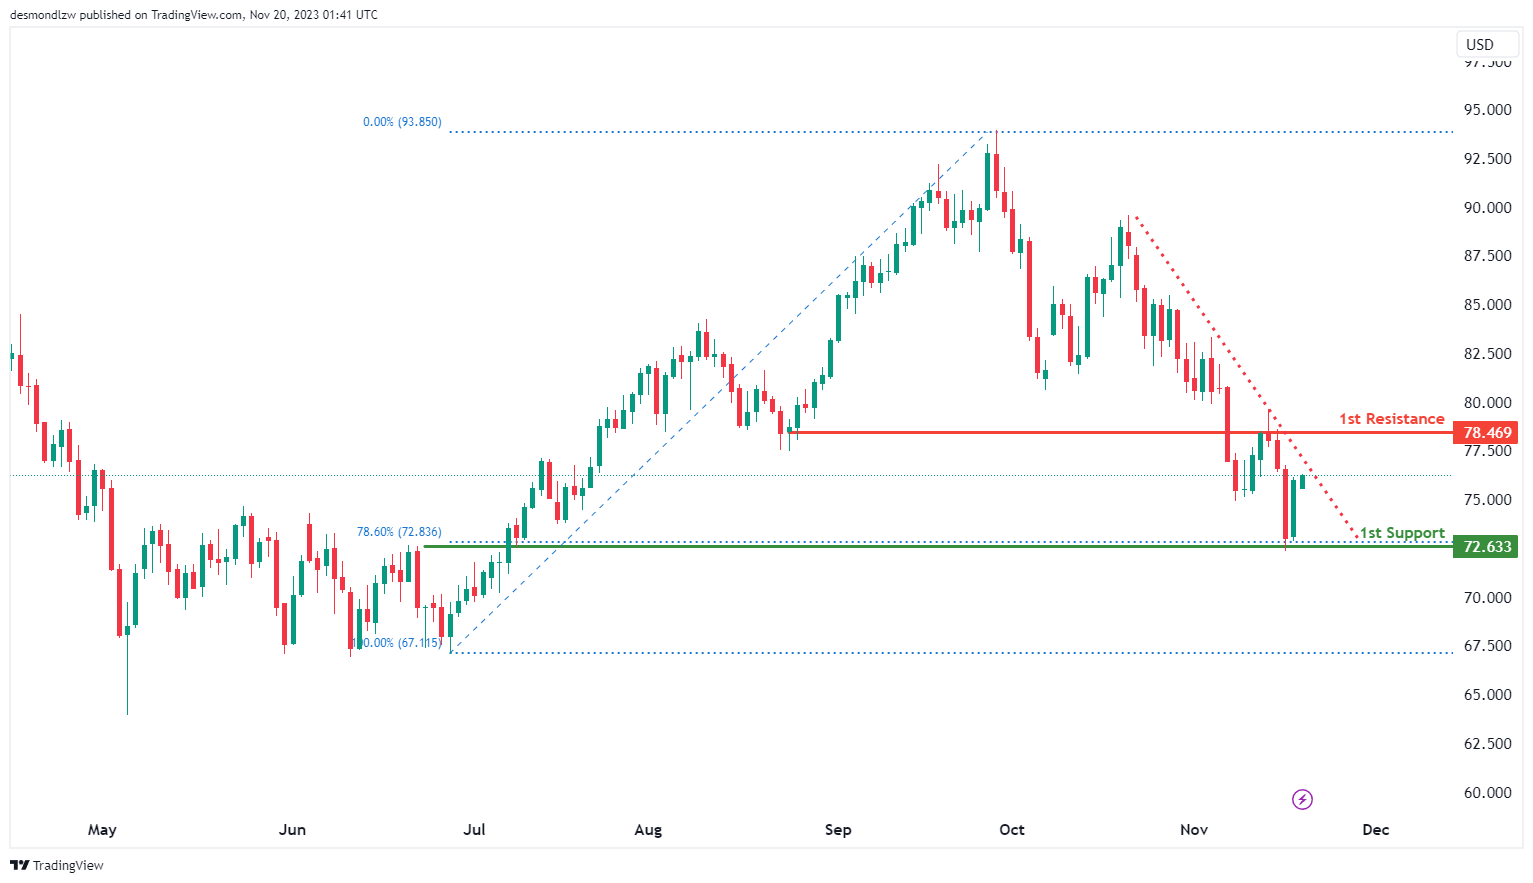
WTI/USD:
The WTI chart currently has a bearish overall momentum, characterized by a bearish descending channel, which is contributing to the bearish sentiment.
In this context, there is a potential for a bearish reaction off the 1st resistance and a drop towards the 1st support. Here are the key levels:
1st support at 72.63 is identified as an overlap support, and it coincides with the 78.60% Fibonacci retracement level. This level is considered significant, as it has the potential to act as a support zone where buyers might step in.
1st resistance at 78.46 is categorized as an overlap resistance, indicating a level where selling interest may be concentrated. Traders may expect this level to act as a barrier to further upward movement.
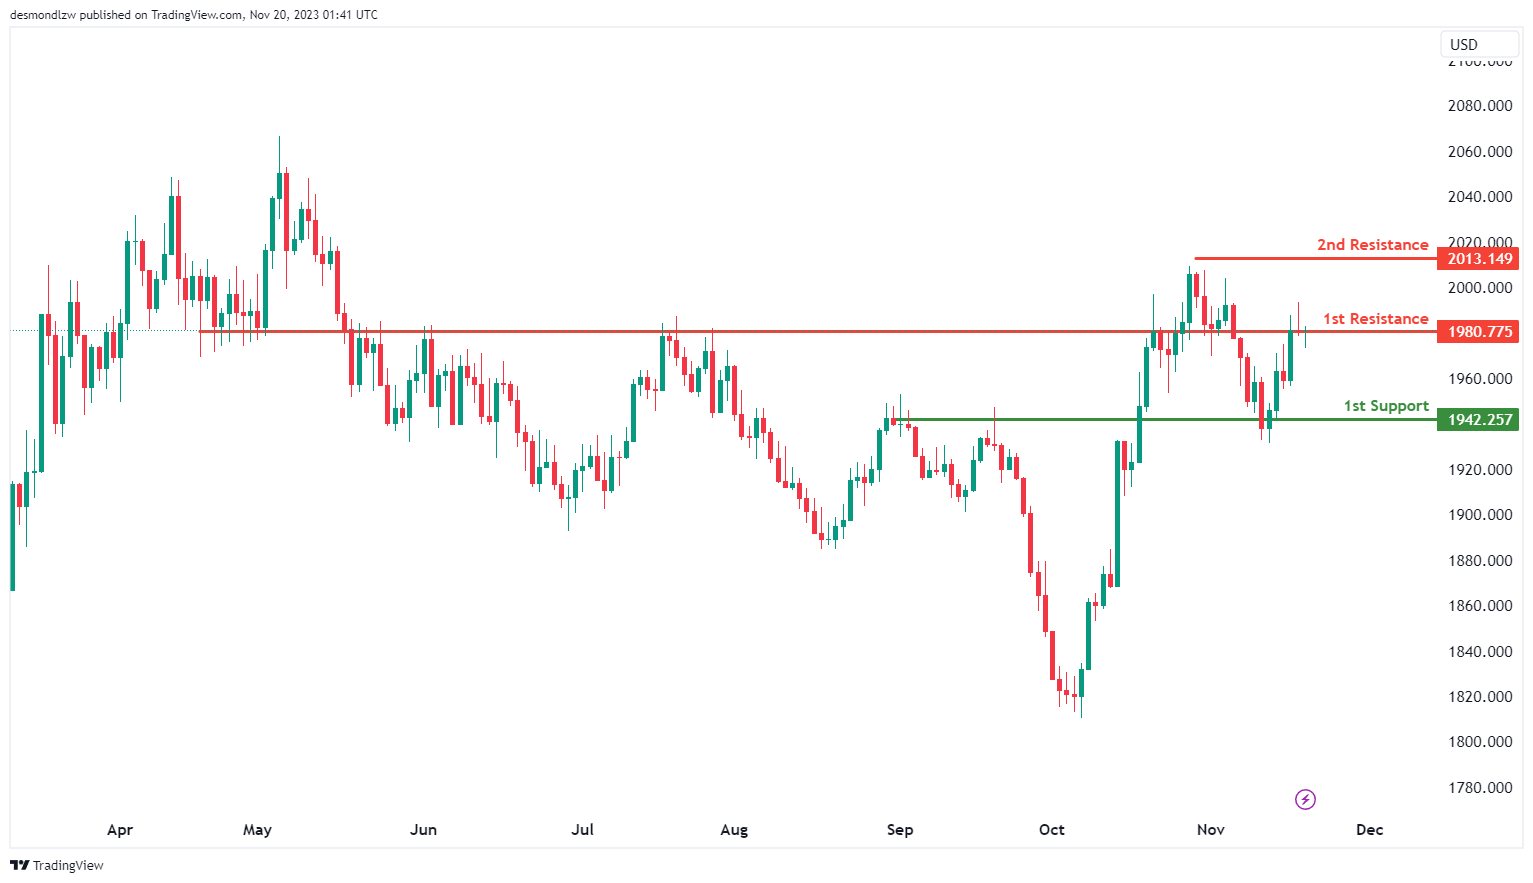
XAU/USD (GOLD):
The XAU/USD chart currently has a bearish overall momentum, suggesting the potential for a bearish reaction off the 1st resistance level and a drop towards the 1st support.
The 1st support at 1942.25 is identified as an overlap support. This level indicates a potential area where buyers may step in or where the bearish momentum could pause.
On the resistance side, the 1st resistance at 1980.77 is categorized as an overlap resistance, while the 2nd resistance at 2013.14 is noted as a swing high resistance. These levels suggest potential areas where selling interest may be present, potentially leading to a bearish reaction.
The accuracy, completeness and timeliness of the information contained on this site cannot be guaranteed. IC Markets does not warranty, guarantee or make any representations, or assume any liability regarding financial results based on the use of the information in the site.
News, views, opinions, recommendations and other information obtained from sources outside of www.icmarkets.com, used in this site are believed to be reliable, but we cannot guarantee their accuracy or completeness. All such information is subject to change at any time without notice. IC Markets assumes no responsibility for the content of any linked site.
The fact that such links may exist does not indicate approval or endorsement of any material contained on any linked site. IC Markets is not liable for any harm caused by the transmission, through accessing the services or information on this site, of a computer virus, or other computer code or programming device that might be used to access, delete, damage, disable, disrupt or otherwise impede in any manner, the operation of the site or of any user’s software, hardware, data or property.


