
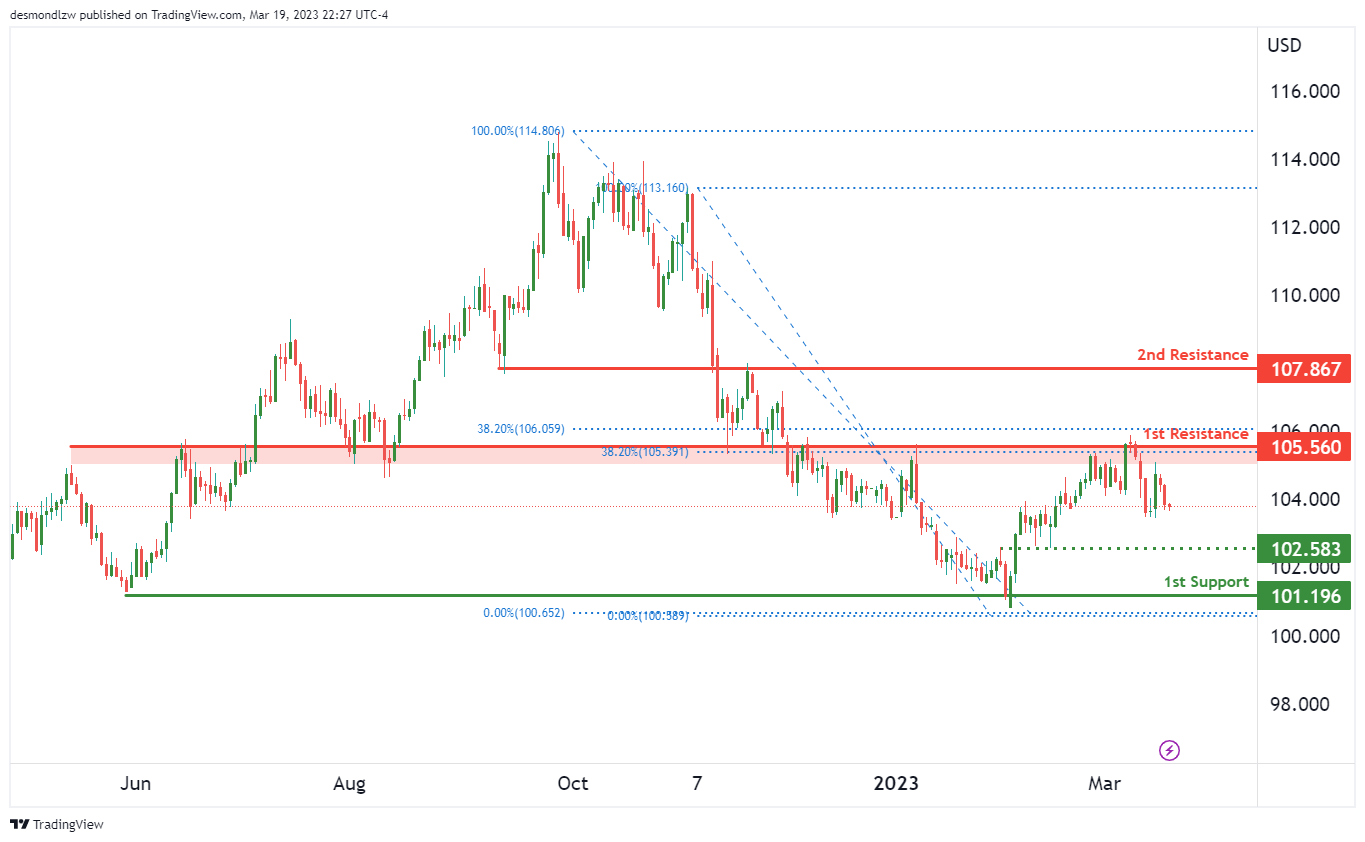
DXY:
The DXY chart currently has a bearish overall momentum, and price could potentially continue to drop towards the 1st support level at 101.19. This support level is a multi-swing low support, indicating it has been tested multiple times in the past and is likely to provide a strong support for price.
There is an intermediate support level at 102.58, which could potentially provide a smaller support level for price before reaching the 1st support level.
On the resistance side, the 1st resistance level is at 105.56, which is a strong overlap resistance level that coincides with a 38.20% Fibonacci retracement. This resistance level is expected to be a significant barrier for price to break through.
The 2nd resistance level is at 107.86, which is also an overlap resistance level that could potentially provide additional resistance if price were to break through the 1st resistance level.
It’s worth noting that the current bearish momentum is likely to continue unless there is a significant change in the market conditions.
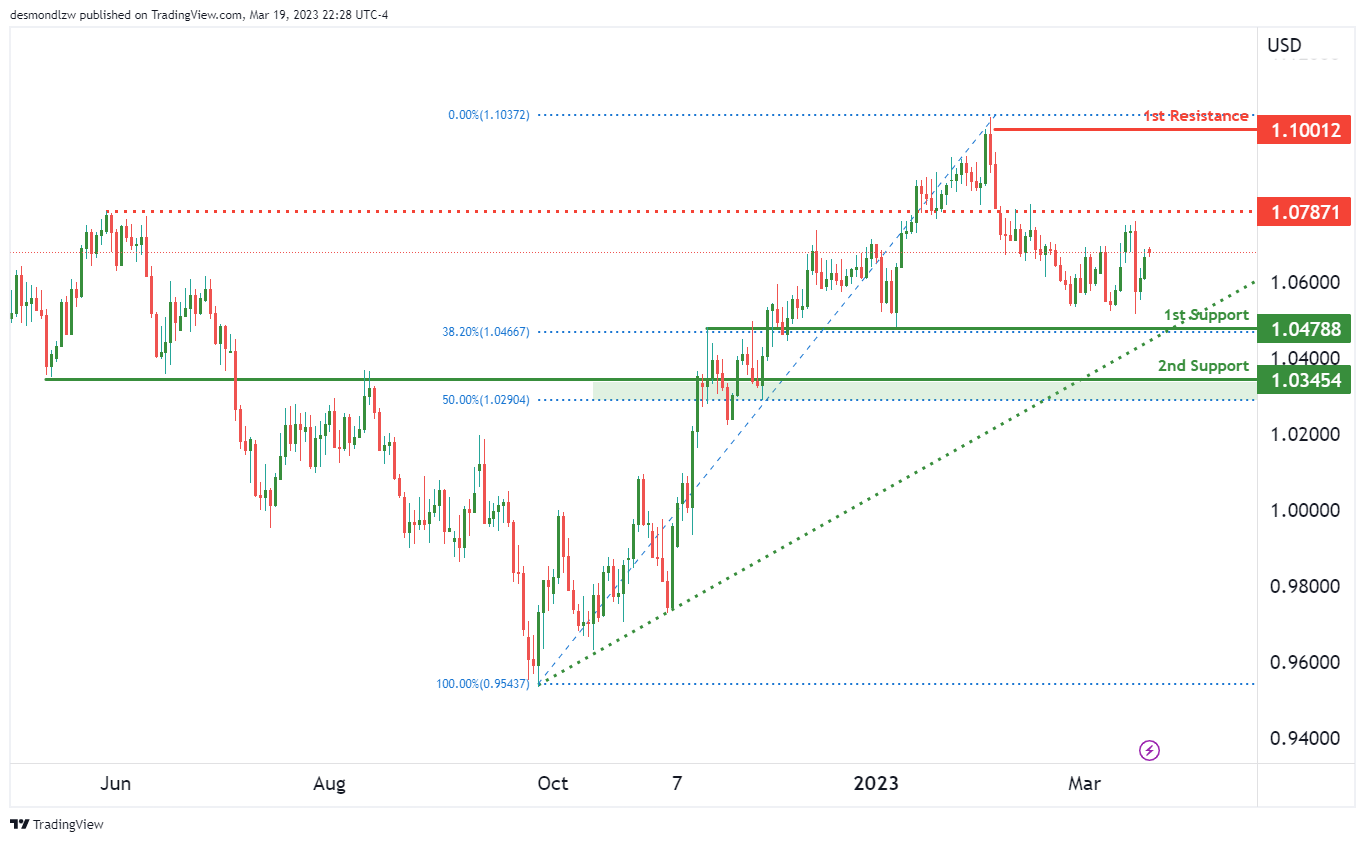
EUR/USD:
The EUR/USD currency pair is currently exhibiting bullish momentum, with potential for further upside towards the 1st resistance level.
At present, the price is supported by a pullback support at 1.0478, which also aligns with the 38.20% Fibonacci retracement level. If the price were to bounce from this support, it could move towards the 1st resistance level of 1.1001, which is a significant swing high resistance level.
In addition to the 1st resistance level, there is also an intermediate resistance level at 1.0787, which coincides with an overlap resistance level. If the price manages to break through this intermediate resistance level, it could trigger a stronger bullish momentum towards the 1st resistance level.
On the downside, there is an intermediate support level at 1.0345, which aligns with the 50% Fibonacci retracement level. However, the overall bias remains bullish, and a move towards this support level is less likely.
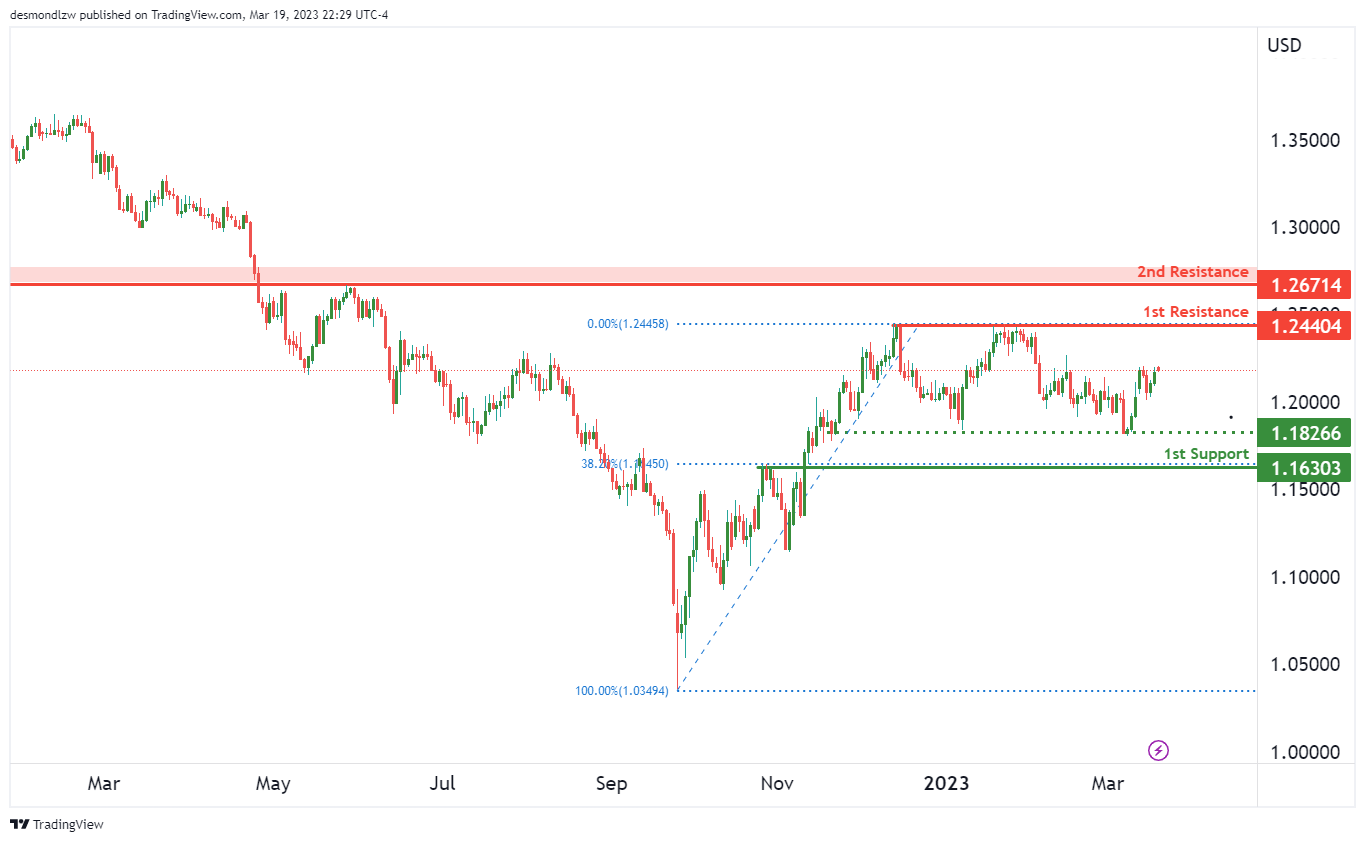
GBP/USD:
GBP/USD Continues Its Bullish Trend, Eyes on 1st Resistance
The overall momentum of the GBP/USD chart is bullish, with strong upward movement being observed. The price is currently testing a pullback support at 1.1630, which is a strong level of support with a 38.20% Fibonacci retracement lining up with it. This could indicate that the price may continue to rise towards the first resistance level.
If the price bounces from the 1st support, it could potentially rise towards the 1st resistance at 1.2440, which is a major swing high resistance level that has held the price down in the past. There is also an intermediate resistance at 1.2671, which coincides with an overlap resistance. If the price manages to break above this level, it could trigger a stronger bullish acceleration towards the 1st resistance.
However, if the price breaks below the pullback support at 1.1630, the next support level could be at the intermediate support at 1.1826. This level also happens to be a strong level of support. If the price breaks below this level, it could trigger a bearish reversal.
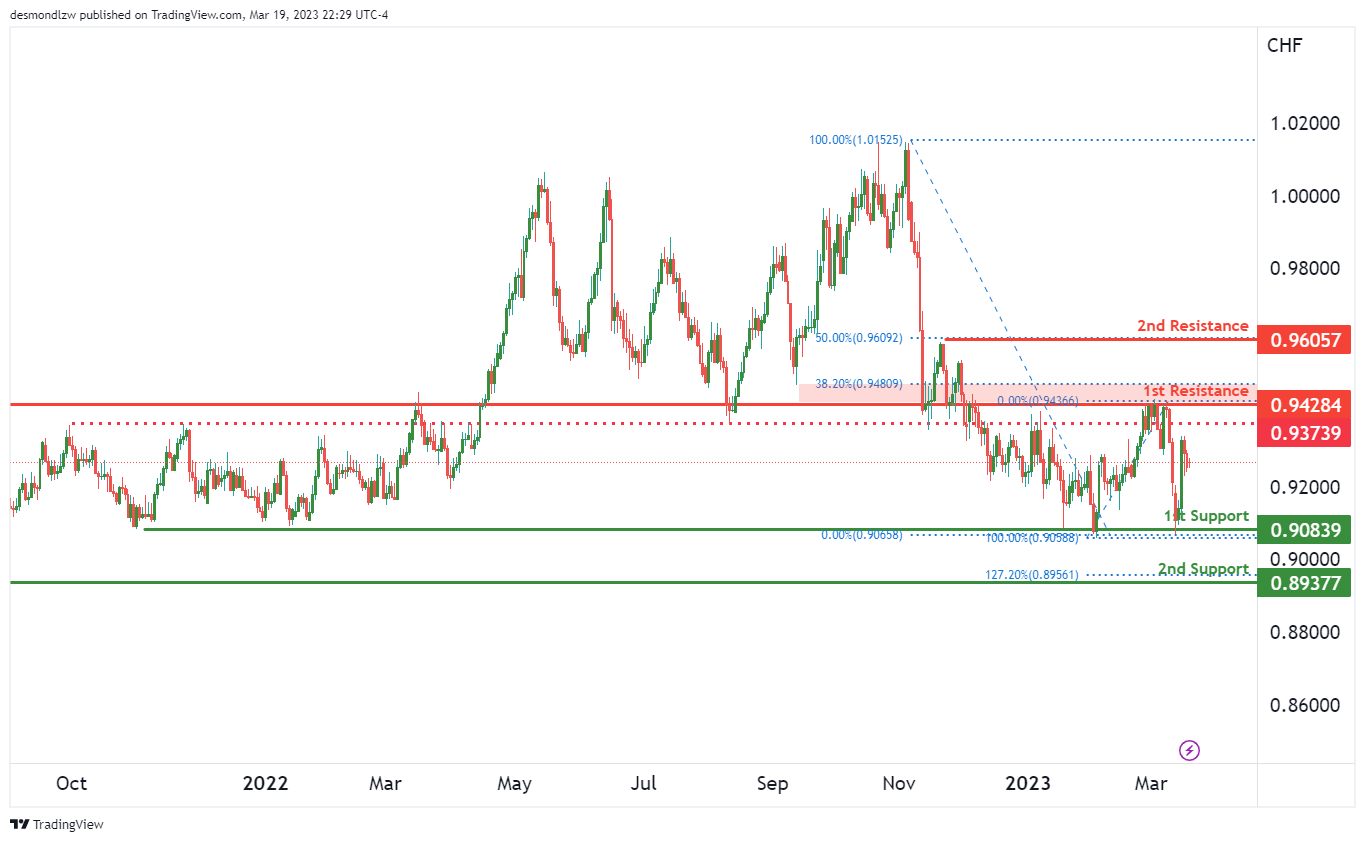
USD/CHF:
USD/CHF Momentum Neutral with Potential for Fluctuations
The overall momentum of the USD/CHF chart is currently neutral, suggesting that there is no clear trend direction. However, there is potential for price to fluctuate between the 1st resistance and 1st support levels.
The 1st support level is at 0.9083 and is a multi-swing low support level. The 2nd support level is at 0.8937 and is a swing low support level. These levels could provide a potential bounce for price if it were to drop from the current level.
On the other hand, the 1st resistance level is at 0.9428 and is an overlap resistance level. This level coincides with the 38.20% Fibonacci retracement, suggesting it could provide strong resistance. The 2nd resistance level is at 0.9605 and is a swing high resistance level, while the intermediate resistance level is at 0.9373 and is an overlap resistance level.
Due to the current neutral momentum, price could potentially fluctuate between these support and resistance levels. Traders should be aware of potential breakouts of these levels, but they may not be high conviction due to the lack of clear momentum in any direction.
It’s worth keeping an eye on the chart as any breaks of these levels could signal a potential trend direction.
USD/JPY:
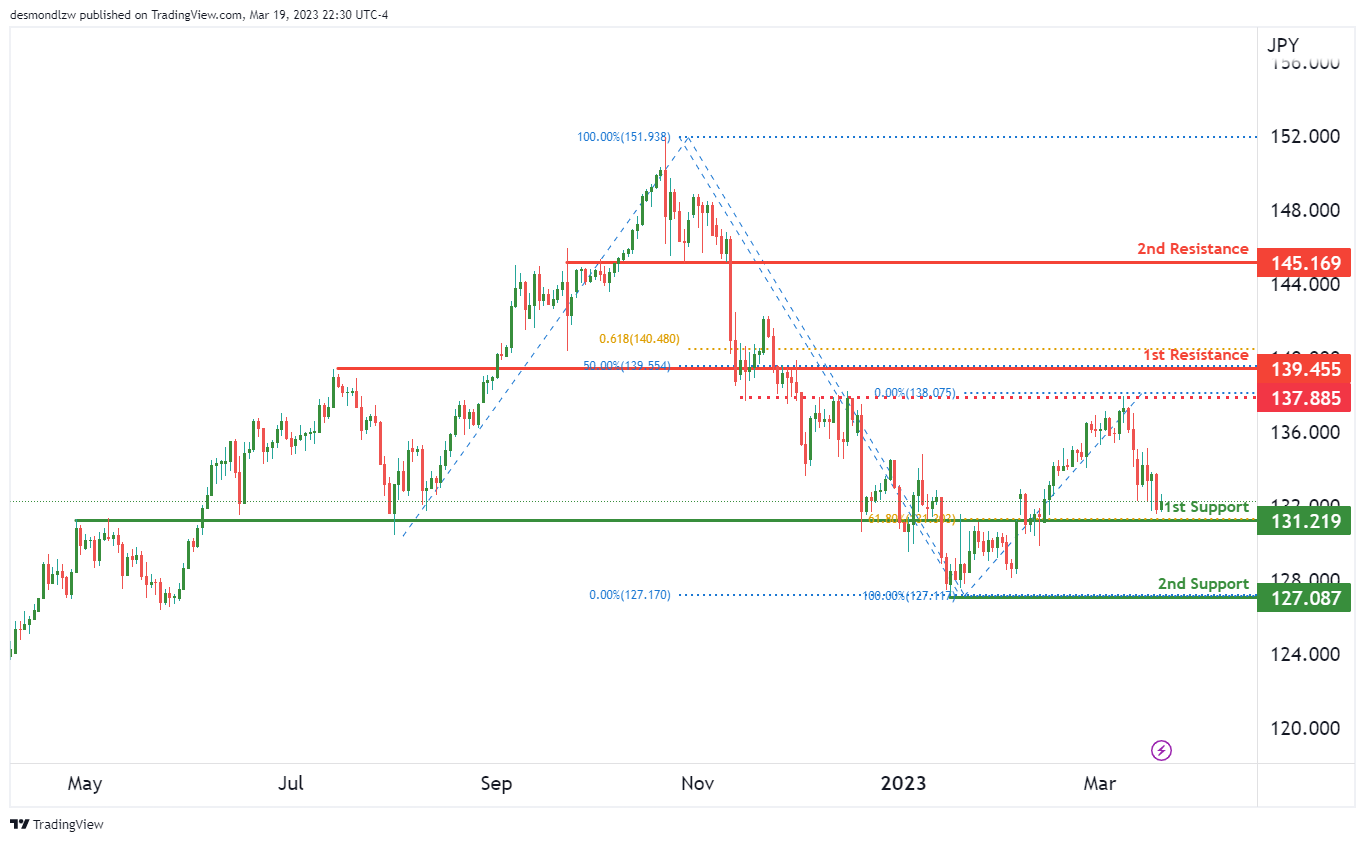
USD/JPY Momentum Weakens, Potential for Bullish Bounce Off 1st Support
The USD/JPY currency pair is currently showing weak momentum with low confidence. However, there is potential for a bullish bounce off the 1st support level with a potential move towards the 1st resistance level.
The 1st support level is at 131.219, which is a strong overlap support and also lines up with the 61.80% Fibonacci retracement. If price were to bounce off this support level, it could potentially rise towards the 1st resistance level at 139.450. This resistance level is an overlap resistance and coincides with the 50% Fibonacci retracement.
If the currency pair manages to break through the 1st resistance level, it could potentially move towards the 2nd resistance level at 145.169, which is also an overlap resistance. However, an intermediate resistance level at 137.885 should also be taken into consideration.
On the other hand, if the currency pair were to break the 1st support level, the next support level it could drop to is the 2nd support level at 127.087. This support level is a swing low support and has been tested multiple times in the past.
p resistance and could provide some resistance if price were to rise towards the first resistance level.
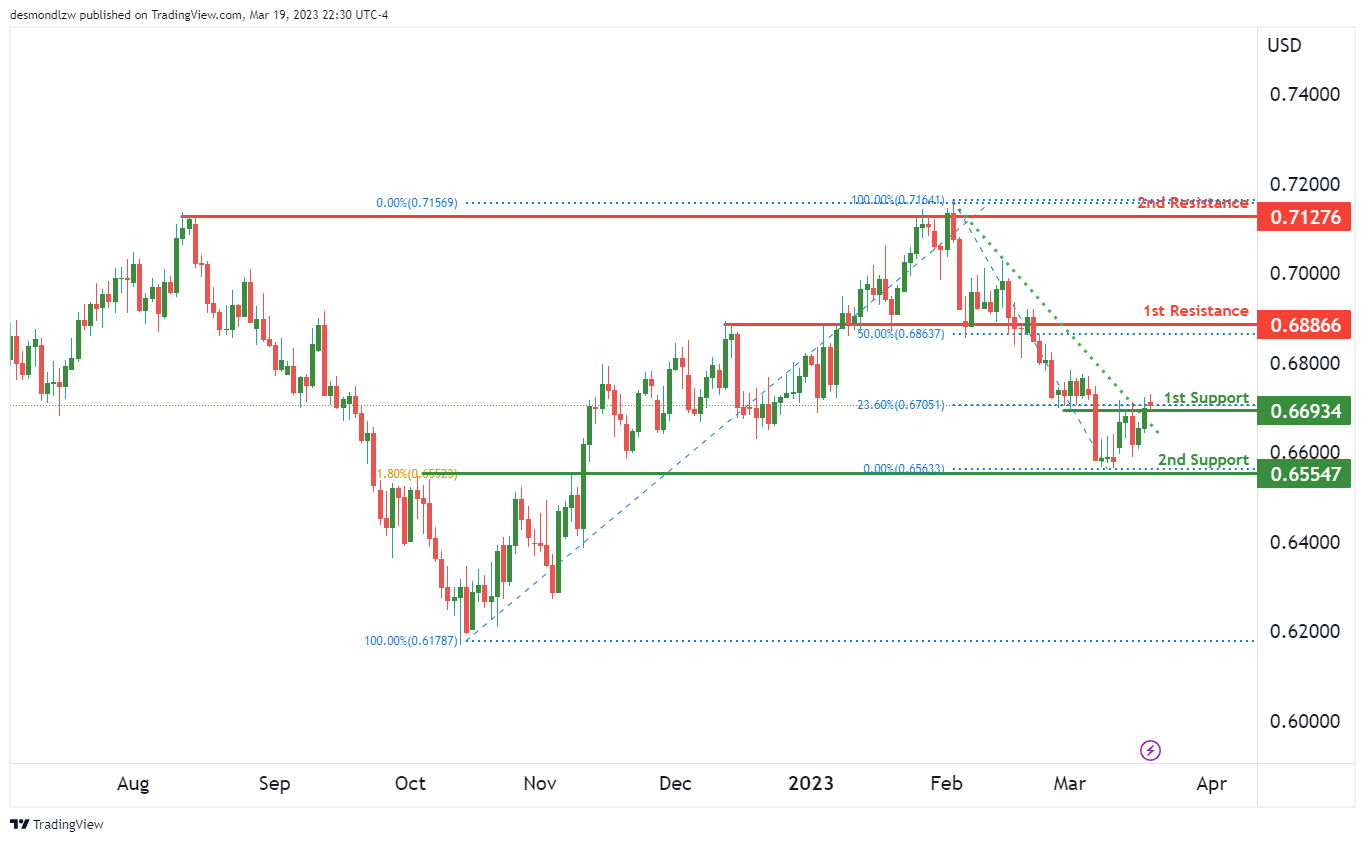
AUD/USD:
The AUD/USD chart is showing a strong bullish momentum with prices breaking above a descending resistance line, which indicates a potential for further bullish moves. The overall bias for the chart is bullish, and prices could potentially bounce off the 1st support level towards the 1st resistance.
The 1st support level is at 0.6693, which is an overlap support and coincides with the 38.20% Fibonacci retracement level. If prices bounce off this support, they could rise towards the 1st resistance level at 0.6886, which is also an overlap resistance and coincides with the 50% Fibonacci retracement level.
In case prices continue to rise above the 1st resistance level, they could potentially reach the 2nd resistance level at 0.7127, which is a swing high resistance. On the other hand, if prices drop below the 1st support level, they could reach the 2nd support level at 0.6554, which is an overlap support and coincides with the 61.80% Fibonacci retracement level.
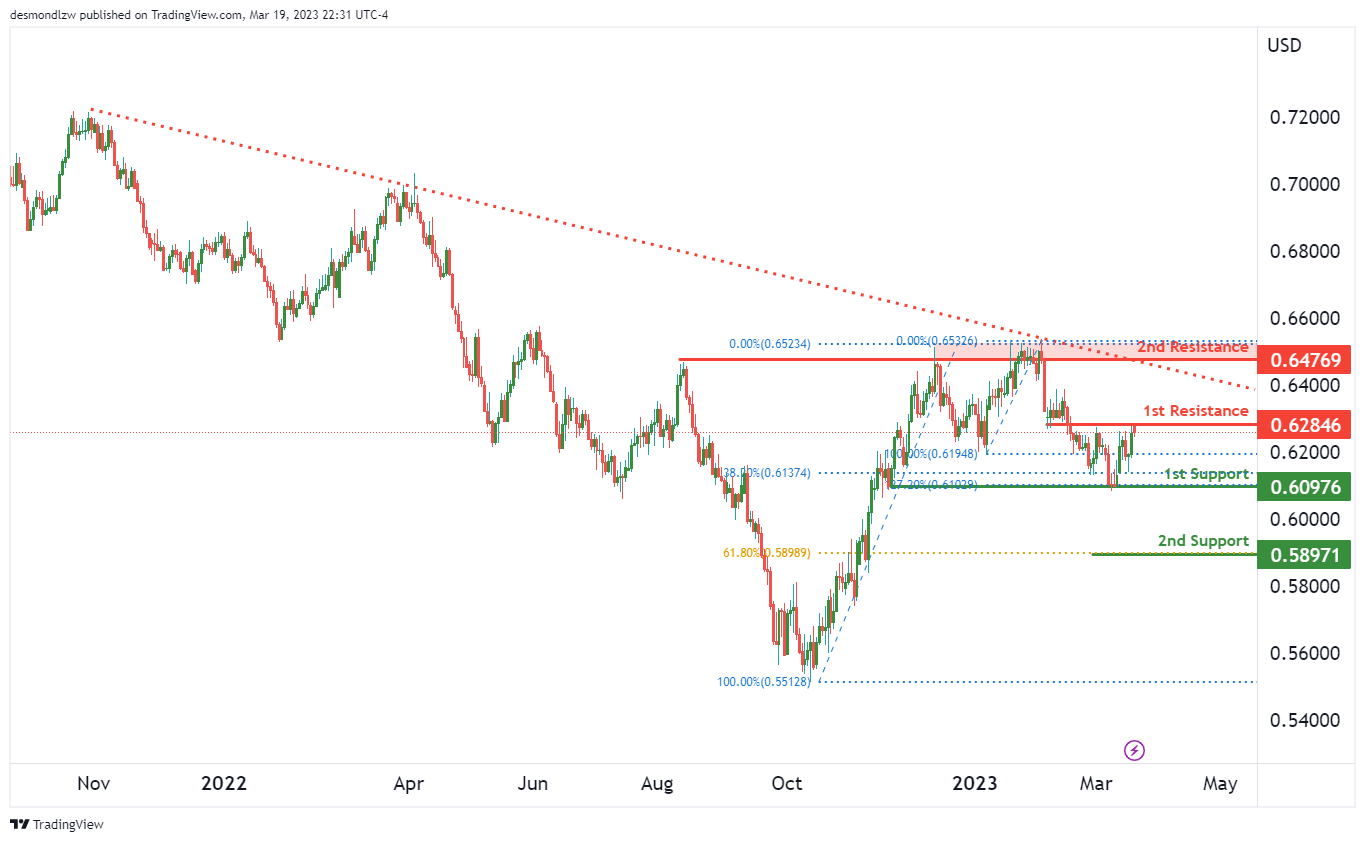
NZD/USD:
The NZD/USD chart shows a bearish momentum, as price is currently below a major descending trend line and the bearish Ichimoku cloud. In terms of potential price movement, a bearish reaction off the 1st resistance is possible, leading to a drop to the 1st support level.
The 1st support level is at 0.6097, which is a strong overlap support and has a 38.20% Fibonacci retracement lining up with it. If price were to drop below this level, the next support level it could reach is the 2nd support at 0.5897, which is a swing low support and has a 61.80% Fibonacci retracement lining up with it.
On the other hand, if price were to bounce from the 1st support level, it could rise to the 1st resistance level at 0.6284, which is a pullback resistance. Beyond that, the 2nd resistance level at 0.6476 is a multi-swing high resistance.
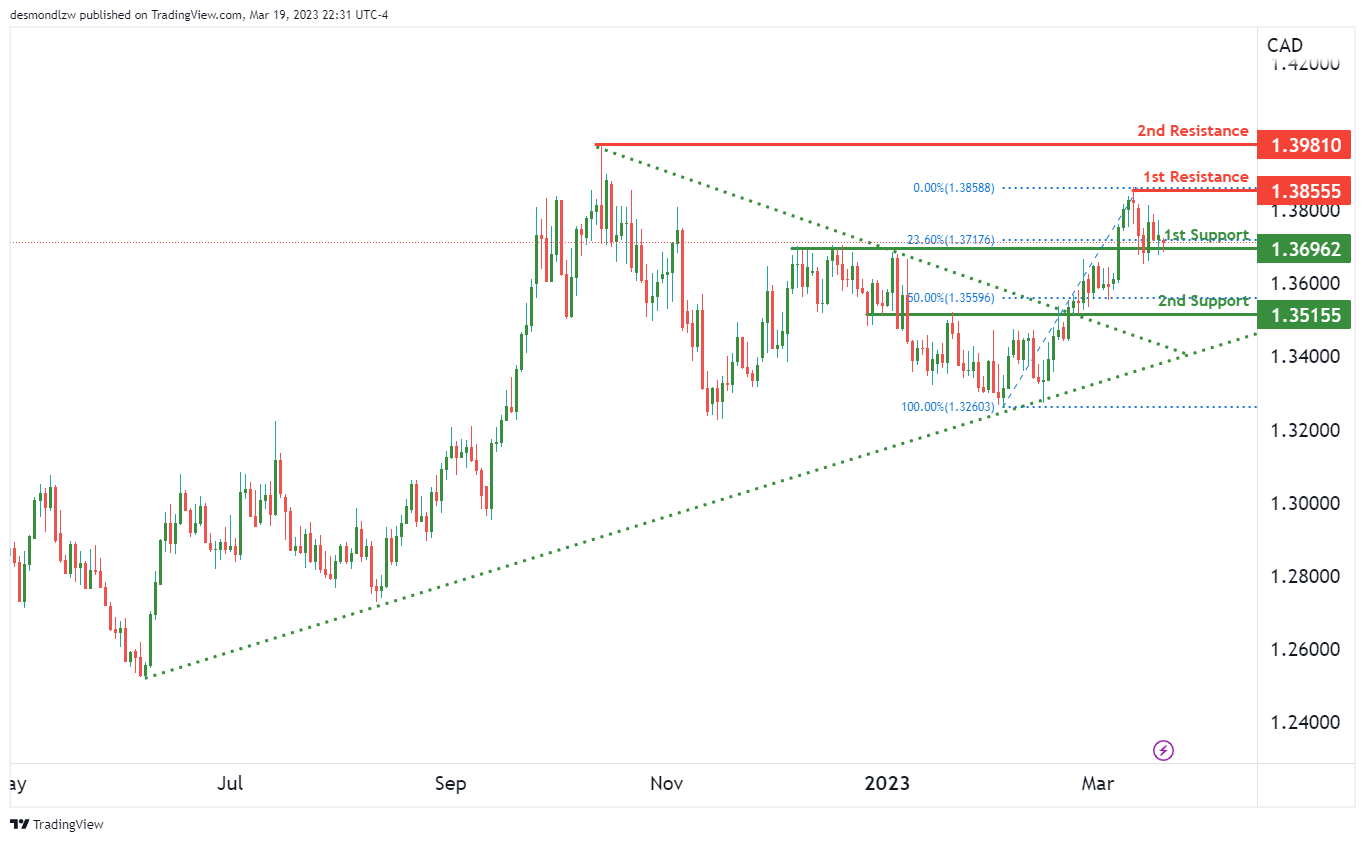
USD/CAD:
USD/CAD Continues to Show Bullish Momentum, Testing Key Resistance Levels
The USD/CAD currency pair has continued to exhibit bullish momentum on the charts, with price potentially headed towards the 1st resistance level. The overall bias of the chart is bullish, with a potential for a bullish bounce off the 1st support and a subsequent rise towards the 1st resistance level.
The 1st support level for the USD/CAD is at 1.3696, which is a pullback support level and coincides with the 23.60% Fibonacci retracement. The 2nd support level is at 1.3515, which is also a pullback support level and coincides with the 50% Fibonacci retracement.
The 1st resistance level is at 1.3855, which is a swing high resistance level. The 2nd resistance level is at 1.3981, which is also a swing high resistance level.
The USD/CAD currency pair has been exhibiting bullish momentum, and a bounce off the 1st support level could potentially lead to a rise towards the 1st resistance level. It’s important to note, however, that there is a possibility for a pullback towards the 2nd support level if price fails to break through the 1st resistance level.
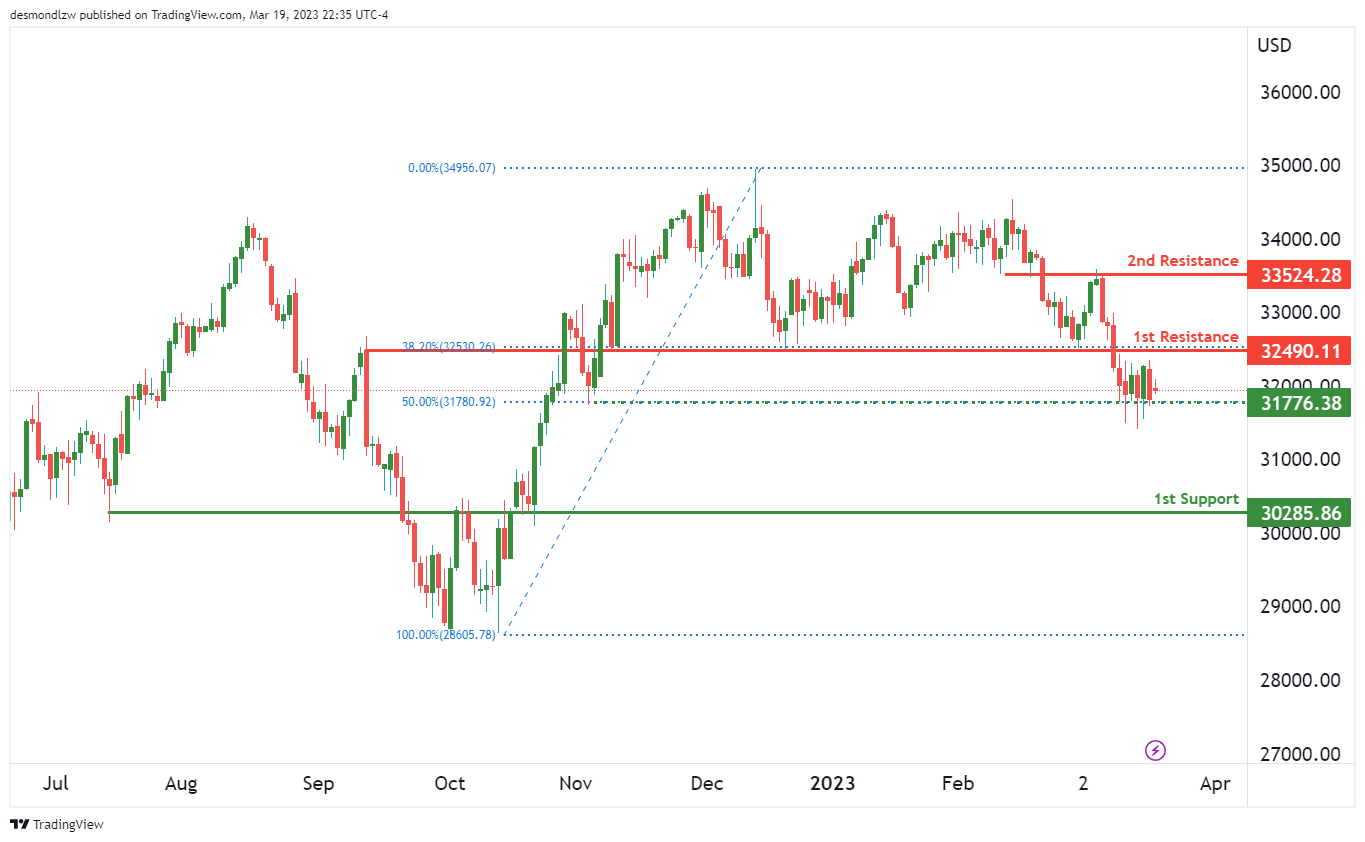
DJ30:
The DJ30 chart shows a bearish momentum, indicating that the price could potentially continue to fall towards the first support level.
The first support level is at 30285, which is a significant overlap support level. Additionally, there is an intermediate support at 31776, which is another overlap support level and also coincides with the 50% Fibonacci retracement.
On the resistance side, the first resistance level is at 32490, which is an overlap resistance level and lines up with the 38.20% Fibonacci retracement. If the price were to bounce from the first support level, it could potentially rise towards this resistance level.
However, if the price were to break below the first support level, it could continue to fall towards the 2nd support level at 31776.
There is also a second resistance level at 33524, which is a pullback resistance level. This level may come into play if the price manages to rise above the first resistance level.
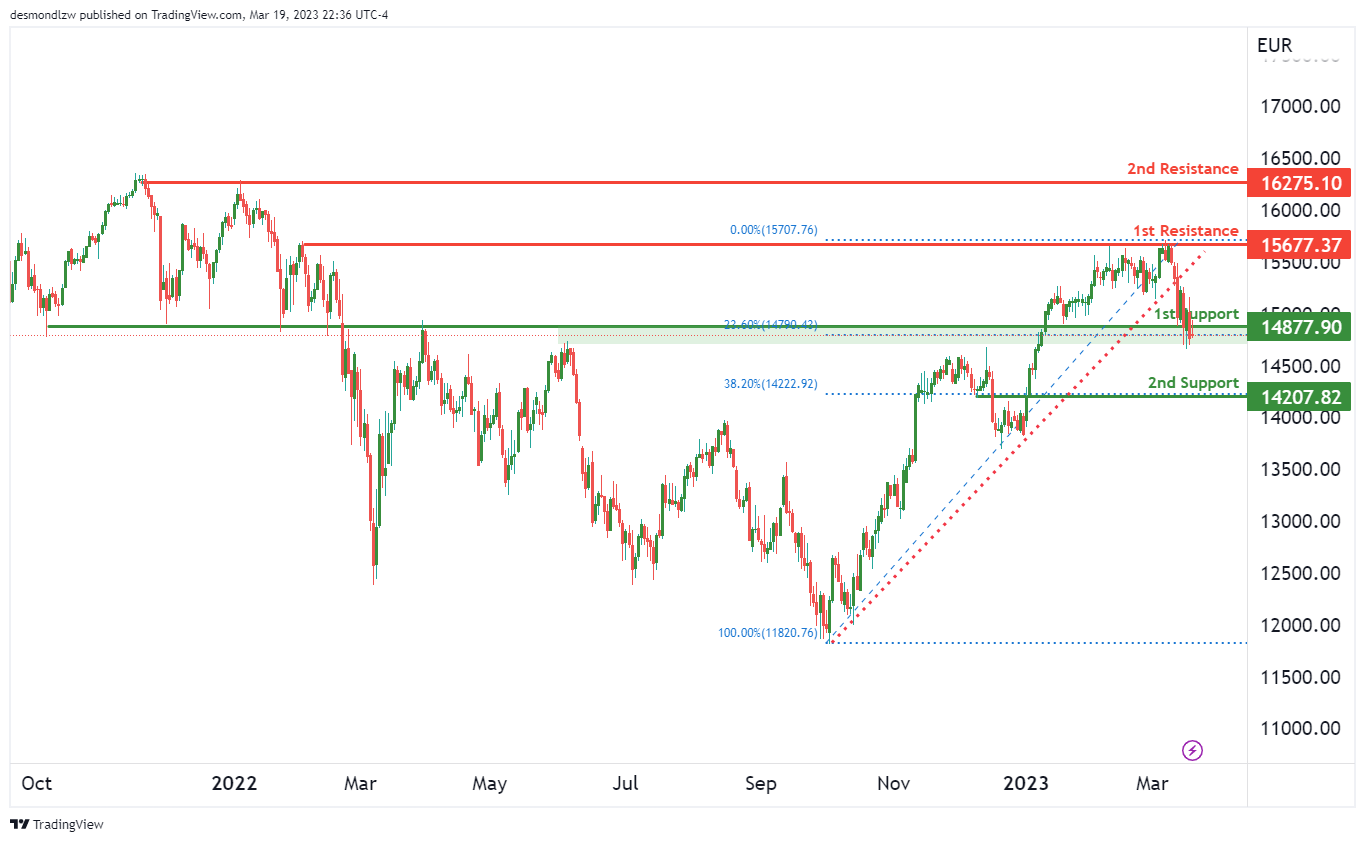
GER30:
The GER30 has been experiencing a bearish momentum lately, as it is currently trading below a major descending trend line. This suggests that the market sentiment is still tilted towards the downside.
Looking at the chart, we can see that the price might continue its bearish trend and break off the 1st support level at 14877.80. If this happens, we might see the price drop towards the 2nd support level at 14202.82, which coincides with a 38.20% Fibonacci retracement level.
On the other hand, if the price manages to bounce off the 1st support level, we might see it rise towards the 1st resistance level at 15677.37. This level coincides with a multi-swing high resistance and might prove to be a strong barrier for the bulls to overcome. However, if the price manages to break above it, we might see it move towards the 2nd resistance level at 16275.10.
It is worth noting that the overall momentum of the chart is bearish, and as such, any bullish moves might be short-lived. Traders should be cautious and look for opportunities to sell the asset at higher prices, rather than buying at the current levels.
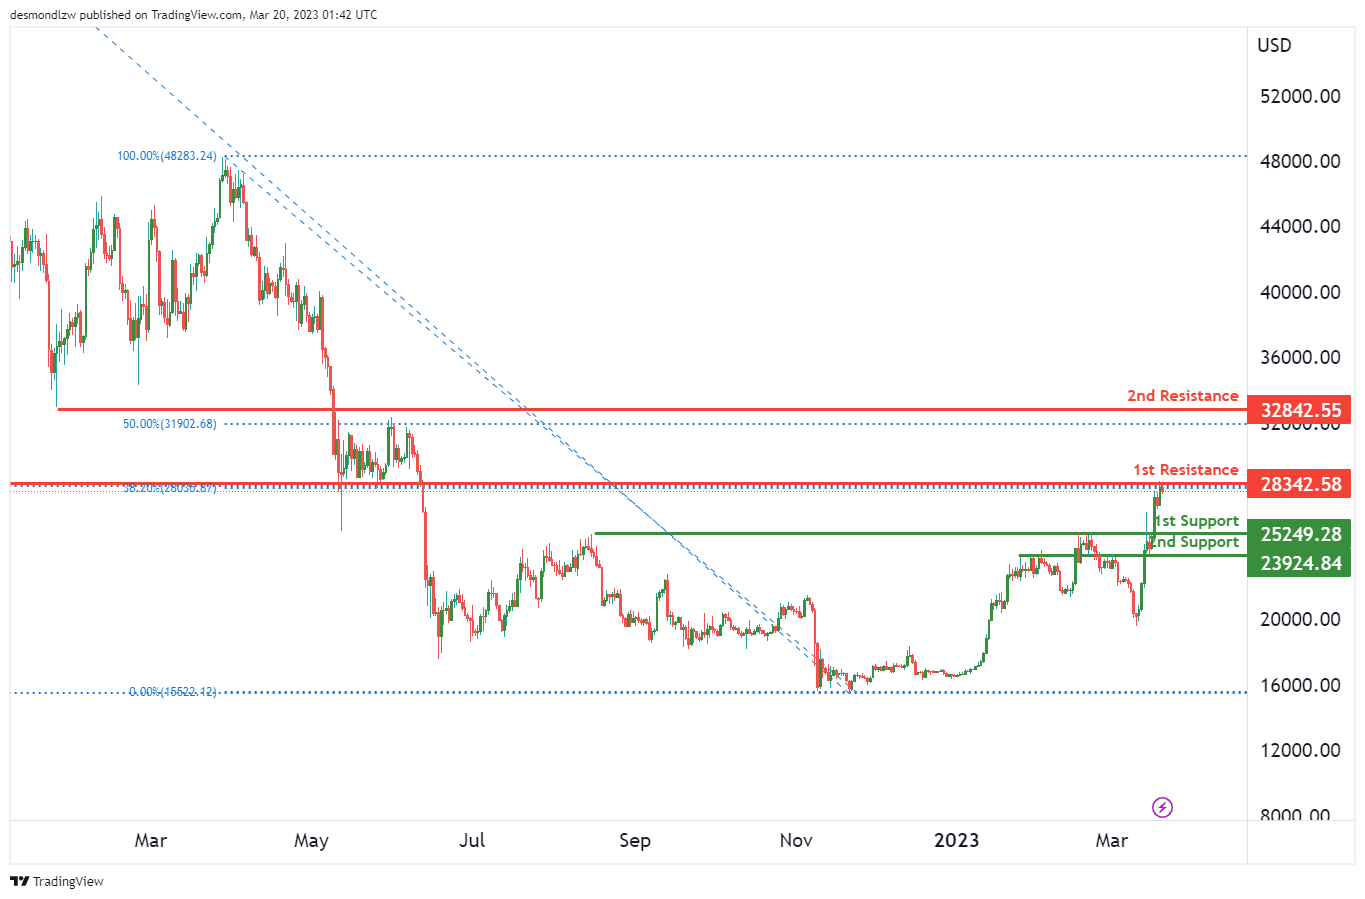
BTC/USD:
The BTC/USD chart continues to display bearish momentum as price is currently below a major descending trend line, suggesting that further downside movement may be on the cards.
At the moment, the price of BTC/USD could potentially make a bearish move towards the first support level at 25249.28, which is a key multi-swing low support level. In the event that price drops below this level, the second support at 23924.84, which is another overlap support level, could be the next downside target.
On the other hand, if the price manages to find some bullish momentum, it could potentially make a bullish move towards the first resistance level at 28342.58. This resistance level is also a 38.20% Fibonacci retracement level, adding further significance to the level. If the price manages to break above this level, the second resistance level at 32842.55, which is also a key overlap resistance level, could be the next target.
It is important to note that the overall momentum of the BTC/USD chart is bearish, and therefore any bullish moves should be treated with caution. Traders may look for selling opportunities near resistance levels or wait for a clear bullish reversal signal before considering long positions.
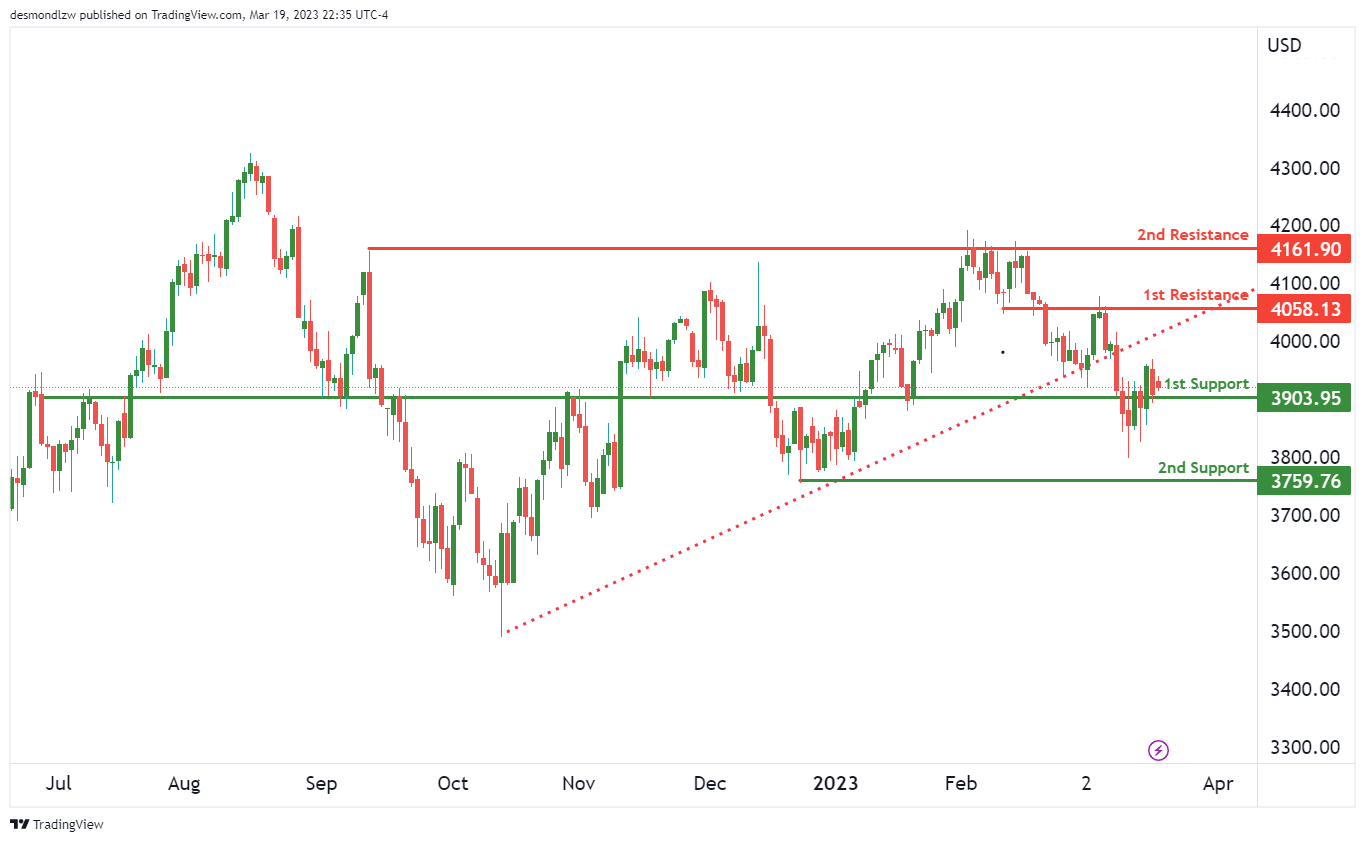
US500
The S&P 500 index has been facing significant resistance as bearish momentum persists, with the price remaining below a major descending trend line. The overall momentum of the chart is bearish, which suggests that we might see further downside in the coming days.
The first support level is at 3903.95, which is a critical level for the index. This level is an overlap support and could provide a good bounce for the price. However, if the price breaks below this level, we could see the index drop towards the second support level at 3759.76, which is a swing low support.
On the upside, the first resistance level is at 4058.13, which is a pullback resistance. If the price manages to break above this level, it could potentially head towards the second resistance level at 4161.90, which is a swing high resistance.
The bearish momentum is further reinforced by the fact that the price is below the bearish Ichimoku cloud. This suggests that the bears are in control of the market, and we might see further downside in the short term.
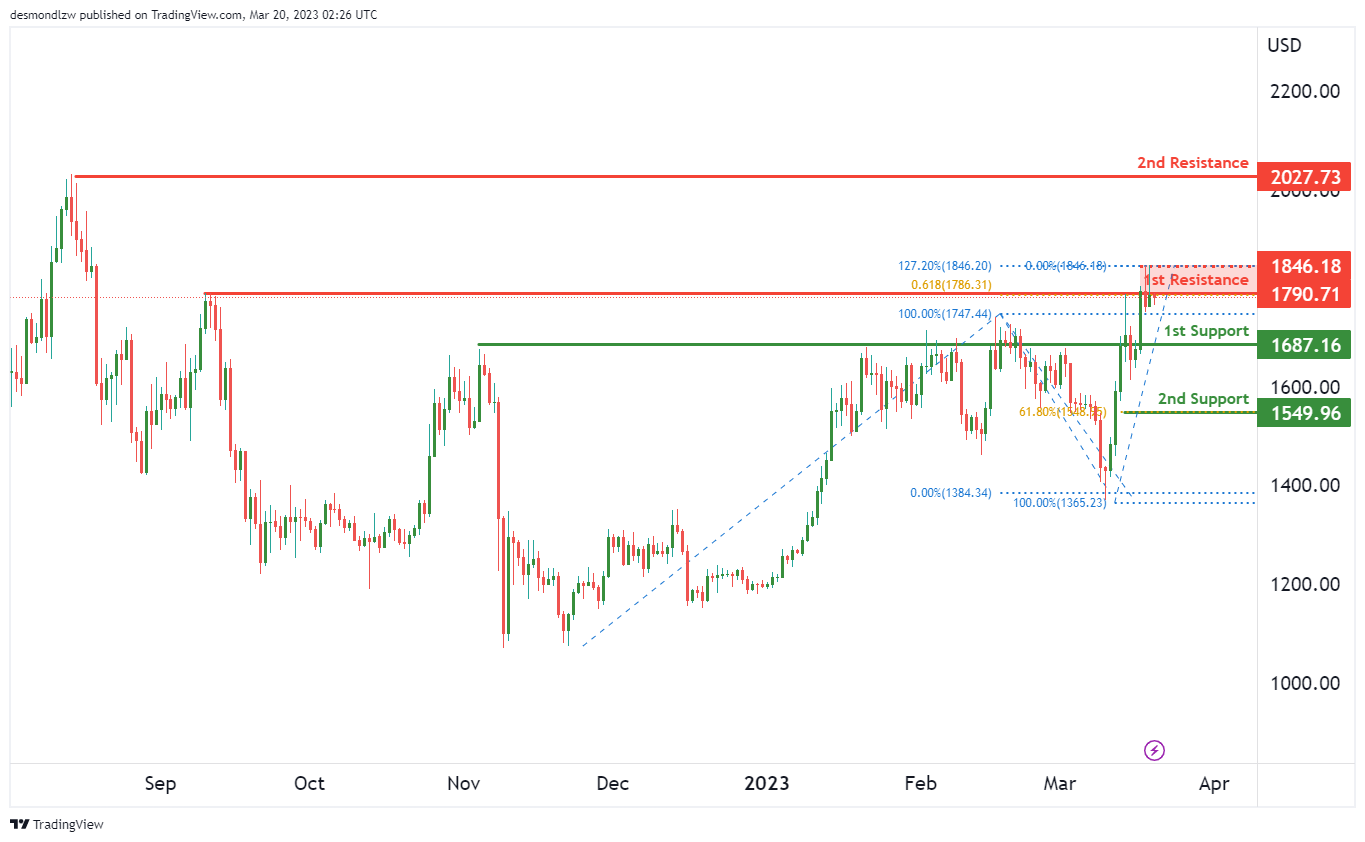
ETH/USD:
The overall momentum of ETH/USD is bearish, with the price potentially heading towards the 1st support level.
There are a few factors contributing to the bearish momentum, one of which is the price being below a major descending trend line, suggesting that further downside is on the cards. Additionally, there is no bullish Ichimoku cloud to suggest any potential upside.
Looking at the support and resistance levels, the price could potentially make a bearish reaction off the 1st resistance level and drop towards the 1st support. The 1st support level is at 1687.16, which is a good level to watch out for as it represents an overlap support level. A break below this support level could lead to further downside momentum.
If the price continues to drop, the next support level to watch out for is the 2nd support at 1549.96, which is also a swing low support and sits at the 61.80% Fibonacci retracement level.
On the other hand, if the price manages to break above the 1st resistance level at 1790.71, it could indicate a potential bullish reversal. However, this seems unlikely at the moment as the overall momentum of the chart is bearish.
The 2nd resistance level at 2027.73 is also a swing high resistance level that could potentially provide a significant barrier to any upside momentum.
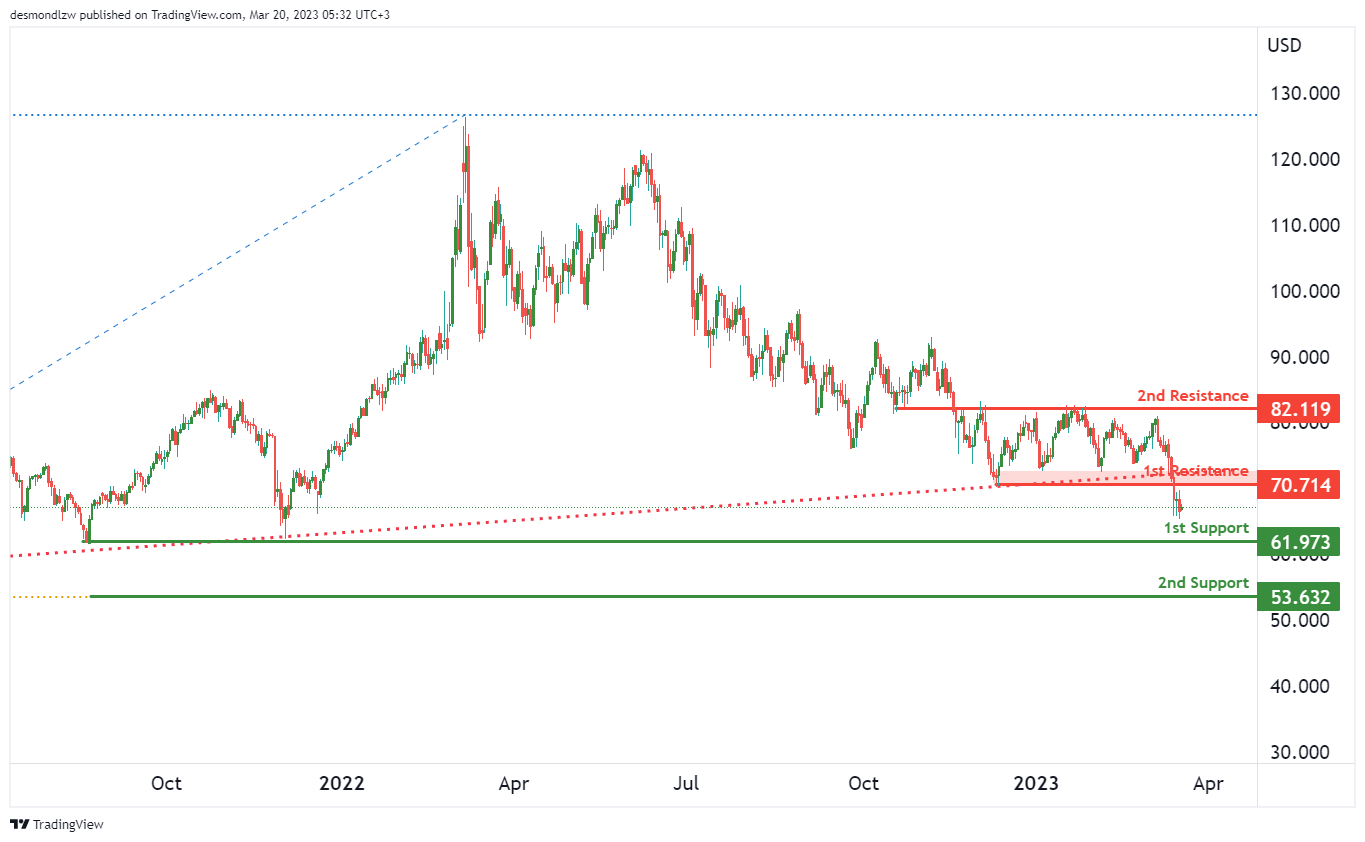
WTI/USD:
WTI Oil prices have been showing a neutral momentum on the charts recently, which suggests that prices could continue to fluctuate between support and resistance levels. The overall picture of the chart does not give a clear direction of the market.
Currently, the first support level is at 61.97, which is a swing low support level. The second support level is at 53.63, which is also a swing low support level. These support levels are expected to be good buying opportunities if the price falls to these levels.
On the other hand, the first resistance level is at 70.71, which is an overlap resistance level. This level could prove to be a significant challenge for buyers, as it has previously acted as a significant resistance level. The second resistance level is at 82.11, which is a pullback resistance level. This level could also act as a significant barrier for buyers to cross.
Traders and investors should be cautious with their trades, as the neutral momentum of the chart does not provide a clear indication of the market direction. It is advised to wait for a clear signal to buy or sell, as the market is currently fluctuating between support and resistance levels.
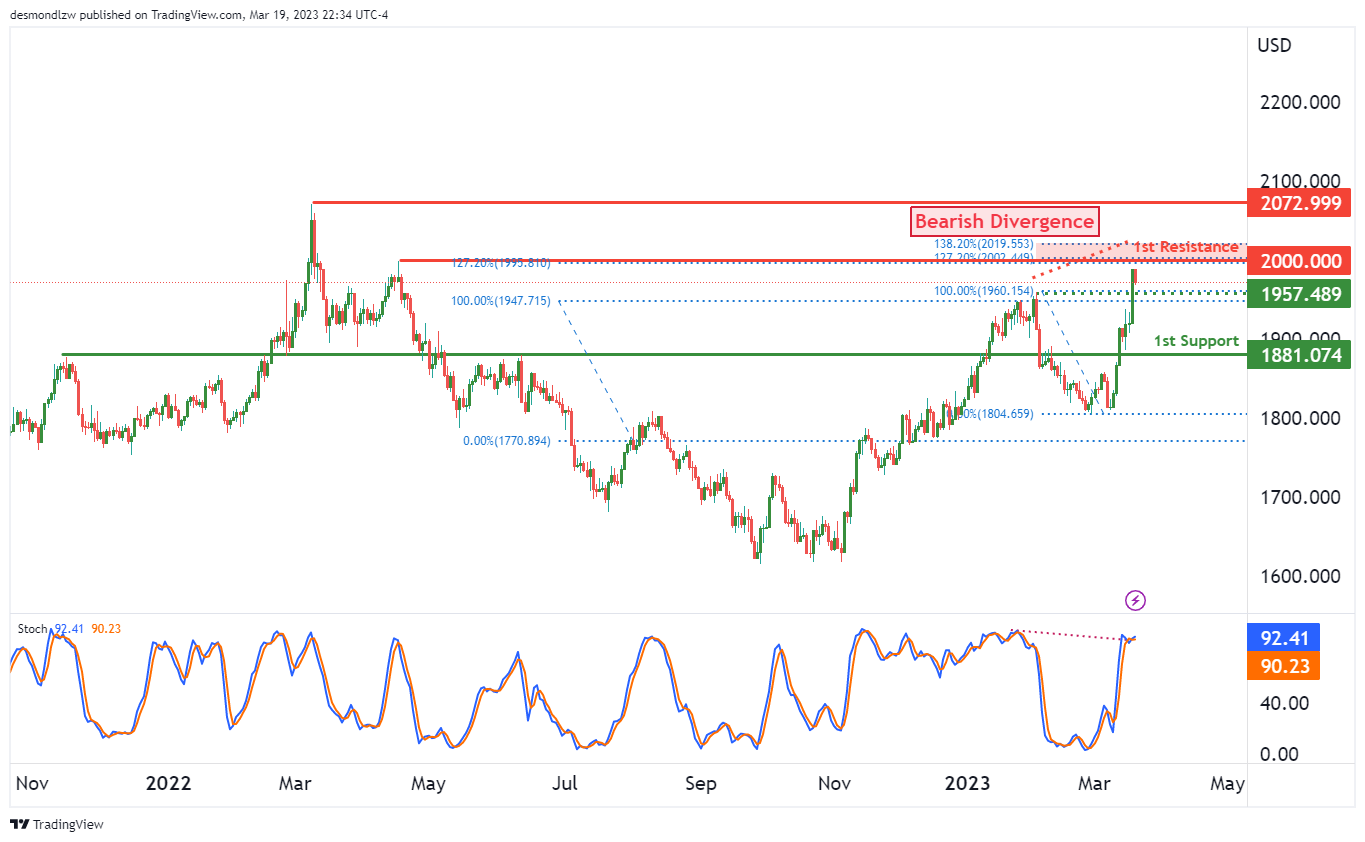
XAU/USD (GOLD):
Gold prices have been under bearish pressure for quite some time now, and the overall momentum of the XAU/USD chart remains bearish. There are several factors contributing to this bearishness, such as the downtrend being reinforced by a major descending trend line.
Currently, the price could potentially fluctuate between the first resistance and the first support level. The first support level is at 1881, which is a key multi-swing low support level. If the price were to break below this level, it could continue the bearish trend towards the intermediate support at 1957, which is a pullback support level.
On the other hand, the first resistance level at 2000 is an important swing high resistance level that could potentially limit any bullish movements. If the price were to break above this level, it could head towards the second resistance level at 2072, which is another significant swing high resistance level.
It is also worth noting that the Stochastic indicator is displaying bearish divergence versus price, which could suggest that a reversal might occur soon. This adds to the bearish sentiment surrounding the XAU/USD chart.
The accuracy, completeness and timeliness of the information contained on this site cannot be guaranteed. IC Markets does not warranty, guarantee or make any representations, or assume any liability regarding financial results based on the use of the information in the site.
News, views, opinions, recommendations and other information obtained from sources outside of www.icmarkets.com, used in this site are believed to be reliable, but we cannot guarantee their accuracy or completeness. All such information is subject to change at any time without notice. IC Markets assumes no responsibility for the content of any linked site.
The fact that such links may exist does not indicate approval or endorsement of any material contained on any linked site. IC Markets is not liable for any harm caused by the transmission, through accessing the services or information on this site, of a computer virus, or other computer code or programming device that might be used to access, delete, damage, disable, disrupt or otherwise impede in any manner, the operation of the site or of any user’s software, hardware, data or property.


