
Key risk events today:
US banks closed in observance of Martin Luther King Day.
EUR/USD:
Weekly gain/loss: -0.30%
Weekly close: 1.1088
Weekly perspective:
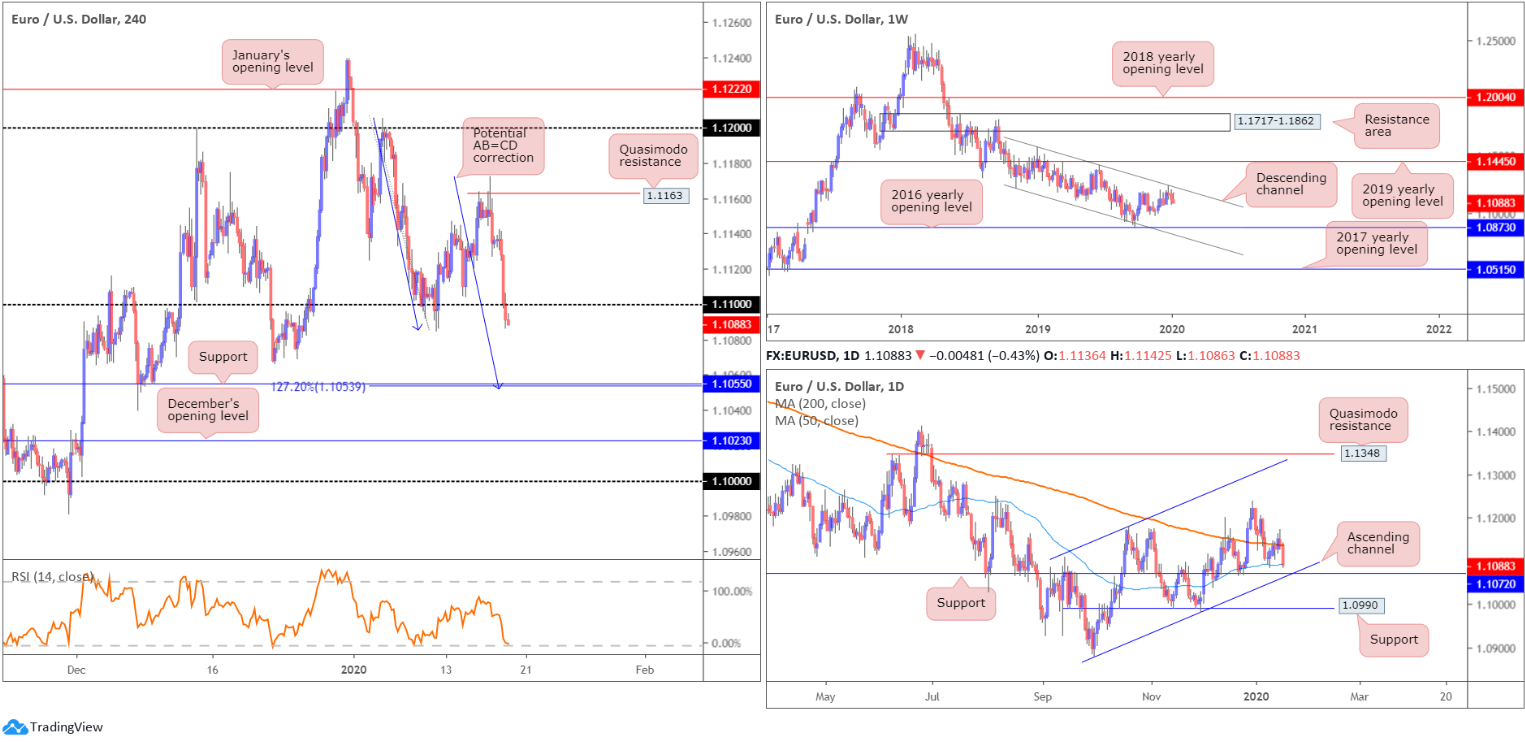
Movement on the weekly timeframe extended losses last week south of long-standing channel resistance, drawn from the high 1.1569. Down for a third successive session, the next downside objective on this timeframe falls in around the 2016 yearly opening level at 1.0873 followed by channel support, taken from the low 1.1109.
To the upside, assuming a break of the said channel resistance, price has the 2019 yearly opening level at 1.1445 to target.
In terms of the primary trend, price has been trading lower since topping in early 2018, at 1.2555.
Daily perspective:
The 200-day SMA (orange – 1.1136) failed to offer much in the way of support in recent trading, with the unit closing the week out marginally beneath the 50-day SMA (blue – 1.1091).
Notable support worthy of mention on this timeframe can be seen at 1.1072, closely shadowed by a channel support, drawn from the low 1.0879. A violation of 1.1072, however, has support priced in at 1.0990 in sight.
H4 perspective:
The US dollar continued to flourish against its major G10 peers Friday, crossing last Friday’s pre-NFP high of 97.58 (US dollar index). The greenback caught tailwinds from stronger-than-expected housing starts data, though largely ignored disappointing industrial production, mixed UoM (consumer sentiment) and US Treasury yields fading daily highs of 1.851%.
EUR/USD fell sharply in London, eventually tripping sell stops south of the 1.11 handle as we entered US trading. Although daily support resides close by at 1.1072 (see above), H4 structure highlights a potential 127.2% AB=CD correction (blue arrows) to support coming in at 1.1055.
Indicator-based traders may wish to note the relative strength index (RSI) is seen fast approaching oversold territory, closing at a value of 31.15.
Areas of consideration:
A retest at 1.11 for potential shorting opportunities could be something to watch out for today. Aside from possible support emerging off the 50-day SMA, both weekly and daily timeframes exhibit room to press lower, at least until reaching daily support at 1.1072, the first downside target. Beyond here, traders likely have their crosshairs fixed on H4 support at 1.1055. In order to achieve favourable risk/reward, drilling down to the lower timeframes at 1.11 may be necessary. An M15 bearish candlestick signal, for example, could offer tighter entry/risk levels than a H4 or H1 signal.
An alternative scenario to keep an eye out for this week, one that goes against weekly direction (see above), is possible buying off daily support 1.1072, given it converges with a daily channel support. Entry based on a H4 close back above 1.11 on the H4 timeframe (considered a bullish indicator) could, therefore, be an idea.
GBP/USD:
Weekly gain/loss: -0.40%
Weekly close: 1.3004
Weekly perspective:
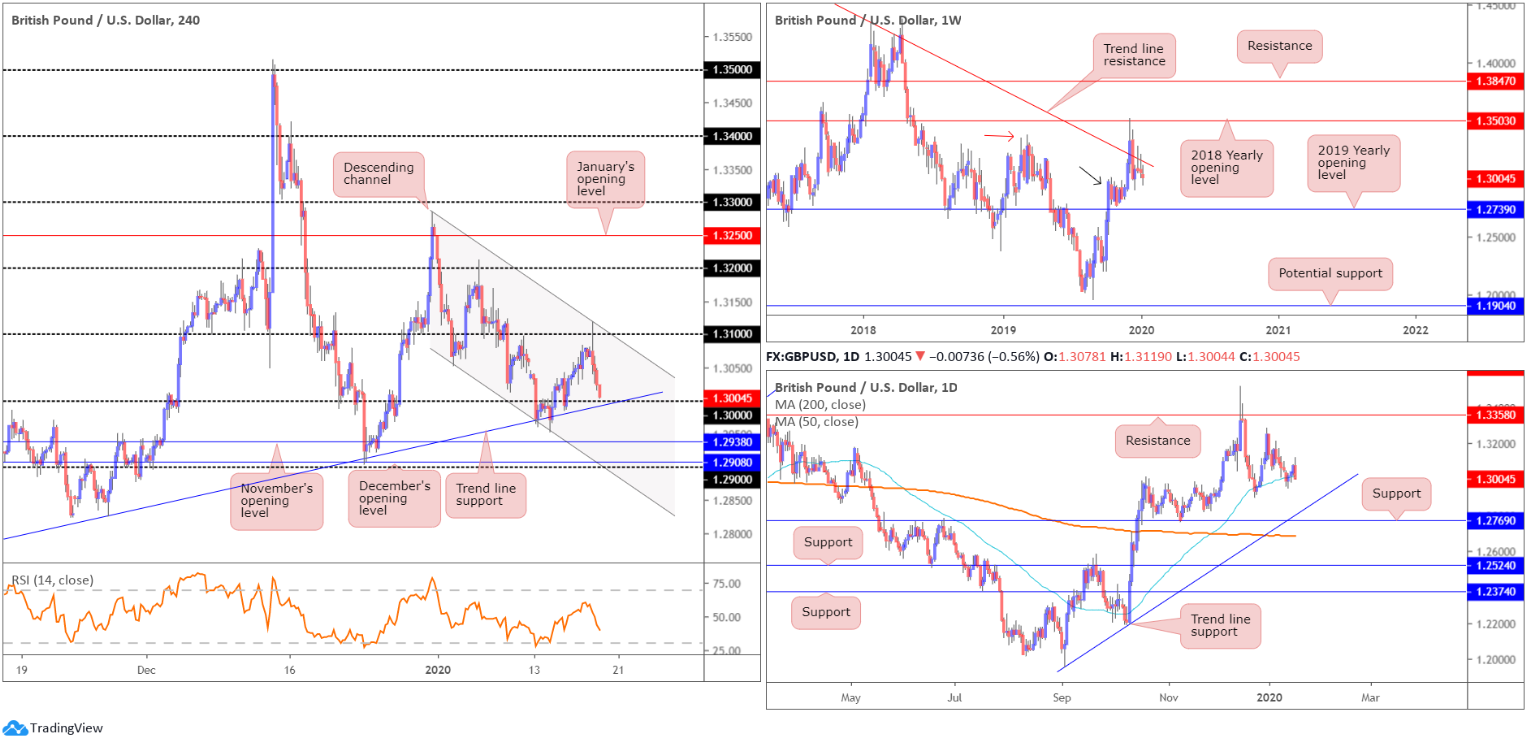
Following two back-to-back shooting star bearish candlestick patterns off long-standing trend line resistance (pencilled in from the high 1.5930), sellers continued to probe lower last week.
Despite recent declines, buyers are attempting to defend nearby demand around the 1.2939 region (black arrow), seduced by the recent break of the notable high at 1.3380 (red arrow).
Continued selling, nevertheless, implies we might see a push lower to the 2019 yearly opening level at 1.2739, consequently tripping sell stops below the aforementioned demand zone.
Daily perspective:
A closer reading on the daily timeframe shows the 50-day SMA (blue – 1.3019) struggled to hold price higher over the course of last week. A minor breach of the dynamic value to lows of 1.2954 took place Tuesday, with Friday also closing the week out marginally lower, by way of an outside bearish day formation. A move lower from here highlights trend line support, taken from the low 1.1958. Another layer of support is visible nearby at 1.2769, sited a few points north of the 200-day SMA (orange – 1.2687).
With respect to resistance, the only level of interest right now sits at the 1.3284 December 31st high and 1.3358, which capped upside since mid-June 2019.
H4 perspective:
A combination of a strengthening greenback, technical selling from 1.31/channel resistance and dismal UK retail sales data guided GBP/USD sharply lower Friday, with the latter, month-over-month, reporting a significantly softer-than-expected print (-0.6% vs. exp. +0.5%). The Office for National Statistics (ONS) noted in the three months to December 2019, the quantity bought in retail sales decreased by 1.0% when compared with the previous three months. ONS also stated, comparing the three months to December 2019 against the same three months a year ago, growth in the quantity bought increased by 1.6% in December 2019, despite a strong decline of 2.2% for department stores.
Technically, price action wrapped up the week a few points shy of the key figure 1.30, intersecting closely with trend line support, extended from the low 1.2768. Combined, these two levels may initiate a wave of buying today, reflecting a somewhat poor light on the daily bearish outside candlestick signal.
Beneath 1.30, November’s opening level at 1.2938 is visible, with a break exposing December’s opening level at 1.2908 and the 1.29 handle.
Areas of consideration:
Traders considering a sell based on Friday’s daily bearish outside candle may opt to wait and see if H4 price closes beneath 1.30 prior to pulling the trigger. A more conservative approach might be to wait for a retest at 1.30 to take hold, preferably in the shape of a H4 bearish candlestick formation as fakeouts through round numbers are common viewing. As for the initial take-profit target, November’s opening level at 1.2938 appears a logical starting base.
A H4 retest formed by ay of a bearish candlestick signal not only recognises seller intent, it helps position entry and risk levels.
AUD/USD:
Weekly gain/loss: -0.39%
Weekly close: 0.6873
Weekly perspective:
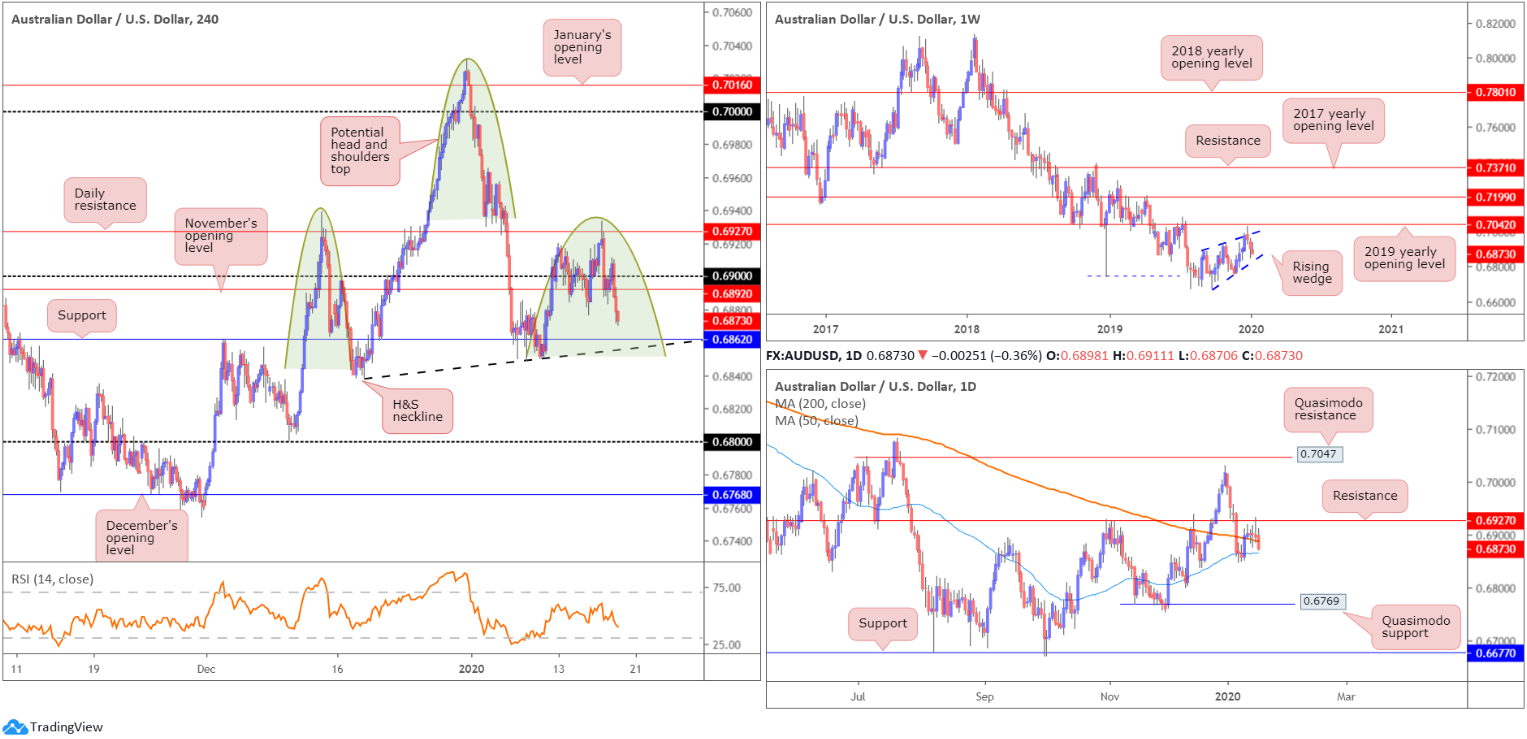
Since registering a bottom in late September at 0.6670, AUD/USD has been carving out what appears to be a rising wedge formation, typically considered a continuation pattern.
Over the past three weeks, price declined back into the rising wedge, following a minor whipsaw through the top edge of the said wedge, missing the 2019 yearly opening level at 0.7042 by a mere ten points. With the primary downtrend having been in full force since topping at 0.8135, in early 2018, a break lower beyond the lower edge of the noted wedge formation could be seen. This would trigger weighty sell stops, both from lower-timeframe traders entering long the correction and longer-term traders’ breakout sell orders.
Daily perspective:
Resistance at 0.6927 capped upside Thursday, establishing a robust selling wick. The 200-day SMA (orange – 0.6887), although held for the best part of the week as support, ceded ground Friday, closing a touch off weekly lows at 0.6870. The 50-day SMA (blue – 0.6864) lies close by, with a break potentially setting the stage for a run towards Quasimodo support coming in at 0.6769.
H4 perspective:
Optimistic data out of China provided fresh impetus to AUD/USD in early Trade Friday. In December, the industrial economy experienced a bounce as the trade deal neared. Industrial production, year-on-year, grew by 6.9%, far exceeding analysts’ forecasts of 5.9% and the fastest rate of growth since March.
Buying was short-lived, however, as the US dollar index continued to navigate higher ground, overthrowing last Friday’s pre-NFP high of 97.58. As highlighted in EUR/USD’s analysis, the dollar caught tailwinds from stronger-than-expected housing starts data, though largely ignored disappointing industrial production, mixed UoM (consumer sentiment) and US Treasury yields fading daily highs of 1.851%.
The H4 candles tunnelled through 0.69 and November’s opening level at 0.6892, exposing support priced in at 0.6862. More broadly, price has been chalking up a potential head and shoulders top pattern since mid-December 2019 (left shoulder sports a top at 0.6938, right shoulder at 0.6933 and the head at 0.7031 – green). The neckline is drawn from the 0.6838 December 18 low and the 0.6850 January 9 low (black line). Traditionally, traders wait for a close beneath the neckline to trigger shorts; others may attempt a short at the right shoulder or even at the formation of the head.
Areas of consideration:
According to our chart studies, focus is likely on completion of the H4 head and shoulder’s top this week. A H4 close beneath the neckline unlocks a potential bearish theme, with an initial (structure) target set at 0.68. H&S traders, though, will be looking for much lower levels.
An ideal entry scenario for most conservative traders would be for a H4 close beneath support at 0.6862 (and the H&S neckline) that’s followed up with a retest in the form of a notable H4 bearish candlestick pattern (entry and risk can be determined according to the candlestick’s structure).
USD/JPY:
Weekly gain/loss: +0.60%
Weekly close: 110.13
Weekly perspective:
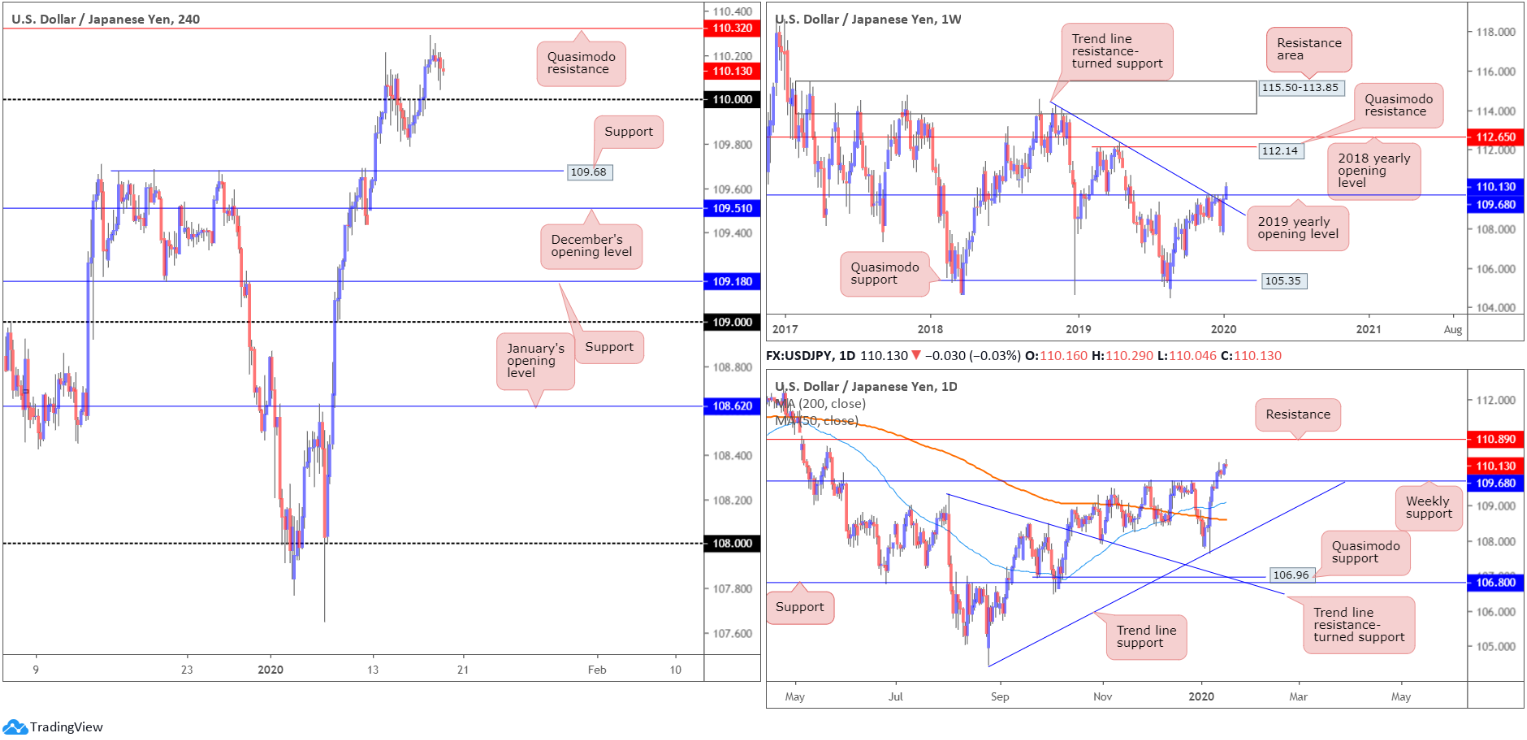
Weekly resistances, comprised of the 2019 yearly opening level at 109.68 and trend line resistance, extended from the high 114.23, gave way in recent trading, perhaps setting a long-term stage for a run to Quasimodo resistance at 112.14 and the 2018 yearly opening level at 112.65.
Prior to further buying, however, the possibility of a retest at 109.68 is certainly there.
In terms of market trend, immediate flows point north.
Daily perspective:
In similar fashion, daily price is establishing ground north of the recently broken weekly resistance at 109.68. According to the daily timeframe, additional upside is also a possibility this week, though resistance is seen around the 110.89 region on this scale.
H4 perspective:
Early Friday witnessed a move to multi-month highs of 110.29. Optimistic data out of China provided fresh incentive, easing concerns over a global economic slowdown and allowed risk-on flows to dominate. However, optimism was short-lived. Leaving Quasimodo resistance at 110.32 (drawn from mid-May 2019) unchallenged, the pair modestly switched gears and headed to lows of 110.04.
Overall, Friday concluded unchanged, hovering a few points north of the 110 handle. Aside from the 109.79 January 15 low, limited support is visible south of 110 until reaching 109.68, closely followed by December’s opening level at 109.51.
Areas of consideration:
All three timeframes point to further upside this week. That being the case, a retest at 110 could be something to watch out for today. A successful retest, preferably by way of a H4 bullish candlestick signal, is likely enough to entice further buying. The idea behind H4 candlestick confirmation is to help identify buyer intent off the round number, which, as most already understand, are frequently prone to whipsaws.
Entry and risk can be determined according to the H4 candlestick pattern, while the first take-profit target is seen at the H4 Quasimodo resistance 110.32, with daily resistance at 110.89 next on tap.
USD/CAD:
Weekly gain/loss: +0.11%
Weekly close: 1.3064
Weekly perspective:
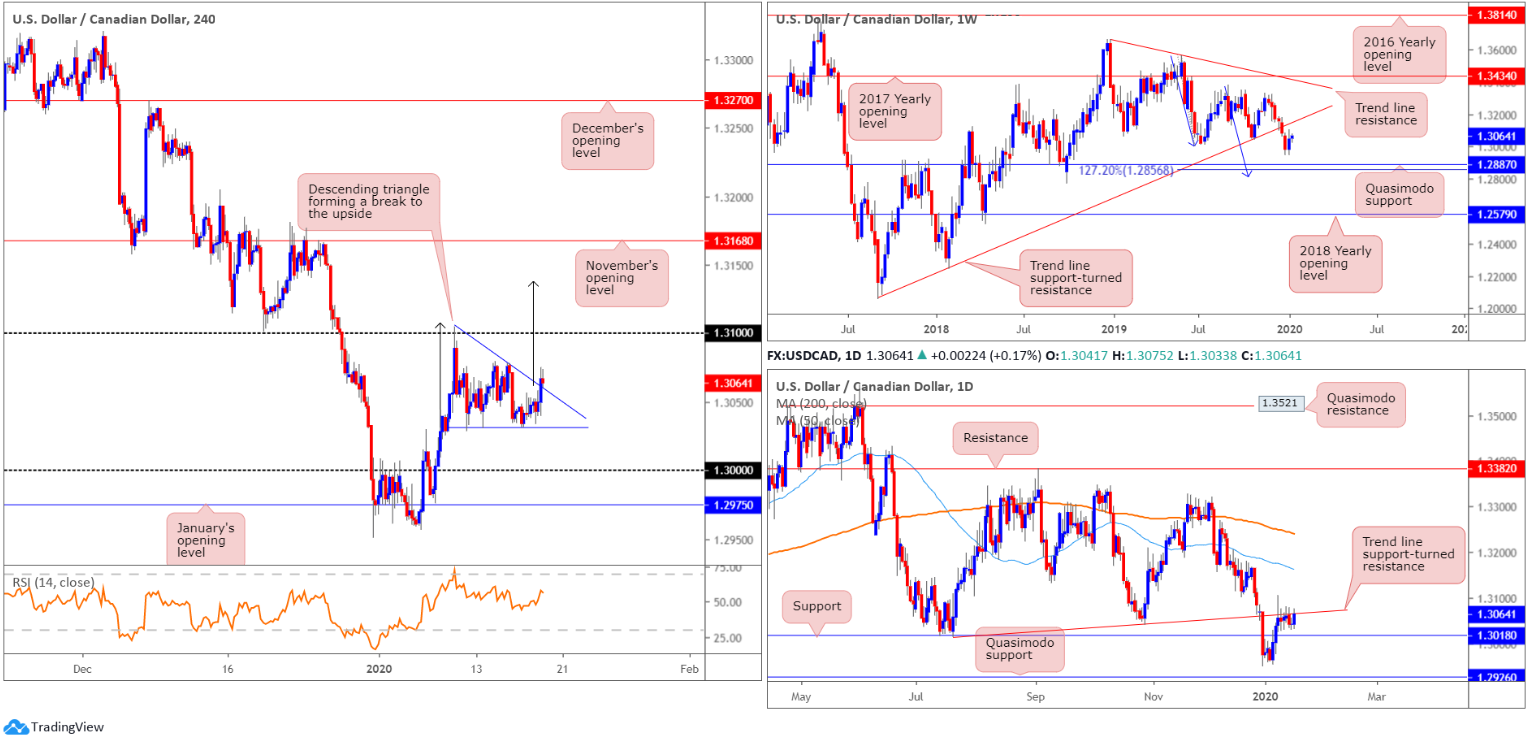
Structure on the weekly timeframe shows price could swing either way this week. To the upside, we have trend line support-turned resistance, extended from the low 1.2061. Lower on the curve, the pair also exhibits scope to test Quasimodo support at 1.2887, positioned close by a 127.2% AB=CD bullish correction (blue arrows) at 1.2856.
The immediate trend has faced north since bottoming in September 2017; however, this move could also be considered a deep pullback in a larger downtrend from the 1.4689 peak in early January 2016.
Daily perspective:
Since January 9, USD/CAD has been confined within a reasonably narrow range, capped at the underside of a trend line support-turned resistance, taken from the low 1.3015. Sellers from this point have support at 1.3018 in view, with a break possibly triggering a push to the 1.2951 December 31 low and Quasimodo support at 1.2926. A break to the upside, nonetheless, has the 50-day SMA (blue – 1.3163) in view, trailed by the 200-day SMA (orange – 1.3241).
H4 perspective:
The US dollar ended Friday a shade higher against the Canadian dollar, adding 22 points, or 0.17%.
Crude oil prices modestly gained for a second successive session, but failed to reclaim $59.00/bbl.
Broad-based USD strength and crude oil’s lacklustre performance permitted a modest USD/CAD advance, breaking a descending triangle formation (1.3104/1.3031). The descending triangle is a bearish formation, usually forming within a downtrend as a continuation pattern. There are instances, however, when descending triangles form as reversal patterns. Therefore, further buying towards the 1.31 handle may be in store early this week.
Areas of consideration:
Traders interested in buying the break of the H4 descending triangle have 1.30 as a potential (structural) take-profit target, followed by the more traditional target of 1.3138 (black arrows – calculated by taking the base and adding this value to the breakout point).
Entry at current price is an option, with protective stop-loss orders plotted beneath the lower edge of the descending triangle pattern. Conservative traders threatened by the possibility of selling off daily trend line resistance may opt to wait and see if a H4 bullish candlestick signal forms, prior to pulling the trigger. Entry and risk levels can then be calculated according to this candlestick pattern.
USD/CHF:
Weekly gain/loss: -0.50%
Weekly close: 0.9674
Weekly perspective:
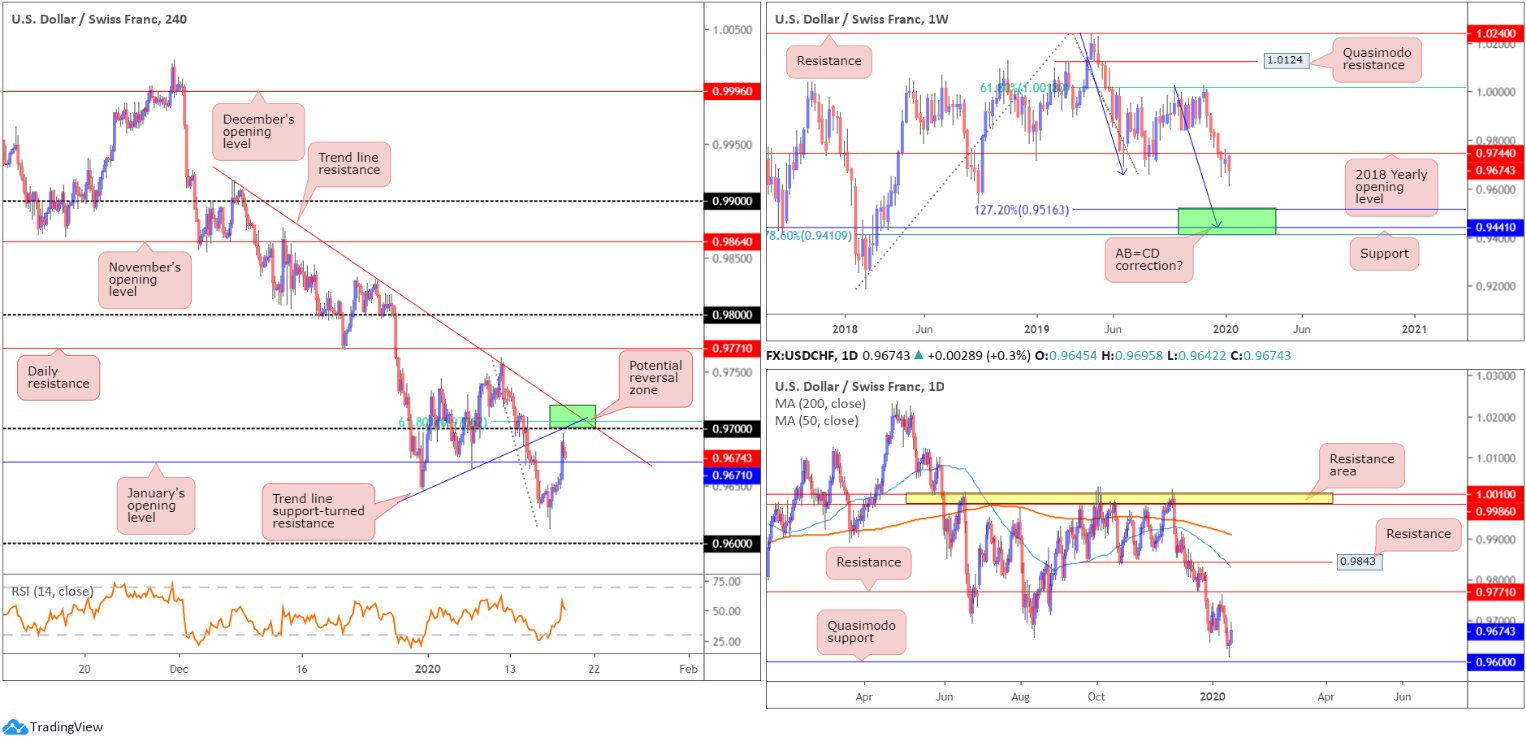
Following a brief pause, that snapped a five-week losing streak and retested the underside of the 2018 yearly opening level at 0.9744, USD/CHF reignited its bearish tone last week. Losing more than 45 points and clocking lows of 0.9613, levels not seen since September 2018, the next downside target sits in the range of 0.9410/0.9516 (comprised of a 78.6% Fibonacci retracement at 0.9410, support at 0.9441 and a 127.2% AB=CD bullish correction [black arrows] at 0.9516 – green]).
Daily perspective:
Leaving Quasimodo support at 0.9600 unopposed (drawn from September 2018), Thursday printed a half-hearted hammer candlestick pattern (considered a bullish signal), followed through on Friday’s modest upside.
Resistance, according to the technical studies presented here, is not expected to arise until crossing swords with 0.9771.
H4 perspective:
USD/CHF built on Thursday’s intraday recovery on Friday, led by broad-based USD buying. The pair refreshed session tops with bulls now poised to approach the 0.97 handle. Although we crossed above January’s opening level at 0.9671, a reasonably strong reversal zone is present around 0.97. Comprised of a 61.8% Fibonacci resistance at 0.9707 and two trend line resistances, we could be heading for fresh yearly lows from here this week, targeting daily Quasimodo support at 0.9600 (the 0.96 handle also on the H4).
Areas of consideration:
Traders interested in 0.97 as a possible sell zone this week have several options, in terms of entry. A simple approach may draw a market sell at 0.97, with a protective stop-loss order above the H4 descending trend line. However, this leaves you open to a fakeout higher. An alternative to this is waiting for a H4 bearish candlestick to form out of 0.97 and entering on the back of its structure. An ultra-conservative approach, on the other hand, may be to only enter short following a H4 close beneath January’s opening level at 0.9671.
Irrespective of the entry technique, reducing risk to breakeven and taking partial profits ahead of Thursday’s low at 0.9613 is worth considering.
Dow Jones Industrial Average:
Weekly gain/loss: +1.75%
Weekly close: 29319
Weekly perspective:
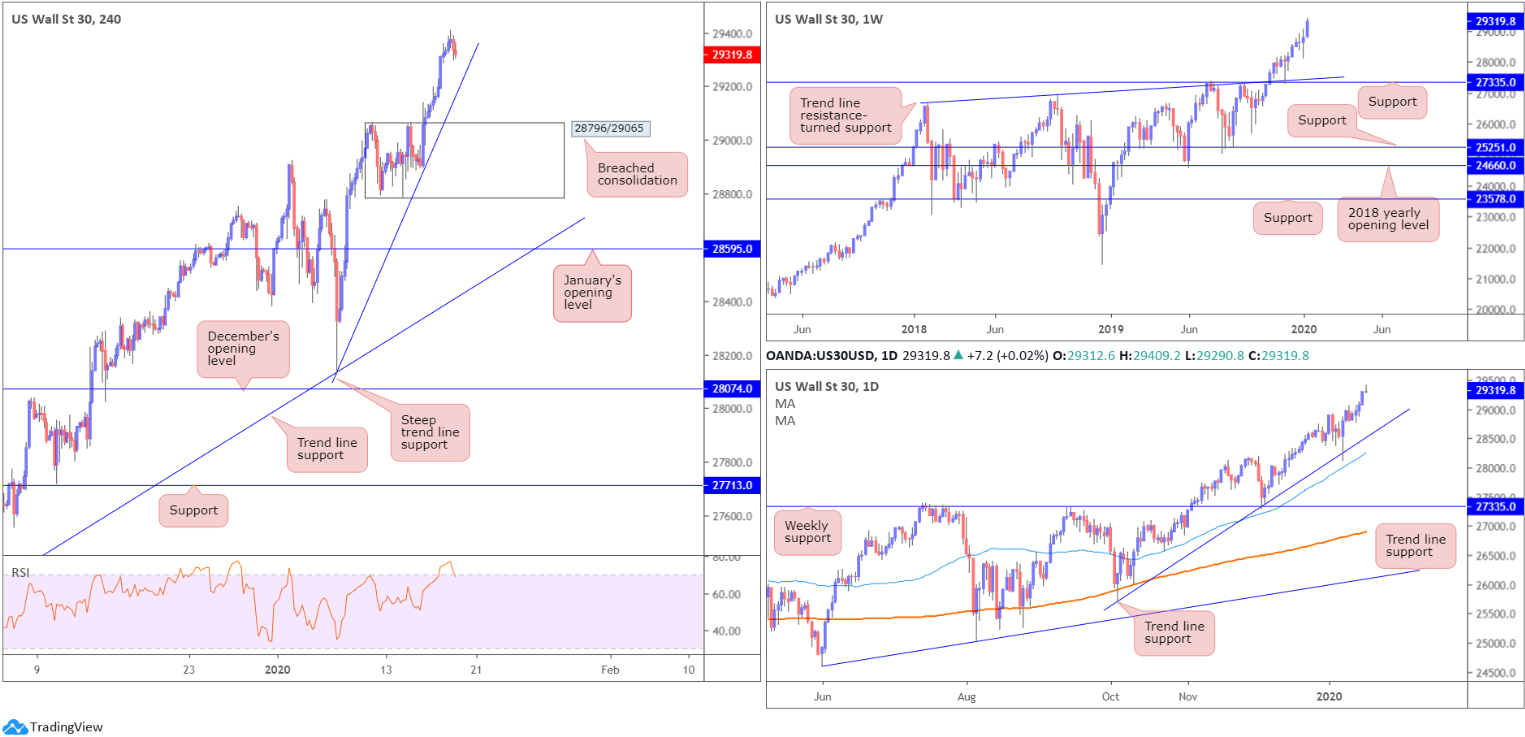
Following a weekly hammer candlestick pattern (considered a buy signal at troughs), formed seven weeks back at the retest of support drawn from 27335, along with trend line support etched from the high 26670, the index has continued to advance higher since, testing fresh record peaks of 29409 last week.
Daily perspective:
Trend line support, extended from the low 25710, remains in motion, bolstered by additional support from the 50-day SMA (blue – 28255).
Candlestick traders may also wish to acknowledge Friday printed a near-perfect ‘gravestone doji’, typically considered a bearish signal.
H4 perspective:
Major US benchmarks finished higher Friday, pencilling in five successive daily bullish candles over the week, largely bolstered by a partial resolution of the US/China trade dispute. The Dow Jones Industrial Average added 50.46 points, or 0.17%; the S&P 500 advanced 12.81 points, or 0.39% and the tech-heavy Nasdaq 100 ended higher by 48.73 points, or 0.53%.
The breakout through the top edge of the H4 consolidation between 29065 and 28796 saw the candles reach highs of 29409. With a modest pullback occurring Friday, a dip lower may be on the cards today as traders liquidate last week’s profits. Indicator-based traders may want to note the relative strength index (RSI) recently dipped lower from a strong overbought reading and is testing the 70.0 value at the moment.
Steep H4 trend line support, taken from the low 28130, is a logical starting point in terms of probable support this week. A break of this line, nonetheless, exposes 29065.
Areas of consideration:
With the uptrend remaining strong, and daily price trading north of trend line support, traders likely have eyes on a retest of either the noted H4 trend line support, or H4 support at 29065, for potential long opportunities.
A retest, preferably in the shape of a H4 bullish candlestick signal (entry/risk levels can be determined according to this formation), would likely be sufficient for traders seeking to join this seemingly everlasting trend.
XAU/USD (GOLD):
Weekly gain/loss: -0.31%
Weekly close: 1557.1
Weekly perspective:
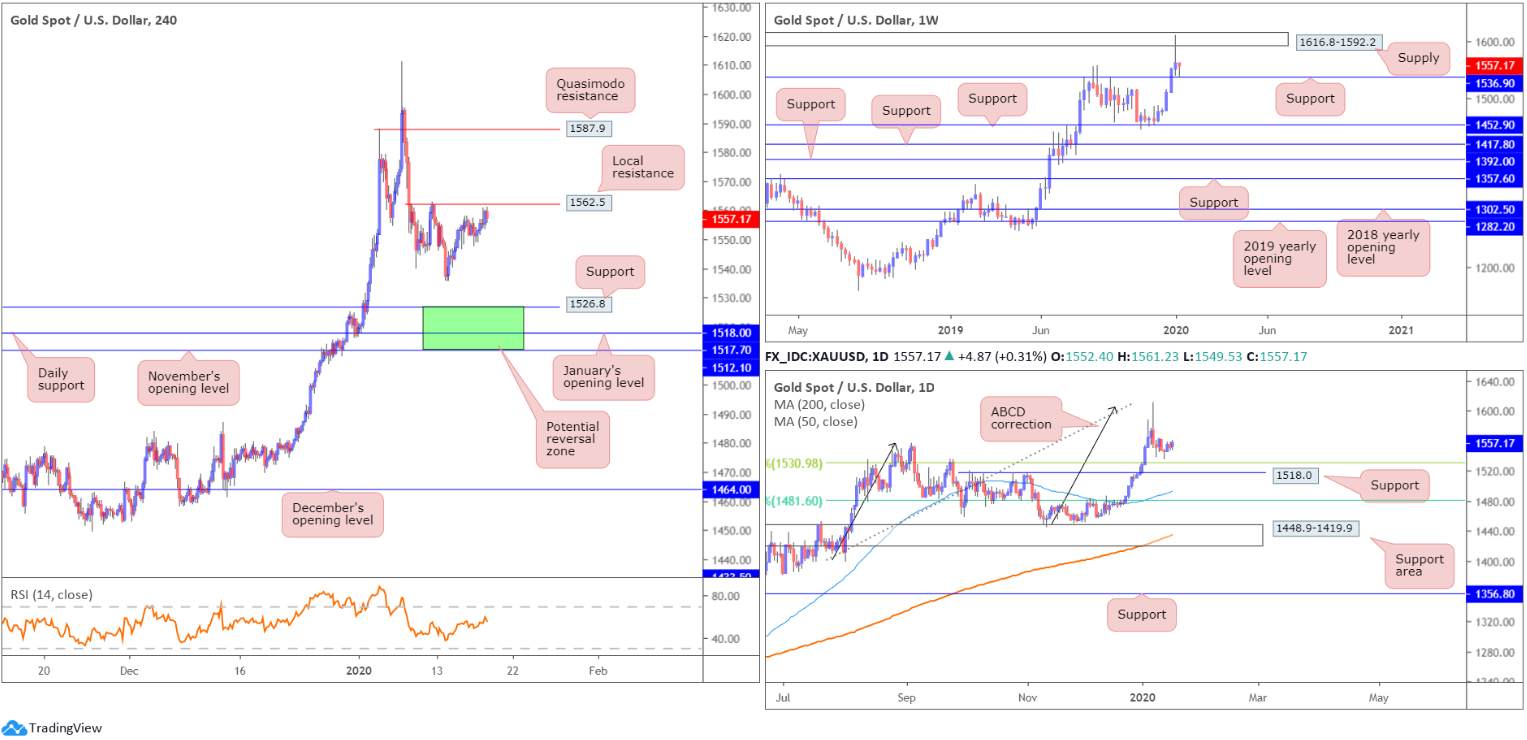
Weekly price is seen recovering from support at 1536.9, following a dominant rejection out of supply at 1616.8-1592.2. A violation of the said support could prompt selling towards additional layers of support at 1452.9, 1417.8, 1392.0 and 1357.6.
Daily perspective:
Although we seem to be entering into a bottoming phase on the daily timeframe, it’s still worth bearing in mind the 38.2% Fibonacci retracement at 1530.9 as support, closely followed by 1518.0. The former offers an initial take-profit target for traders short the ABCD bearish correction (black arrows) at 1608.0.
H4 perspective:
XAU/USD spot prices remained reasonably subdued Friday, gaining nearly five dollars, or 0.31%.
Resistance may form off 1562.5 this week, though a break of this barrier suggests a run towards Quasimodo resistance plotted at 1587.9 could be on the cards. A move lower from 1562.5 may see the 1536.1 January 14 low make an appearance, followed by an area of support (green) between November’s opening level at 1512.1 and support at 1526.8 (daily support at 1518.0 and January’s opening level at 1517.7 seen within).
Areas of consideration:
Should a selloff occur, 1512.1/1526.8 on the H4 timeframe is a zone worth watching for signs of buyer intent. Not only does it boast a strong mix of confluence, the support area forms in line with the primary trend.
Continued buying, along with a H4 close north of H4 resistance at 1562.5, unlocks the door to potential bullish themes, targeting H4 Quasimodo resistance at 1587.9, closely shadowed by the lower edge of weekly supply at 1592.2. Breakout traders will likely enter on the close of the breakout candle, and position stops beneath its respective low (lower candle shadow). A more conservative approach entails waiting for a retest at 1562.5 to occur and entering based on the rejection candle’s framework, either at market or using a buy stop entry.
The accuracy, completeness and timeliness of the information contained on this site cannot be guaranteed. IC Markets does not warranty, guarantee or make any representations, or assume any liability regarding financial results based on the use of the information in the site.
News, views, opinions, recommendations and other information obtained from sources outside of www.icmarkets.com.au, used in this site are believed to be reliable, but we cannot guarantee their accuracy or completeness. All such information is subject to change at any time without notice. IC Markets assumes no responsibility for the content of any linked site.
The fact that such links may exist does not indicate approval or endorsement of any material contained on any linked site. IC Markets is not liable for any harm caused by the transmission, through accessing the services or information on this site, of a computer virus, or other computer code or programming device that might be used to access, delete, damage, disable, disrupt or otherwise impede in any manner, the operation of the site or of any user’s software, hardware, data or property.


