
EUR/USD:
Weekly Gain/Loss: +0.22%
Weekly Close: 1.1436
Weekly perspective:
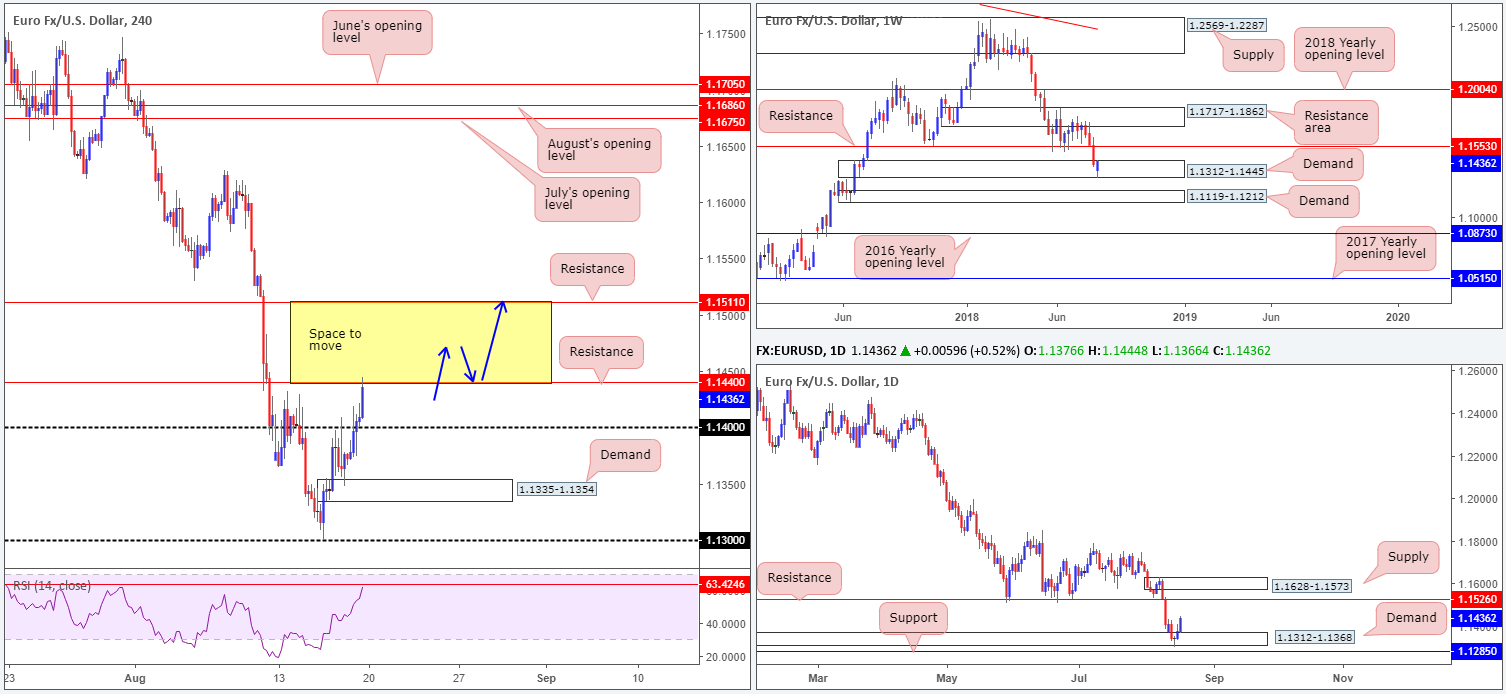
Despite witnessing a mild break of demand at 1.1312-1.1445, the shared currency concluded the week modestly in the green. Breaking a three-week bearish phase, and closing not too far off its weekly high, we can see the buyers are growing in confidence. Last week’s move, technically speaking, suggests we may observe a move towards neighboring resistance at 1.1553 this week.
Daily perspective:
Demand at 1.1312-1.1368, seen positioned within the lower limits of the current weekly demand, also remains firmly in play. The next upside target on this scale, however, falls in around the 1.1526 neighborhood, followed closely by a layer of supply priced in at 1.1628-1.1573. Note the weekly resistance level mentioned above at 1.1553 is seen located between the two aforementioned daily targets.
H4 perspective:
A brief summary of Friday’s movement on the H4 timeframe shows the 1.14 handle failed to suppress buying as the unit entered US hours. Buying pressure came in on the back of news the US and China will resume trade talks, though the move was somewhat overshadowed after reports the US are planning to demand China to let the Yuan appreciate. As you can see, Friday’s session ended with price shaking hands with resistance coming in at 1.1440. It might also be worth penciling in the RSI is seen approaching notable resistance around the 63.42 range.
Areas of consideration:
While weekly and daily action portend buying at the moment, current H4 resistance at 1.1440 could hamper this move. To become buyers in this market, the team has noted to consider waiting and seeing if H4 price can close above 1.1440. A close above here that’s followed up with a retest (preferably in the shape of a full or near-full-bodied H4 bull candle – stop-loss orders can be positioned beyond the low of this formation) as support (see blue arrows) would, according to overall structure, likely be sufficient enough to encourage buying to at least H4 resistance at 1.1511 – sited just south of daily resistance highlighted above at 1.1526.
Today’s data points: German Buba President Weidmann speaks; FOMC member Bostic also takes to the stage.
GBP/USD:
Weekly Gain/Loss: -0.16%
Weekly Close: 1.2746
Weekly perspective:
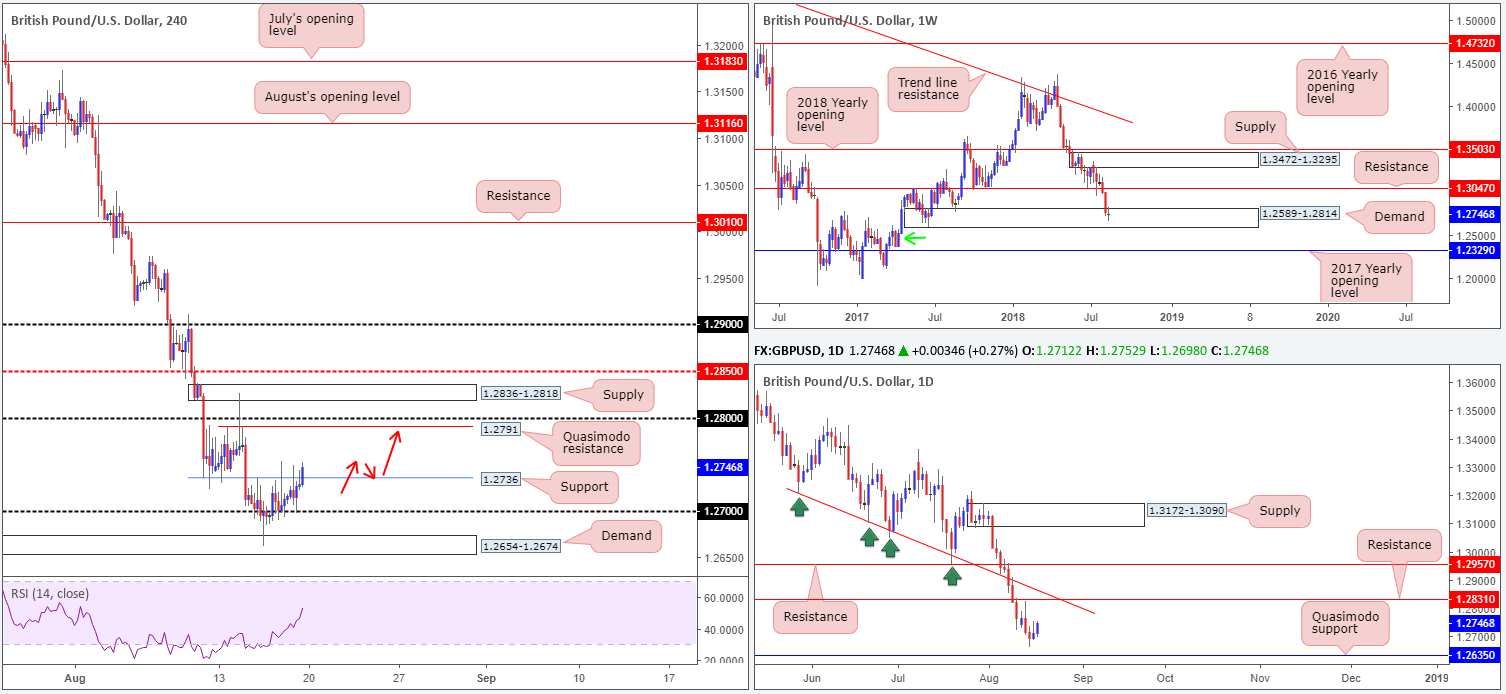
Buyers and sellers entered into a phase of indecisiveness last week in the wake of the previous week’s precipitous decline. In the shape of a clear-cut indecision candle, price action remains firmly within the walls of demand at 1.2589-1.2814. Having seen this area tested once already in August 2017, further selling could be seen. Beyond the current zone, demand marked with a green arrow at 1.2365-1.2555 is likely the next hurdle in the firing range, though with the 2017 yearly opening level lurking just beneath it at 1.2329, there’s a possibility price could fake lower to bring in buyers from this hurdle.
Daily perspective:
Two main structures decorate the daily timeframe at the moment. Resistance at 1.2813 is an interesting level due to it seen converging closely with trend line resistance (taken from the low 1.3204). To the downside, a Quasimodo support at 1.2635 is seen, which, as you can probably see, is situated within the walls of the current weekly demand zone. Both levels have equal chance of entering the fold this week.
H4 perspective:
News the US and China will resume trade talks weighed on the buck amid Friday’s trade, prompting a round of GBP buying. Resistance at 1.2736 (now acting support) was eventually taken out, possibly clearing the path northbound towards a Quasimodo resistance at 1.2791, shadowed closely by the 1.28 handle.
Areas of consideration:
Longer term, we’re expecting weekly buyers to at least bring price to daily resistance mentioned above at 1.2831.
Intraday, assuming one is able to pin down a long above 1.2736 (preferably a retest play formed in the shape of a small full or near-full-bodied H4 bull candle – see red arrows), this could be enough to draw in buyers towards the aforementioned H4 Quasimodo resistance/1.28. The ultimate take-profit target from 1.2736 can be set around H4 supply drawn from 1.2836-1.2818, which houses the current daily resistance level at 1.2831 within.
Today’s data points: FOMC member Bostic takes to the stage.
AUD/USD:
Weekly Gain/Loss: +0.21%
Weekly Close: 0.7313
Weekly perspective:
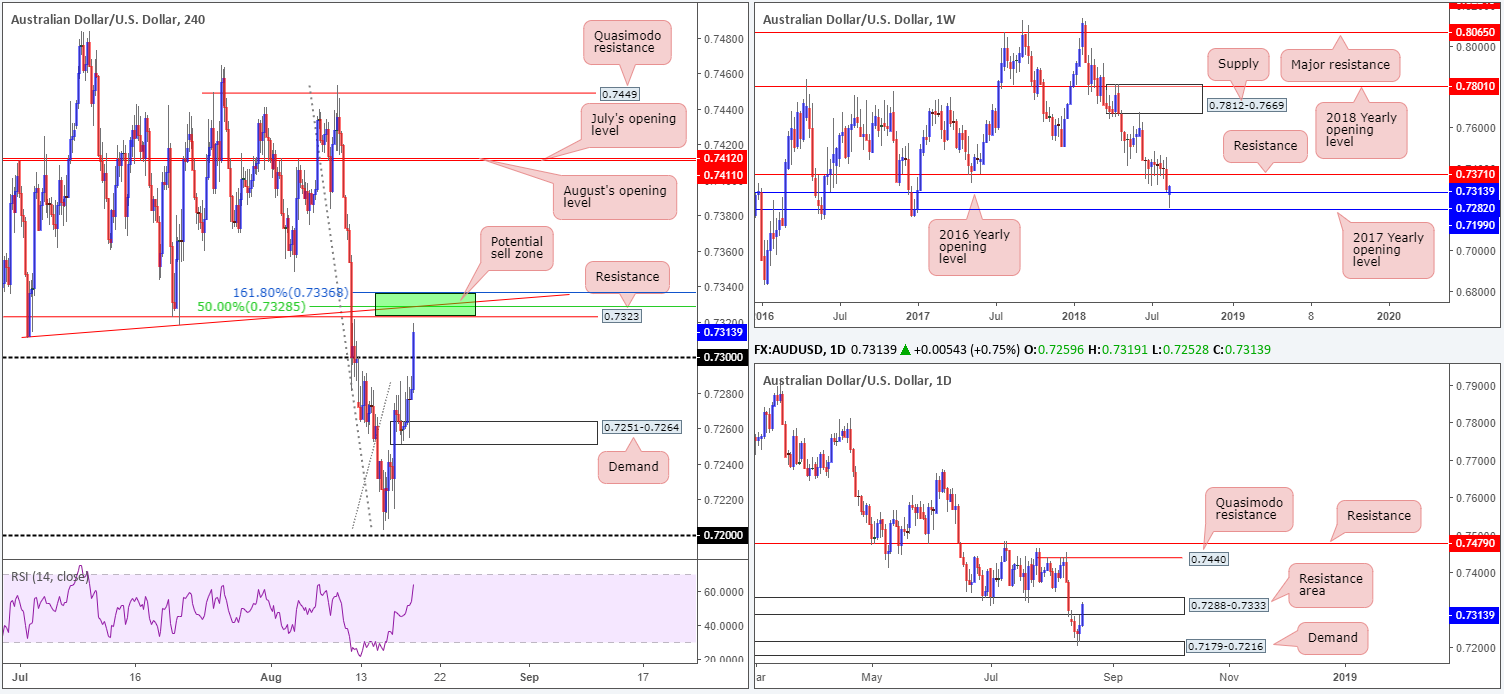
By way of a strong bullish pin-bar formation, price action whipsawed through the 2016 yearly opening level at 0.7282 last week and came within striking distance of tapping the 2017 yearly opening level at 0.7199. Whilst the bullish candlestick could entice buying this week, traders are urged to exercise caution given nearby resistance at 0.7371.
Daily perspective:
Demand at 0.7179-0.7216, as you can see, did a superb job of controlling price action last week. Wednesday’s session came in with a nice-looking bullish pin-bar formation followed by two continuous days of buying, consequently ending the week touching gloves with a resistance area priced in at 0.7288-0.7333. Note the aforementioned weekly resistance level is seen positioned directly above this zone. Beyond these two barriers, nonetheless, traders’ crosshairs will likely be pinned on the daily Quasimodo resistance level at 0.7440.
H4 perspective:
On the back of a waning USD, Friday’s movement on the H4 timeframe witnessed a strong close beyond the 0.73 handle. Although this is likely a bullish signal to most, a considerable portion of resistance lurks just ahead: the 0.7336/0.7323 region marked in green. Comprised of a 161.8% Fib ext. point at 0.7336 (taken from the low 0.7202), a trend line resistance (extended from the low 0.7312), a 50.0% resistance value at 0.7328 (drawn from the high 0.7453) and a resistance level parked at 0.7323, a bounce from here back down to at least 0.73 is feasible. In addition to this confluence, let’s remember where we’re trading from on the bigger picture: the daily resistance area at 0.7288-0.7333. The only grumble concerning a short from 0.7336/0.7323 is, of course, the weekly timeframe suggesting a move to weekly resistance at 0.7371.
Areas of consideration:
Should H4 price connect with 0.7336/0.7323, sells are an option with stop-loss orders positioned a few pips above the zone. In terms of trade management, once (or indeed if) the unit crosses swords with 0.73, it might be an idea to consider reducing risk to breakeven. In an ideal world, a close back beneath 0.73 would be best, as this places H4 demand at 0.7251-0.7264 in the firing range. However, in light of weekly movement, further buying could still take place. Therefore, it’s always best to trade on the side of caution!
Today’s data points: RBA Gov. Lowe speaks; FOMC member Bostic also takes to the stage.
USD/JPY:
Weekly Gain/Loss: -0.32%
Weekly Close: 110.46
Weekly perspective:
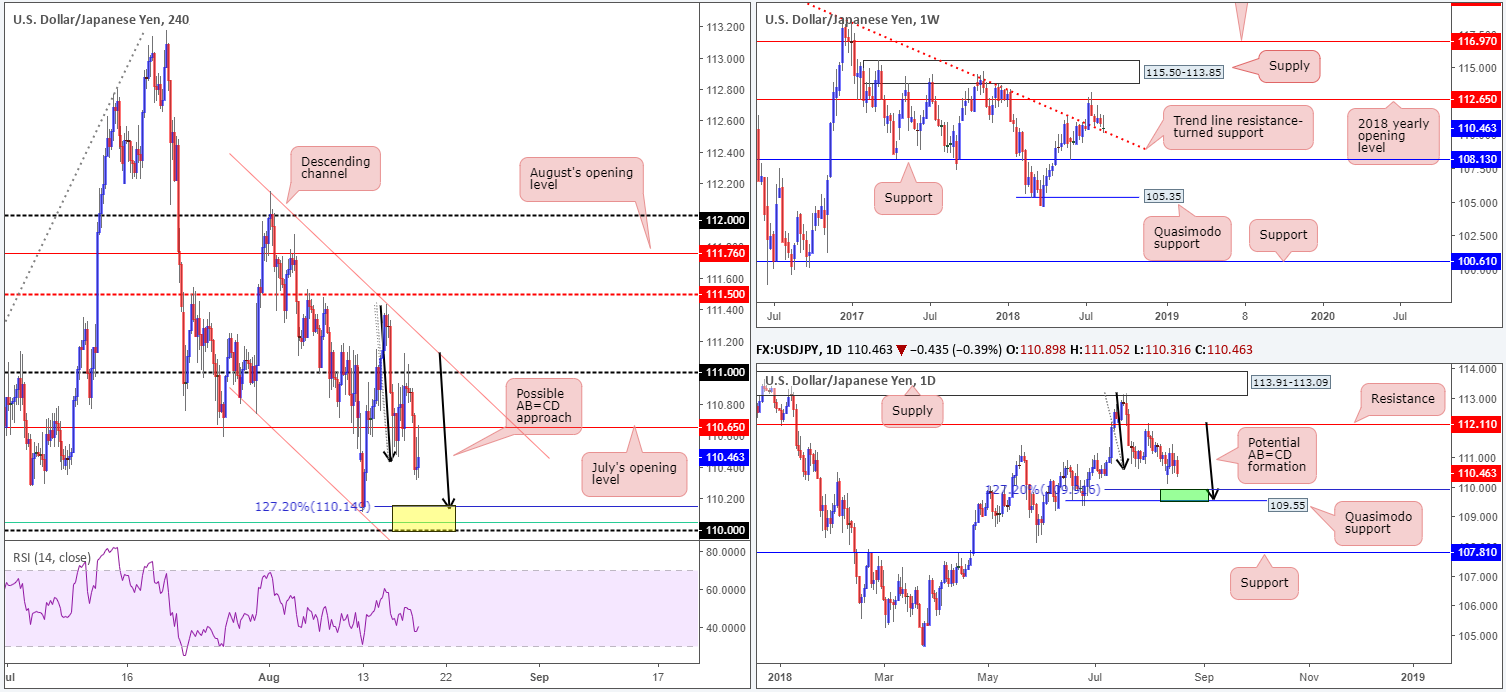
Weekly movement, as you can see, remains toying with a trend line resistance-turned support (taken from the high 123.57). Having seen this line hold firm as resistance on a number of occasions in the past, it’s likely to remain a defensive barrier going forward, despite last week’s action concluding in the shape of a bearish pin-bar formation. Further buying from current price has the 2018 yearly opening level at 112.65 to target.
Daily perspective:
With respect to daily structure, a move lower is in the offing. The possible AB=CD formation (black arrows) that completes around the 127.2% Fib ext. point at 109.91, followed closely by a Quasimodo support at 109.55 is the next base of obvious support on this scale (green area).
H4 perspective:
A closer look at price action on the H4 timeframe shows the unit failed to sustain gains above the 111 handle in early trade on Friday. The USD/JPY continued to press lower throughout the day, recapturing July’s opening level at 110.65 and retesting the underside of the base into the day’s close.
Below here, traders are faced with the 110 handle, which happens to fuse nicely with a possible AB=CD (black arrows) 127.2% Fib ext. point at 110.14 and a 61.8% Fib support value in green at 110.04 (yellow zone). Slightly beyond here, though, we also have a channel support (taken from the low 110.73) in view.
Areas of consideration:
The area that really stands out at the moment is the 110 region for possible longs. Not only does this number boast a reasonable value of H4 confluence, the nearby green zone on the daily chart highlighted above at 109.55/109.91 provides additional weight.
Aggressive traders may opt to buy 110.14, with stop losses sited beneath 109.91 (the daily 127.2% Fib extension).
Conservative traders, on the other hand, are likely to position stops beneath 109.55 (the lower edge of the entire daily support zone), irrespective of whether they enter at 110.14 or 110.
The first upside target to be aware of falls in at July’s opening level underlined above at 110.65.
Today’s data points: FOMC member Bostic takes to the stage.
USD/CAD:
Weekly Gain/Loss: -0.57%
Weekly Close: 1.3061
Weekly perspective:
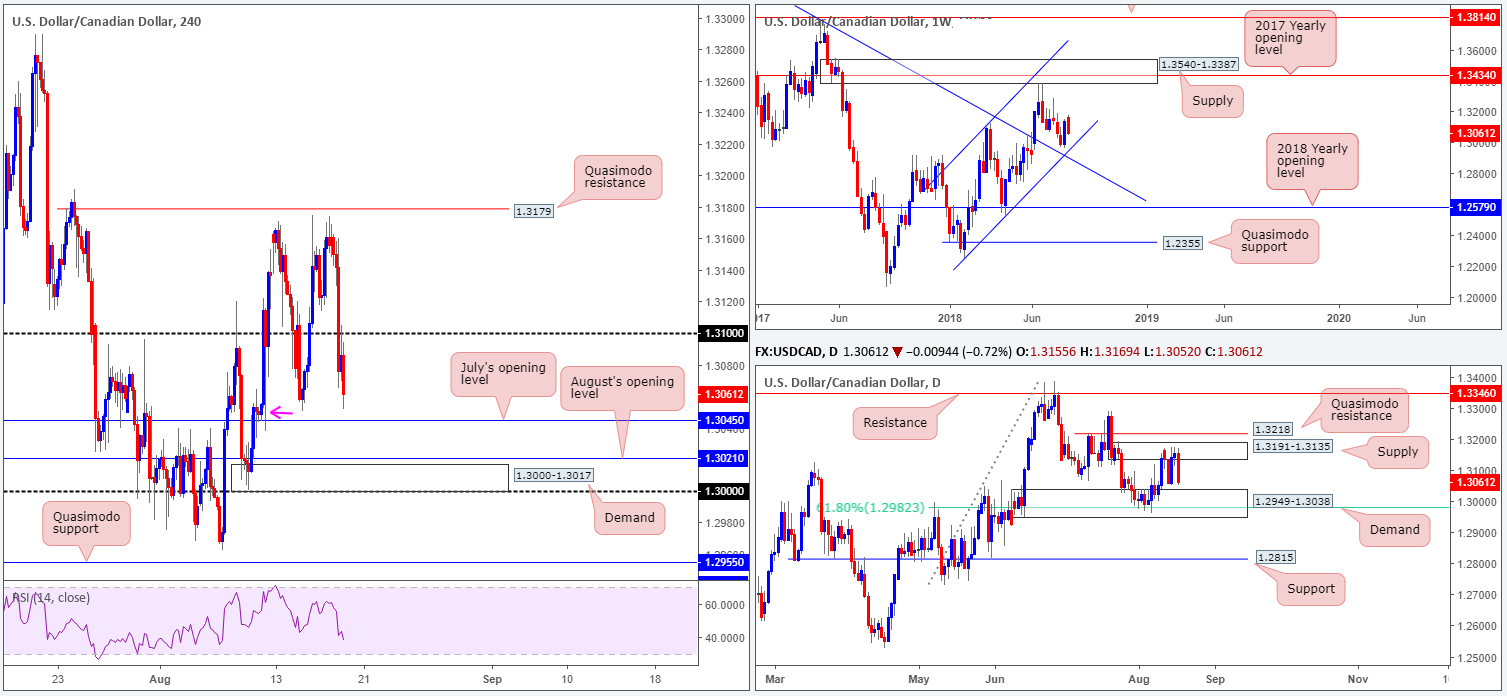
Since the beginning of the year, the USD/CAD has been compressing within an ascending channel formation (1.2247/1.3098). Of late, traders may have noticed the unit basing just north of the lower edge of this channel, seen bolstered by additional support in the form of a nearby trend line resistance-turned support (etched from the high 1.4689).
Daily perspective:
The story on the daily timeframe brings supply at 1.3191-1.3135 and a demand base located at 1.2949-1.3038 into the picture. Note this demand also houses a 61.8% Fib support value at 1.2982. A break of this area has support at 1.2815 in view, whereas a push beyond supply almost immediately places the market at Quasimodo resistance drawn from 1.3218.
H4 perspective:
The impact of Friday’s stronger-than-expected Canadian inflation report sent price southbound, breaking through the 1.31 handle. Although the pair recovered a portion of its losses in the next hour, the unit failed to reclaim 1.31 and concluded the day closing just north of July’s opening level at 1.3045.
While intraday traders are likely to show interest in 1.3045 today, given it unites with a demand area marked with a pink arrow at 1.3037-1.3055, traders are urged to consider the possibility of a drive below here into daily demand mentioned above at 1.2949-1.3038.
Areas of consideration:
The H4 demand at 1.3000-1.3017 is an area of interest. Besides forming on top of the key figure 1.30, it is positioned a few pips beneath August’s opening level at 1.3021 and is also sited within the walls of the current daily demand area. Therefore, a bounce from this zone is expected. However, traders are still urged to wait for additional candle confirmation (a full or near-full-bodied H4 bull candle) before pulling the trigger, since round numbers (1.30) are prone to fakeouts. On top of this, there’s also a chance weekly sellers may push price lower to reach the weekly channel support.
Today’s data points: FOMC member Bostic takes to the stage; Gov. Council Member Wilkins speaks.
USD/CHF:
Weekly Gain/Loss: Flat
Weekly Close: 0.9949
Weekly perspective:
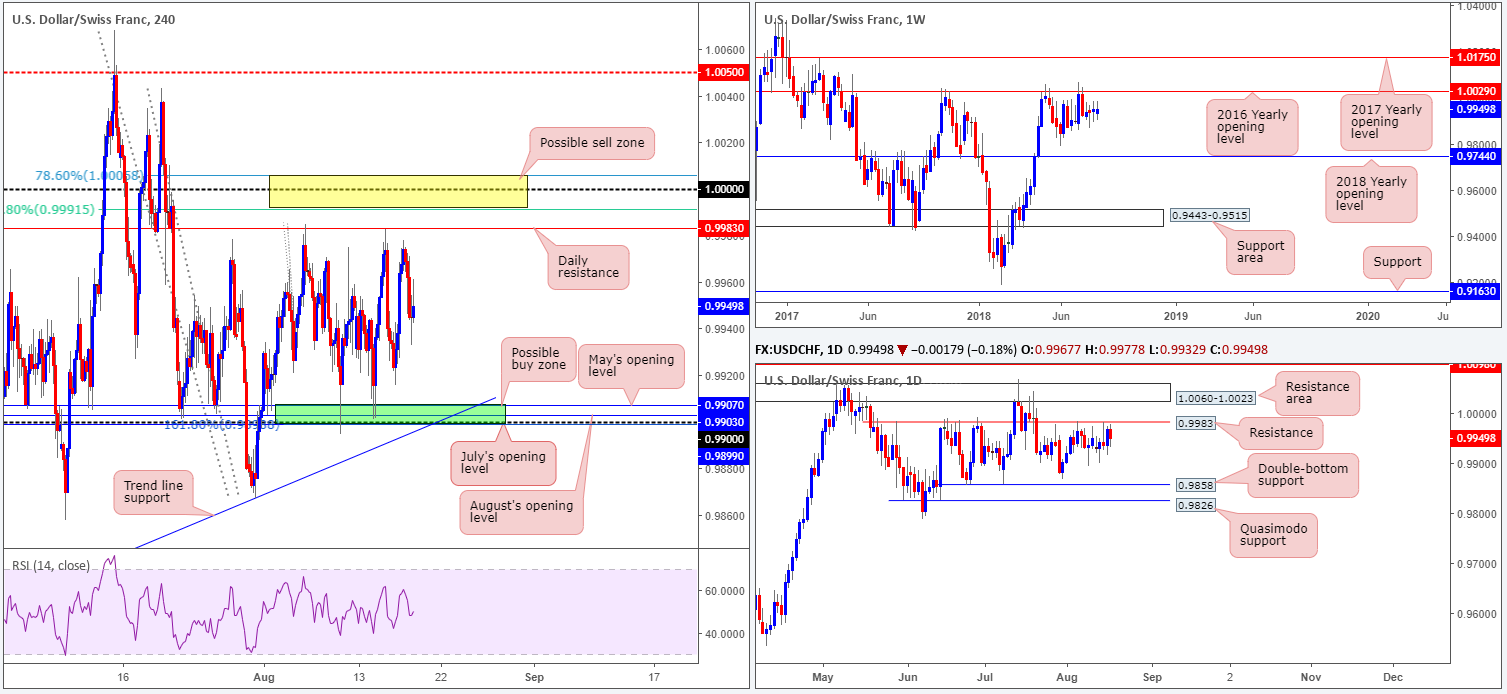
The Swissie was effectively left unchanged last week, forming yet another indecision candle just south of a key resistance at 1.0029: the 2016 yearly opening level. Holding price lower on two occasions in 2017, and twice already in 2018, this level commands attention! Downside supports to keep eyeballs on this week fall in at June’s low 0.9788, followed by the 2018 yearly opening level at 0.9744.
Daily perspective:
Resistance at 0.9983 continues capping upside at the moment. In the event of a break north, nonetheless, the resistance area planted at 1.0060-1.0023 (holds the 2016 yearly opening level at 1.0029 mentioned on the weekly timeframe) is likely the next base in the firing range. A move lower from current price, on the other hand, has 0.9858 in view: a double-bottom support, shadowed closely by a Quasimodo support at 0.9826.
H4 perspective:
H4 action has successfully traded range bound for two weeks between the aforesaid daily resistance level and a H4 buy zone marked in green at 0.9899/0.9907 (comprised of July’s opening level at 0.9899, a 161.8% Fib ext. point at 0.9899 [taken from the high 0.9984], the 0.99 handle, August’s opening level at 0.9903 and May’s opening level at 0.9907).
Although this consolidation remains intact, traders are still reminded to keep eyeballs on parity (1.0000). A number surrounded by two Fibonacci resistances: 78.6% at 1.0005 and 61.8% at 0.9991 (yellow area), therefore making it a reasonable sell zone.
Areas of consideration:
Both H4 zones: 0.9899/0.9907 and 1.0005/0.9991 should remain on the watch list for trading opportunities this week until one of these areas are engulfed. Traders are also still urged to wait for additional H4 candle confirmation at both the above said areas prior to pulling the trigger, preferably in the shape of a full or near-full-bodied candle (stop-loss orders can then be positioned beyond the extreme of this formation). The reason being is round numbers (1.0000 and 0.99) tend to attract ‘stop runs’ (fakeouts). There’s little worse than having your stop-loss order triggered by a hair only to watch price shortly after hit your take-profit area, which in this case would be the opposing buy or sell zone discussed here, either the H4 green or yellow zone.
The reason for not including the current daily resistance as a possible sell zone is simply due to the threat of a fakeout beyond this level towards 1.0000.
Today’s data points: FOMC member Bostic takes to the stage.
Dow Jones Industrial Average:
Weekly Gain/Loss: +1.38%
Weekly Close: 25695
Weekly perspective:
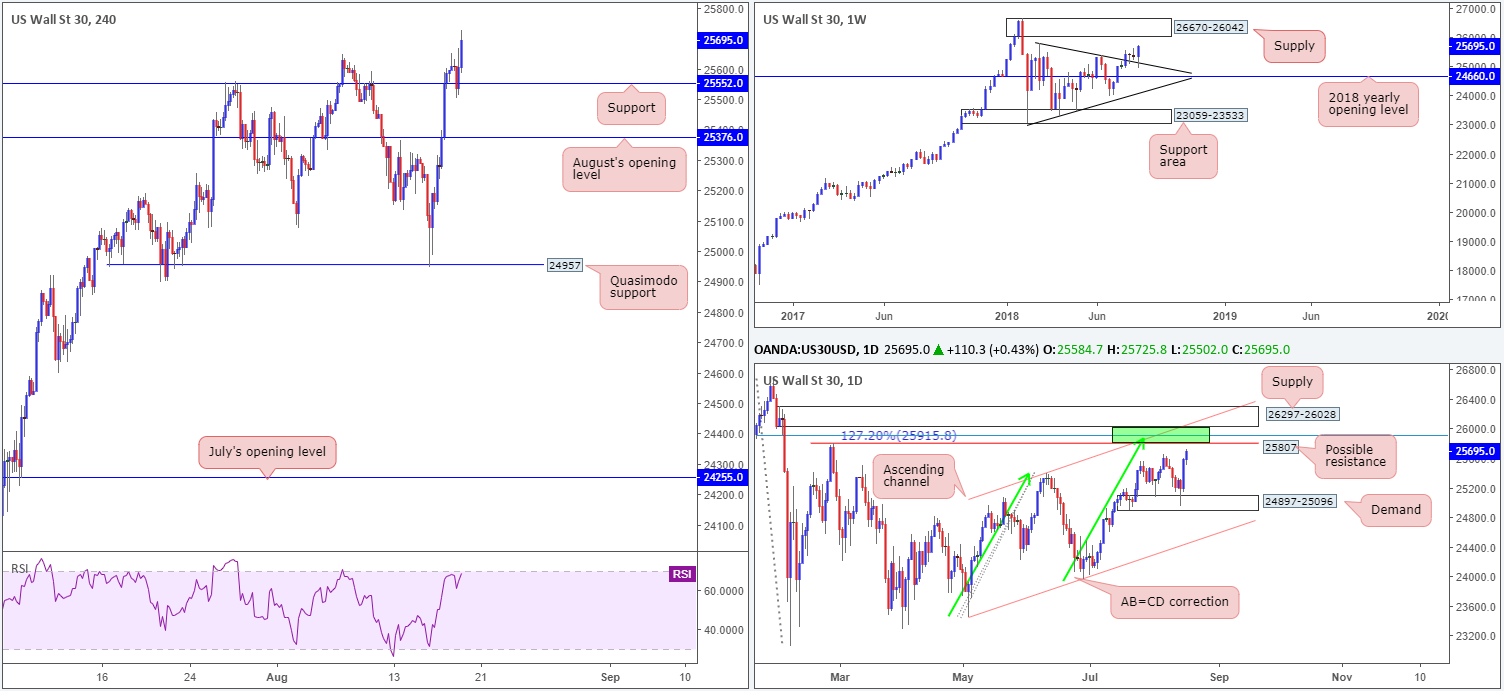
Over the course of last week’s session, the market observed a strong retest of a trend line resistance-turned support (etched from the high 25807). In view of this, a run up to supply coming in at 26670-26042 is a possible scenario to keep tabs on this week.
Daily perspective:
In conjunction with weekly action, supply at 26297-26028 is an interesting area. Not only does it boast strong downside momentum from its base and is seen glued to the underside of the noted weekly supply, it converges closely with an area of confluence: channel resistance (taken from the high 25399), a resistance level at 25807 (Feb 27 high), a 127.2% AB=CD (green arrows) correction point at 25915 and a 78.6% Fib resistance at 25904 (green zone).
H4 perspective:
A quick look at recent dealings on the H4 scale shows support at 25552 held ground. The index gained traction on Friday following news of China sending officials to Washington to talk about trade, consequently lifting price action to fresh highs of 25725. In terms of the next upside target on this scale, we do not see a whole lot stopping price from reaching resistance at 25923 (not seen on the screen). Also worth noting on this timeframe is the RSI indicator seen nearing overbought territory.
Areas of consideration:
The H4 resistance mentioned above at 25923 is certainly an area worth watching this week. Positioned nicely within the daily area of (green) confluence, a response from this angle is likely. Yet, do not go into this full throttle! There’s a chance this level could break as the index may want to test the underside of daily supply at 26297-26028 or even bring the market to weekly supply at 26670-26042. For that reason, tread carefully!
Should the market retest H4 support at 25552 this week (before reaching the green area of confluence on the daily timeframe), longs from this angle are also an option. Waiting for a full or near-full-bodied H4 bull candle to form, however, is advised. This will help avoid being taken out on a fakeout and offers an area to position stops (below the rejection candle’s tail).
Today’s data points: FOMC member Bostic takes to the stage.
XAU/USD (Gold)
Weekly Gain/Loss: -1.98%
Weekly Close: 1186.3
Weekly perspective:
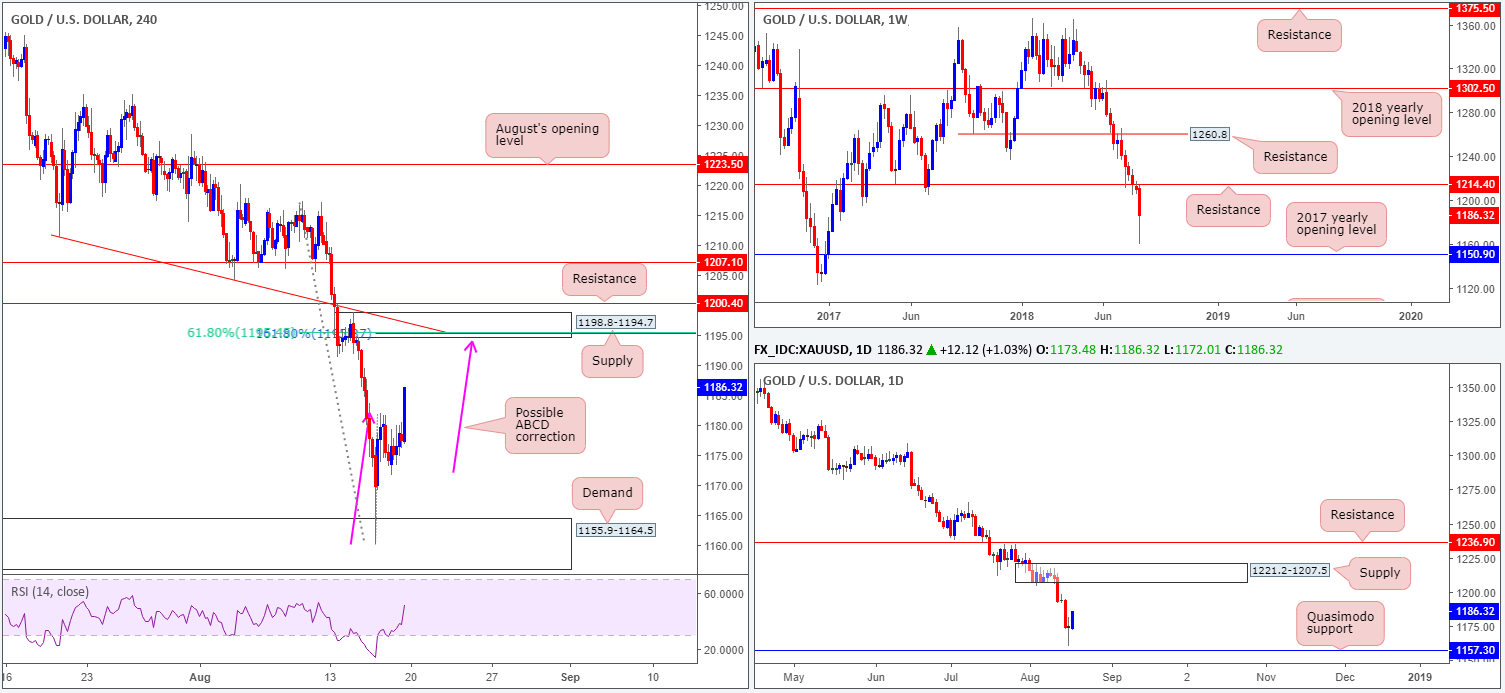
It’s been quite a week for the yellow metal, down nearly 2% at the close. After marginally closing beneath support at 1214.4 (now acting resistance) the week prior, bullion fell sharply last week, just missing the 2017 yearly opening level at 1150.9 before paring back a respectable portion of its weekly losses.
Daily perspective:
As of the week’s close, areas to keep on the radar this week fall in at a Quasimodo support located around 1157.3. Note this level is actually situated just north of the 2017 yearly open level mentioned above on the weekly timeframe at 1150.9. Another notable area can be seen at supply drawn from 1221.2-1207.5. As you can see, the momentum from its base is attractive.
H4 perspective:
With the USD remaining on the back foot amid Friday’s movement, gold continued to search for higher levels. As can be seen on the H4 timeframe, price ended the day closing in the shape of a full-bodied bullish candle, poised to build on recent gains towards supply at 1198.8-1194.7. What’s also notable from a technical perspective is the potential ABCD correction (pink arrows) completing within the lower limits of the noted supply at 1195.3 (161.8% Fib ext. point). This – coupled with a trend line resistance (taken from the low 1211.2) and a 61.8% Fib resistance at 1195.5 – marks a highly confluent supply zone.
Areas of consideration:
The H4 supply area mentioned above at 1198.8-1194.7 boasts strong H4 confluence for a possible short this week. The only concern, though, is there’s limited higher-timeframe convergence: the higher-timeframe areas are seen above this zone. Does that mean we should ignore the H4 confluence? Definitely not! Traders are, however, urged to wait and assess H4 price action before pulling the trigger at the aforementioned H4 zone. A full or near-full-bodied bearish candle printed from this area would likely be enough to draw in sellers and pull the market lower. Stop-loss orders can then be positioned above the rejecting candle’s wick, with the first take-profit target set at the 38.2% Fib support (taken from the low 1160.0 and the completing point of the H4 ABCD).
The use of the site is agreement that the site is for informational and educational purposes only and does not constitute advice in any form in the furtherance of any trade or trading decisions.
The accuracy, completeness and timeliness of the information contained on this site cannot be guaranteed. IC Markets does not warranty, guarantee or make any representations, or assume any liability with regard to financial results based on the use of the information in the site.
News, views, opinions, recommendations and other information obtained from sources outside of www.icmarkets.com.au, used in this site are believed to be reliable, but we cannot guarantee their accuracy or completeness. All such information is subject to change at any time without notice. IC Markets assumes no responsibility for the content of any linked site. The fact that such links may exist does not indicate approval or endorsement of any material contained on any linked site.
IC Markets is not liable for any harm caused by the transmission, through accessing the services or information on this site, of a computer virus, or other computer code or programming device that might be used to access, delete, damage, disable, disrupt or otherwise impede in any manner, the operation of the site or of any user’s software, hardware, data or property.


