
Waiting for lower timeframe confirmation is our main tool to confirm strength within higher timeframe zones, and has really been the key to our trading success. It takes a little time to understand the subtle nuances, however, as each trade is never the same, but once you master the rhythm so to speak, you will be saved from countless unnecessary losing trades. The following is a list of what we look for:
- A break/retest of supply or demand dependent on which way you’re trading.
- A trendline break/retest.
- Buying/selling tails/wicks – essentially we look for a cluster of very obvious spikes off of lower timeframe support and resistance levels within the higher timeframe zone.
- Candlestick patterns. We tend to stick with pin bars and engulfing bars as these have proven to be the most effective.
We typically search for lower-timeframe confirmation between the M15 and H1 timeframes, since most of our higher-timeframe areas begin with the H4. Stops are usually placed 3-5 pips beyond confirming structures.
EUR/USD:
Weekly gain/loss: + 173 pips
Weekly closing price: 1.0897
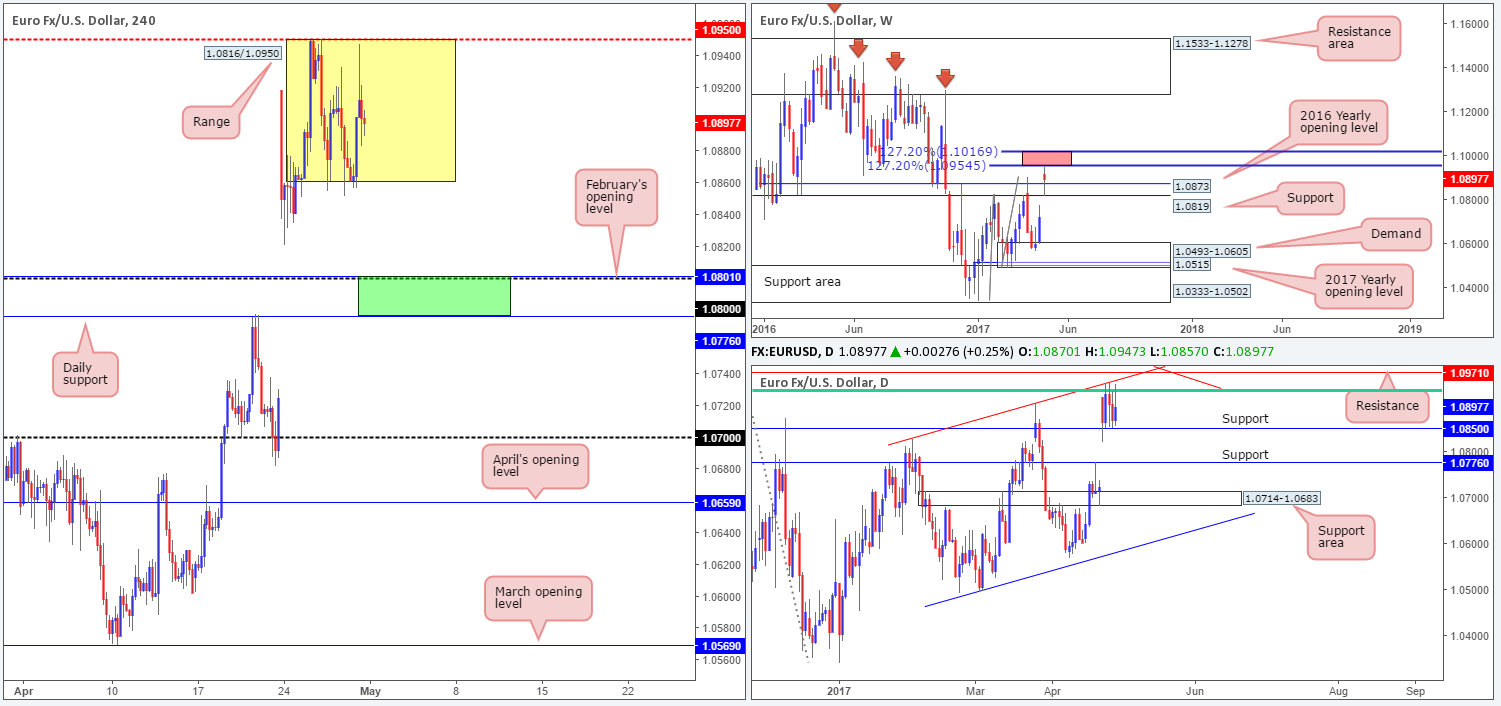
Following a win by centrist Emmanuel Macron at the French presidential elections last week, the pair gapped 200 pips north, which, as you can see, has yet to be filled. Consequent to this, both weekly resistance at 1.0819 and the 2016 yearly opening level at 1.0873 are now acting supports. Also of note are the two nearby 127.2% Fib extensions (red zone) at 1.1016/1.0954 taken from the lows 1.0340/1.0493 that could potentially halt further buying this week.
Turning our attention to the daily candles, the EUR finds itself consolidating between a 61.8% Fib resistance (green line) at 1.0932 (taken from the high 1.1299)/trendline resistance extended from the high 1.0828 and support penciled in at 1.0850. Directly above here, there’s resistance pegged at 1.0971 and another trendline resistance seen stretched from the high 1.1616. Beneath the current support, however, the next support level on tap can be seen at 1.0776.
A closer look at price action on the H4 chart shows that the unit has recently entered into the phase of a consolidation between 1.0861/1.0950. Momentum, nevertheless, has been firmly positioned to the upside since early April so a lot of traders will likely have their eye on buying the breakout of this range. Though, with daily resistance seen lurking just above at 1.0971 coupled with the weekly 127.2% Fib extension at 1.0954, this could very well end in tears!
Our suggestions: Based on the above notes, we see two possible scenarios:
- Watch for price to breakout above 1.0950, and assess how H4 candle action behaves. In the event that a solid rejection candle is seen, preferably a full-bodied bearish candle, then not only is a move back into the H4 consolidation possible, but a trade short on the back of this is too.
- Assuming that the bears do take over this week, longs could be an option from 1.0776/1.0801. Why here? This green area is comprised of a daily support at 1.0776, a round number at 1.08 and February’s opening level at 1.0801. Ultimately, before considering a trade from this region we’d like to see some form of bullish rotation emerge from here (a reasonably sized full-bodied bullish candle would be ideal).
Data points to consider: Treasury Sec Mnuchin speaks at 12.45pm. US Core PCE index release at 1.30 and US ISM manufacturing PMI figures at 3pm GMT+1.
Levels to watch/live orders:
- Buys: 1.0776/1.08 ([waiting for a reasonably sized H4 bull candle to form before pulling the trigger is advised] stop loss: ideally beyond the candle’s tail).
- Sells: Trading any fakeout seen beyond 1.0950 is a possibility should a full-bodied rejection candle be seen. Stops would ideally be placed beyond daily resistance at 1.0971.
GBP/USD:
Weekly gain/loss: + 139 pips
Weekly closing price: 1.2945
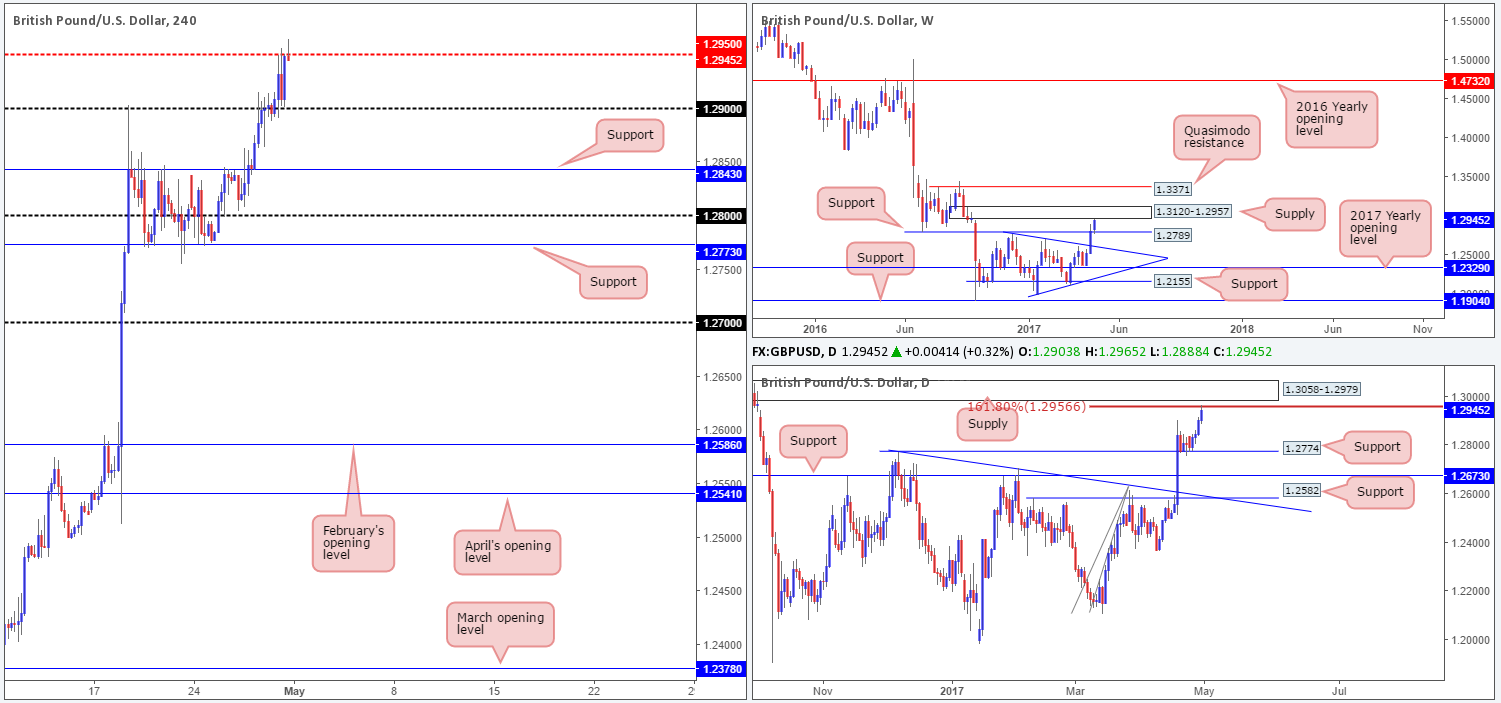
Recent action shows that the GBP/USD broke above weekly resistance at 1.2789 last week amid a generally well-bid market. Although this move marks the third consecutive weekly gain for the GBP, sitting just ahead is a weekly supply seen at 1.3120-1.2957. Therefore, we may see the bears make an appearance this week!
Along similar lines, daily flow shows supply on the horizon at 1.3058-1.2979. As this area is positioned within the walls of the said weekly supply, we feel that a bounce, at the very least, may be seen from here. Also worthy of note is the 161.8% Fib extension at 1.2956 taken from the low 1.2108, which is currently in motion.
Sliding across to the H4 candles, we can see that the pair settled around the mid-level resistance at 1.2950 and chalked in a nice-looking selling wick going into Friday’s close. This – coupled with weekly price recently touching gloves with supply, and daily movement checking in with a 161.8% Fib extension, this could encourage sellers into the market today/this week. Ultimately, the next support target on the cards is 1.29: a psychological level that was not only used to springboard price north on Friday, but it also played the part of a considerable resistance back on the 18th April. However, before sellers get excited, there’s one cautionary point to consider: the large 1.30 handle sitting just above which could be tested before serious bears step into the market.
Our suggestions: Personally, we believe that bears will make an appearance in the early hours of today’s sessions. With that being said, we would not enter immediately at the open as we’d want to assess the opening gap, if any. Furthermore, given the risk of price rallying to shake hands with 1.30, our team would only consider trading short with 50% of our usual position.
Data points to consider: Treasury Sec Mnuchin speaks at 12.45pm. US Core PCE index release at 1.30 and US ISM manufacturing PMI figures at 3pm GMT+1.
Levels to watch/live orders:
- Buys: Flat (stop loss: N/A).
- Sells: 1.2950 region ([dependent on the open, we would consider shorts on the basis of the H4 selling wick seen here] stop loss: ideally beyond the wick at 1.2967)
AUD/USD:
Weekly gain/loss: – 58 pips
Weekly closing price: 0.7485
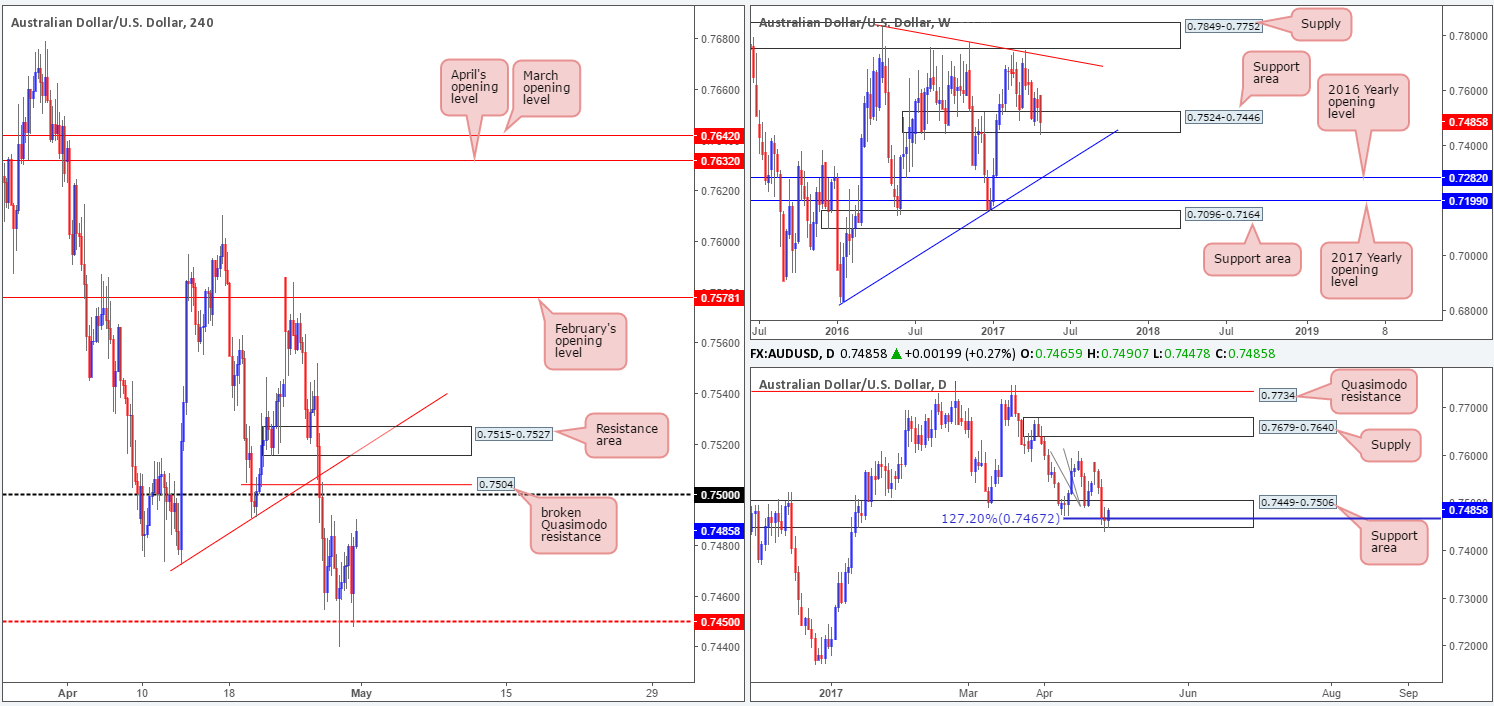
As can be seen from the weekly chart, the bulls have been struggling to get ahead since connecting with the support area at 0.7524-0.7446. If this zone is consumed this week, the next objective in the firing range can be seen at 0.7282: the 2016 yearly opening level that merges closely with a trendline support etched from the low 0.6827.
Moving down a leg to the daily timeframe, we can see that the only bullish day last week was on Friday! The pair is currently seen trading from an AB=CD 127.2% Fib extension at 0.7467 taken from the high 0.7610, which is planted within the walls of a support area at 0.7449-0.7506 (housed within the above said weekly support area). To that end, the bulls may still have a hand in this fight!
The H4 mid-level support at 0.7450 has provided a floor in this market since Thursday. This, alongside both the weekly and daily structures in play at the moment, could eventually lift price up to the broken Quasimodo line at 0.7504, shadowed closely by the 0.75 handle.
So, where does this leave us poor souls? Well, taking a long position at current price would not be something we’d recommend. Yes, there are higher-timeframe support structures in play, but buying into 0.75 would not be the best move, in our opinion. By the same token of course, selling from the 0.75 neighborhood is also tricky, owing to the higher-timeframe supports!
Our suggestions: With everything taken into consideration, our team feels that the best course of action is to lay low for now. Remaining flat when price action is not offering clear signals is, and has always been, the safest route to take!
Data points to consider: Treasury Sec Mnuchin speaks at 12.45pm. US Core PCE index release at 1.30 and US ISM manufacturing PMI figures at 3pm GMT+1.
Levels to watch/live orders:
- Buys: Flat (stop loss: N/A).
- Sells: Flat (stop loss: N/A).
USD/JPY:
Weekly gain/loss: + 256 pips
Weekly closing price: 111.51
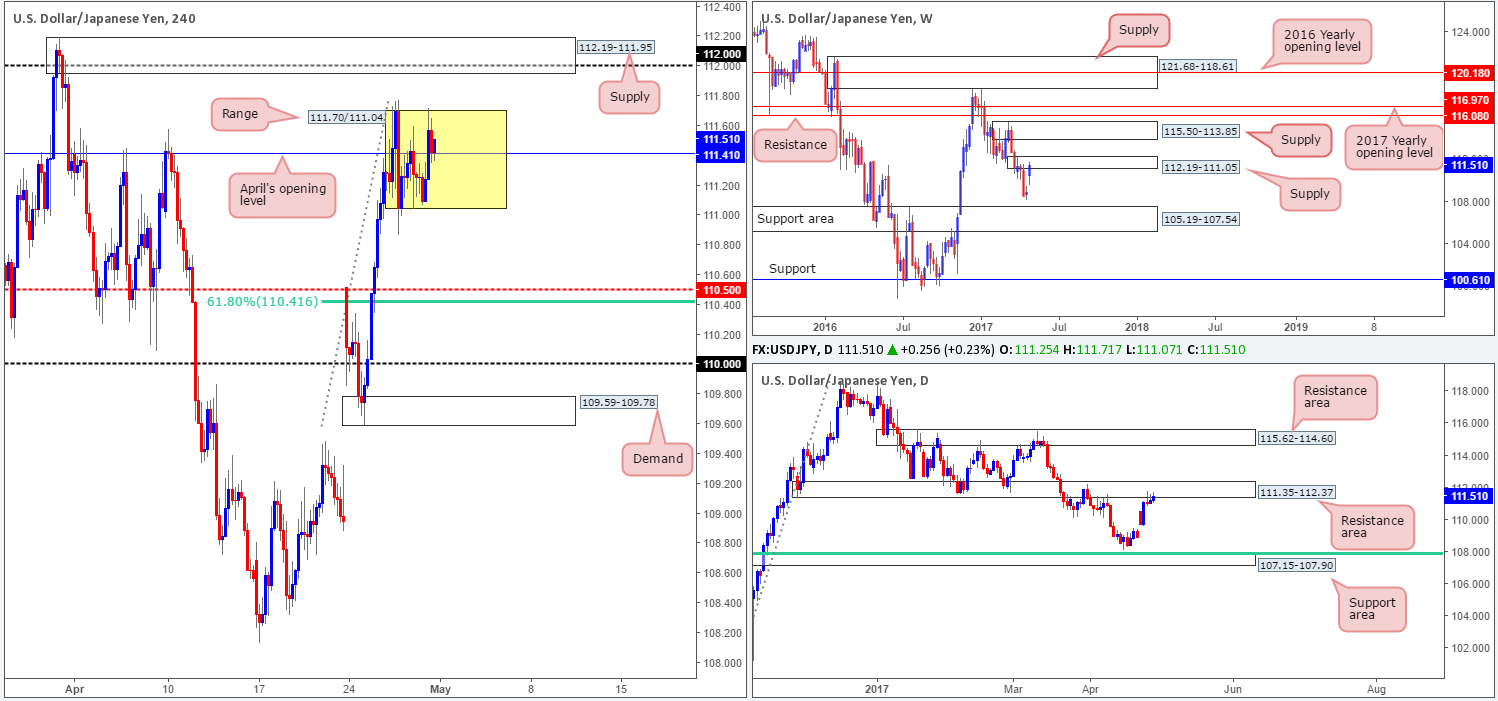
Having seen the USD/JPY gap over 150 pips north after a win by centrist Emmanuel Macron at the French presidential elections last week, we saw the unit enter into the jaws of a weekly supply coming in at 112.19-111.05. The gap, as can be seen from the weekly chart, has yet to be filled and the buyers and sellers remain battling for position within the confines of the said supply.
Since Wednesday, daily price has been seen teasing the underside of a resistance area carved from 111.35-112.37. Judging by the candle action here the bulls still have the upper hand, but given the surrounding weekly supply this could very well change sometime this week! In the event that the bears do come into the market here, the next area of interest for us would be the support zone seen at 107.15-107.90, which is joined closely by a 61.8% Fib support at 107.84 taken from the low 101.19. A continuation move to the upside, nevertheless, could set the stage for price to challenge the resistance area at 115.62-114.60.
A brief look at recent dealings on the H4 chart shows that the market is currently engaged within the walls of a range fixed between 111.70/111.04. Also of interest here is April’s opening level at 111.41 seen housed within. A few pips above this consolidation is supply marked at 112.19-111.95, which surrounds the 112 handle and is located within the upper limits of both the current weekly supply and daily resistance area. Below the range is mid-level support at 110.50 that ties in nicely with a 61.8% Fib support at 110.41 taken from the low 109.59.
Our suggestions: In respect to current price action, here’s what we see:
- Taking a long on the break of said H4 range is not permitted owing to higher-timeframe structures and the aforementioned H4 supply.
- A break below the H4 range followed up with a strong retest is, in our opinion, worthy of consideration since there’s room for a move down to at least 110.50 from here, and possibly further.
- Entering into longs from 110.50 may be chancy what with price lodged within both weekly and daily resistances!
Data points to consider: Treasury Sec Mnuchin speaks at 12.45pm. US Core PCE index release at 1.30 and US ISM manufacturing PMI figures at 3pm GMT+1.
Levels to watch/live orders:
- Buys: Flat (stop loss: N/A).
- Sells: Watch for price to engulf 111.04 and then look to trade any retest seen thereafter ([waiting for a H4 full-bodied bear candle to form following the retest is advised] stop loss: ideally beyond the candle’s wick).
USD/CAD:
Weekly gain/loss: + 158 pips
Weekly closing price: 1.3652
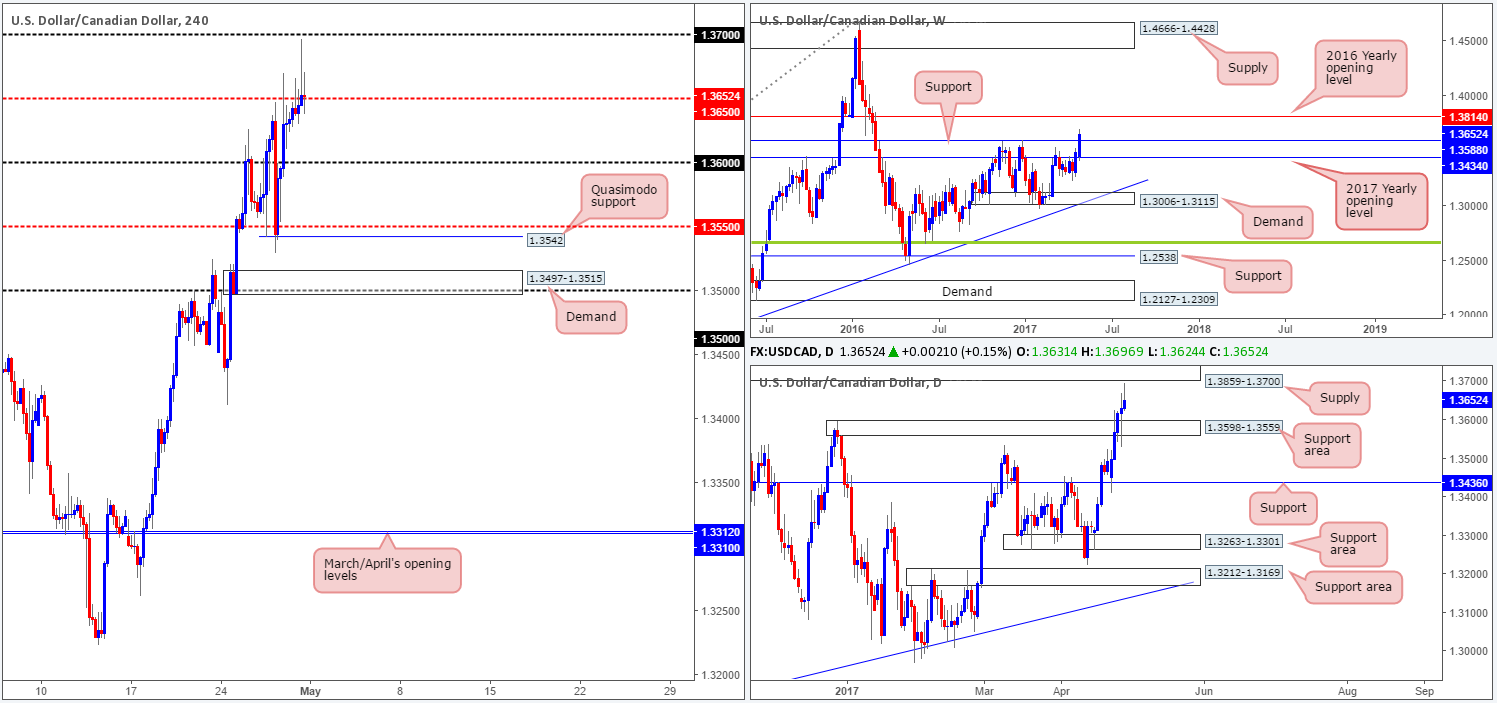
The US dollar made considerable ground against its Canadian counterpart last week, consequently smashing through weekly resistance at 1.3588 and reaching a high of 1.3696. Looking at the strength of the bulls at the moment, a continuation move up to the 2016 yearly opening level at 1.3814 is likely in order.
The story on the daily chart, however, is slightly different given that supply at 1.3859-1.3700 is seen within striking distance! What is notable from a technical perspective is that the 2016 yearly opening level resides within the upper limits of this said supply!
A quick recap of Friday’s movement on the H4 shows us that the bulls were unable to make much headway beyond the mid-level resistance at 1.3650, despite aggressively whipsawing up to within inches of the 1.37 handle amid the US segment. Is this enough to entice sellers into the market today? Well, given the room on the weekly chart seen for an advance, and daily price, albeit close, not yet able to test the current supply, we do not think so.
Our suggestions: The 1.37 handle remains of interest to our team this week seeing as how it aligns perfectly with the underside of the said daily supply. An intraday short from this level could be something to think about. The reason for not expecting much more of a move is simply through fear of weekly price dragging the market higher to the above said 2016 yearly opening level.
And this is why we believe the better level for shorts today/this week is the 2016 yearly opening base itself (1.38 region) as it is firmly positioned within the said daily supply, thus allowing the trader to conservatively place stops above this area.
Data points to consider: Treasury Sec Mnuchin speaks at 12.45pm. US Core PCE index release at 1.30 and US ISM manufacturing PMI figures at 3pm GMT+1.
Levels to watch/live orders:
- Buys: Flat (stop loss: N/A).
- Sells: 1.37 region ([possible intraday shorts – would not advise placing pending orders – wait for additional lower-timeframe confirming price action – see the top of this report] stop loss: dependent on where one confirms this area). 1.3814/1.38 region is an ideal place for shorts since this area requires no additional confirmation (stop loss: conservative at 1.3861).
USD/CHF:
Weekly gain/loss: – 11 pips
Weekly closing price: 0.9946
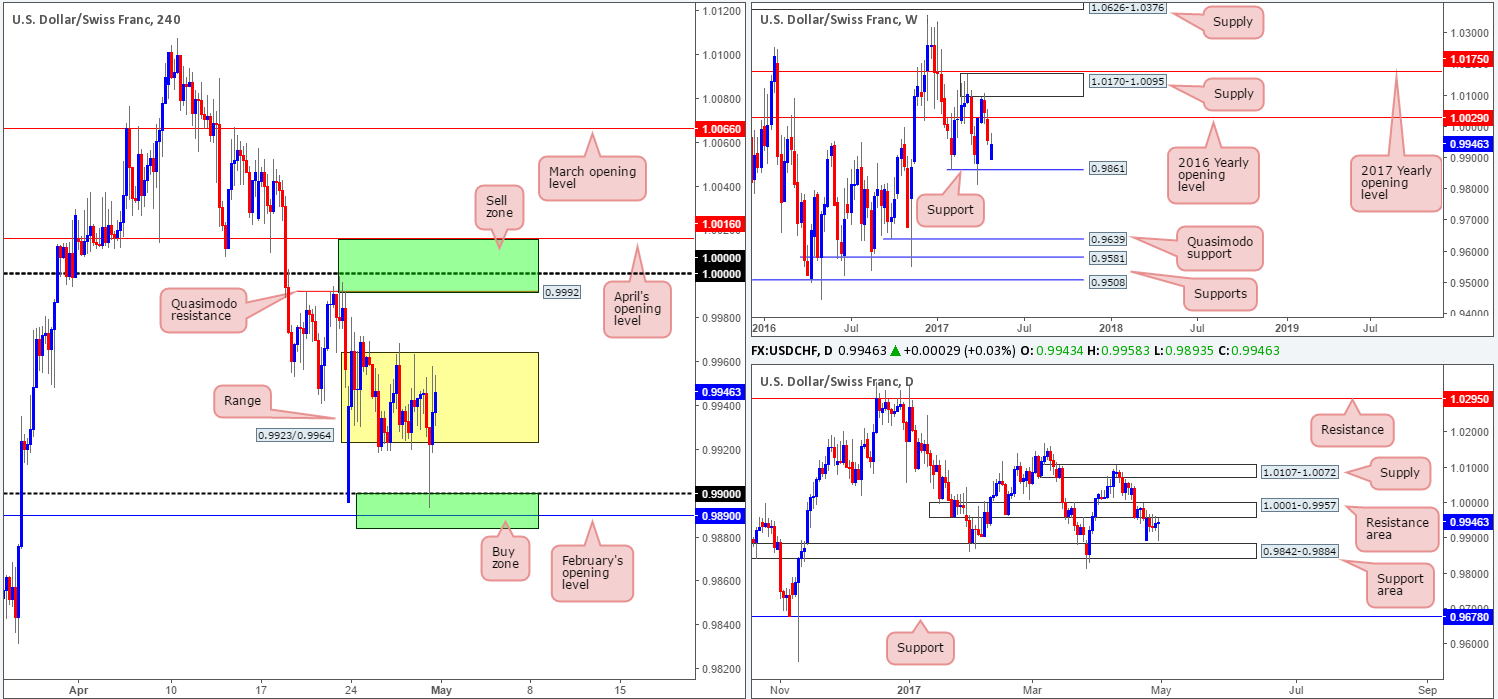
In spite of last week’s 60-pip opening gap, the pair ended the week not only filling the gap, but also recording little change by the close. On the weekly chart, we still have the support level at 0.9861 in our sights. Price came within 30 or so pips of this barrier last week before rotating to the upside. The additional level of interest on this scale is the 2016 yearly opening line forged at 1.0029 that’s located just below a supply zone pegged at 1.0170-1.0095.
Dropping down to the daily chart, we can see that price spent the entire week clinging to the underside of a resistance area at 1.0001-0.9957, and left the nearby support area at 0.9842-0.9884 unchallenged (holds weekly support within). Any sustained move below this support zone would likely place support at 0.9678 in the spotlight. A push above the current resistance area on the other hand could lead to the Swissy attacking the supply zone plotted at 1.0107-1.0072.
Over to the H4 chart, Friday’s movement aggressively whipsawed through the lower edge of the range fixed between 0.9923/0.9964, and tapped a (noted) buy zone at 0.9884/0.99. Well done to any of our readers who managed to catch this move! We passed since the bullish rotation candle was unfortunately too big!
Our suggestions: With little change seen to structure on Friday, the team believes that there’s still equal opportunity to trade this pair both long and short today. For shorts, we have the 1.0016/0.9992 region, and for longs the 0.9884/0.99 remains of interest despite it being tested on Friday (green zones on the H4 chart). Both zones, as you can probably see, also boast daily structure.
The only grumble we would have if we were to take a long from the said H4 area is the fact that weekly price could potentially push the market lower to shake hands with support at 0.9861. On a similar note, a short from 1.0016/0.9992 is somewhere that could be faked as price may want to connect with the 2016 yearly opening level mentioned above at 1.0029. As such, we are advising traders not to trade the above said zones blindly! Wait for additional confirmation either in the form of a H4 candle (preferably a full-bodied candle) or a lower-timeframe signal (see the top of this report).
Data points to consider: Treasury Sec Mnuchin speaks at 12.45pm. US Core PCE index release at 1.30 and US ISM manufacturing PMI figures at 3pm GMT+1.
Levels to watch/live orders:
- Buys: 0.9884/0.99 ([waiting for a reasonably sized H4 bull candle to form before pulling the trigger is advised] stop loss: ideally beyond the candle’s tail).
- Sells: 1.0016/0.9922 ([waiting for a reasonably sized H4 bear candle to form before pulling the trigger is advised] stop loss: ideally beyond the candle’s wick).
DOW 30:
Weekly gain/loss: + 387 points
Weekly closing price: 20950
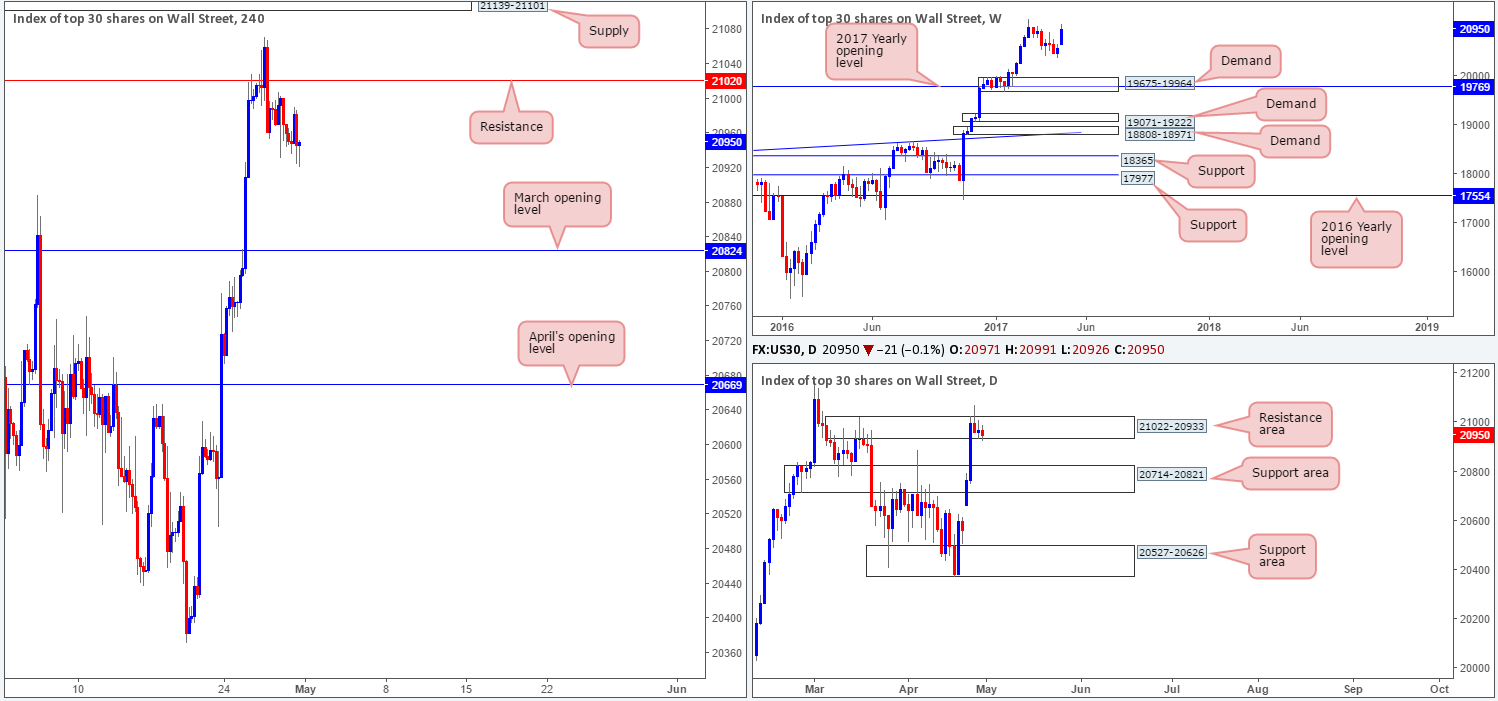
Things ended positively for US equities last week as the index surged around 400 points into the close! From a weekly perspective, we’re looking for this strength to continue which should eventually lift price to fresh record highs. Be that as it may, down on the daily chart we can see the unit is finding resistance around the 21022-20933 neighborhood. While this area has capped the market since Tuesday, there has been little downside movement generated thus far, even with Wednesday’s bearish selling wick! This suggests that the bulls remain supportive here for the time being.
Looking over to the H4 chart, the bulls failed to overcome resistance at 21020 on Wednesday, which sent price grinding lower into the week’s end. The next support target on tap from here is not seen in view until March’s opening level at 20824 that sits conveniently above the daily support area at 20714-20821 (the next downside target on that timeframe).
Our suggestions: Ultimately, our team’s bias is long. However, we’re finding it difficult to pin down a setup given the only support present is March’s opening level seen on the H4 chart. Therefore, unless new H4 structure forms at current price or we see a decline down to 20824, we will remain flat.
Data points to consider: Treasury Sec Mnuchin speaks at 12.45pm. US Core PCE index release at 1.30 and US ISM manufacturing PMI figures at 3pm GMT+1.
Levels to watch/live orders:
- Buys: 20824 looks an interesting level for longs. However, we would require a H4 bullish candle to present itself here (preferably a full-bodied candle) before committing.
- Sells: Flat (stop loss: N/A).
GOLD:
Weekly gain/loss: – $16.7
Weekly closing price: 1267.7
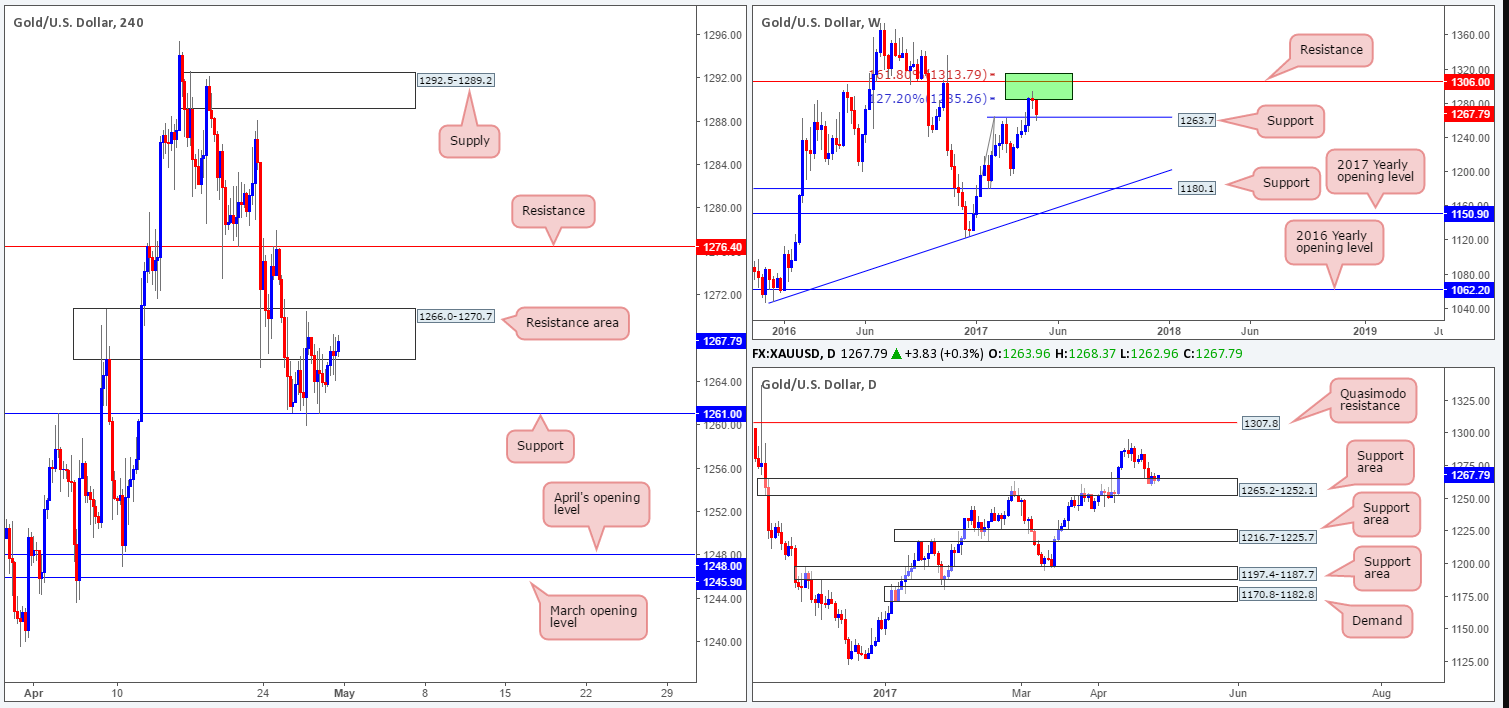
After a rather feeble reaction seen from within the walls of the two weekly Fibonacci extensions 161.8/127.2% at 1313.7/1285.2 taken from the low 1188.1 (green zone) two weeks back, weekly price eventually eased off from this zone last week. The move brought the yellow metal down to a support seen at 1263.7, which held firm going into the close.
In conjunction with weekly flow, there’s a daily support area at 1265.2-1252.1 that’s been in play since Tuesday and houses the said weekly support level. Bids are likely to continue defending this zone with it having been a strong barrier of resistance on a number of occasions this year.
Since Wednesday, the H4 candles have been consolidating between support at 1261.0 and a resistance area formed at 1266.0-1270.7. A break above this zone could lead to a move being seen up to resistance noted at 1276.4, whereas a break below the current support may see bullion reach for April’s opening line at 1248.0, followed closely by March’s opening line at 1245.9.
Although shorts look tempting beyond the current H4 support level down to April’s opening level, we would not feel comfortable selling here knowing what’s lurking beneath us on the higher timeframes! In regards to longs, however, yes, we would be trading in line with higher-timeframe flow, but seeing as this would entail us buying into a H4 resistance area, this is also not really our cup of tea.
Our suggestions: Neither a long nor short seems attractive at this time. It appears we’re trapped from both ends! With this being the case, remaining on the sidelines may very well be the better path to take today.
Levels to watch/live orders:
- Buys: Flat (stop loss: N/A).
- Sells: Flat (stop loss: N/A).


