
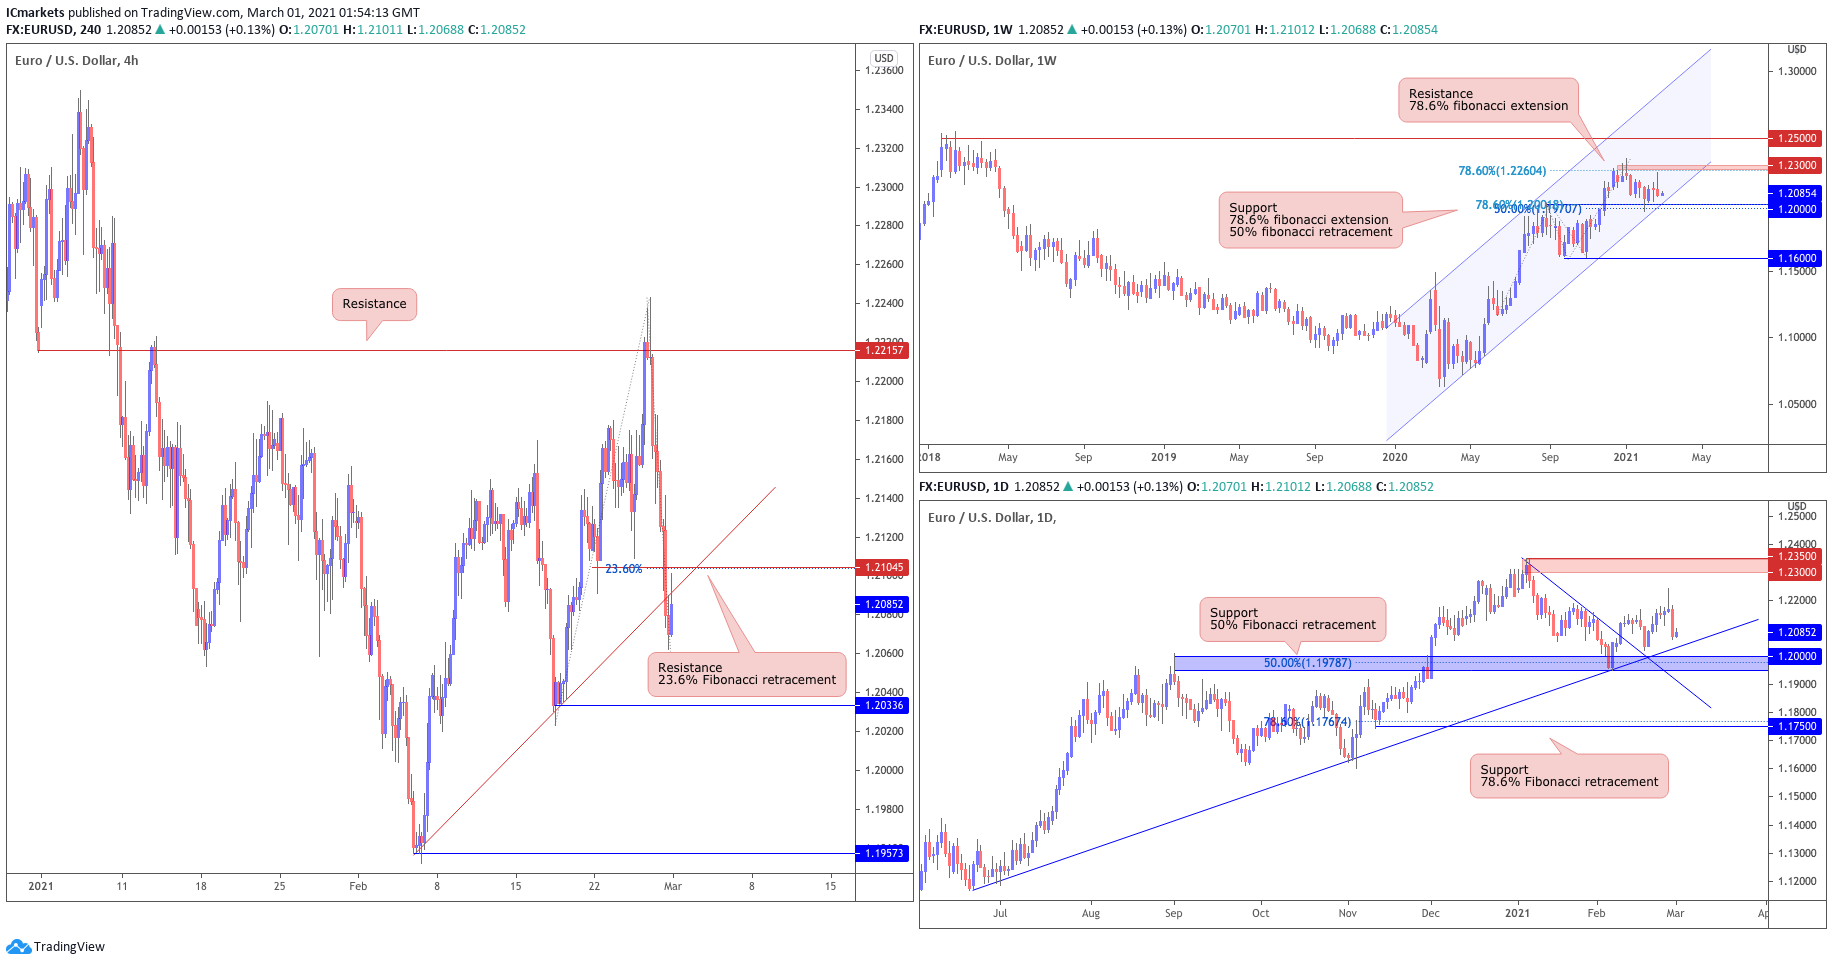
EUR/USD:
Looking at the weekly chart, we can see that prices are approaching the support area of our ascending channel at 1.200, which coincides with the 50% Fibonacci retracement and 78.6% Fibonacci extension. We could see a further upside to test our resistance area at 1.2300, in line with the graphical swing high resistance and 78.6% Fibonacci extension. On the daily time frame, prices are holding nicely above the ascending trend line and support area at 1.200 which can also be found on the weekly time frame.
On the H4 timeframe, prices are facing bearish pressure from our resistance at 1.21045, in line with our graphical pullback resistance area and 23.6% fibonacci retracement. We could see a further drop below this level to our support level at 1.20336, in line with our graphical swing low support.
Areas of consideration:
- 20336 support area found on H4 time frame
- 21045 resistance level found on H4 time frame
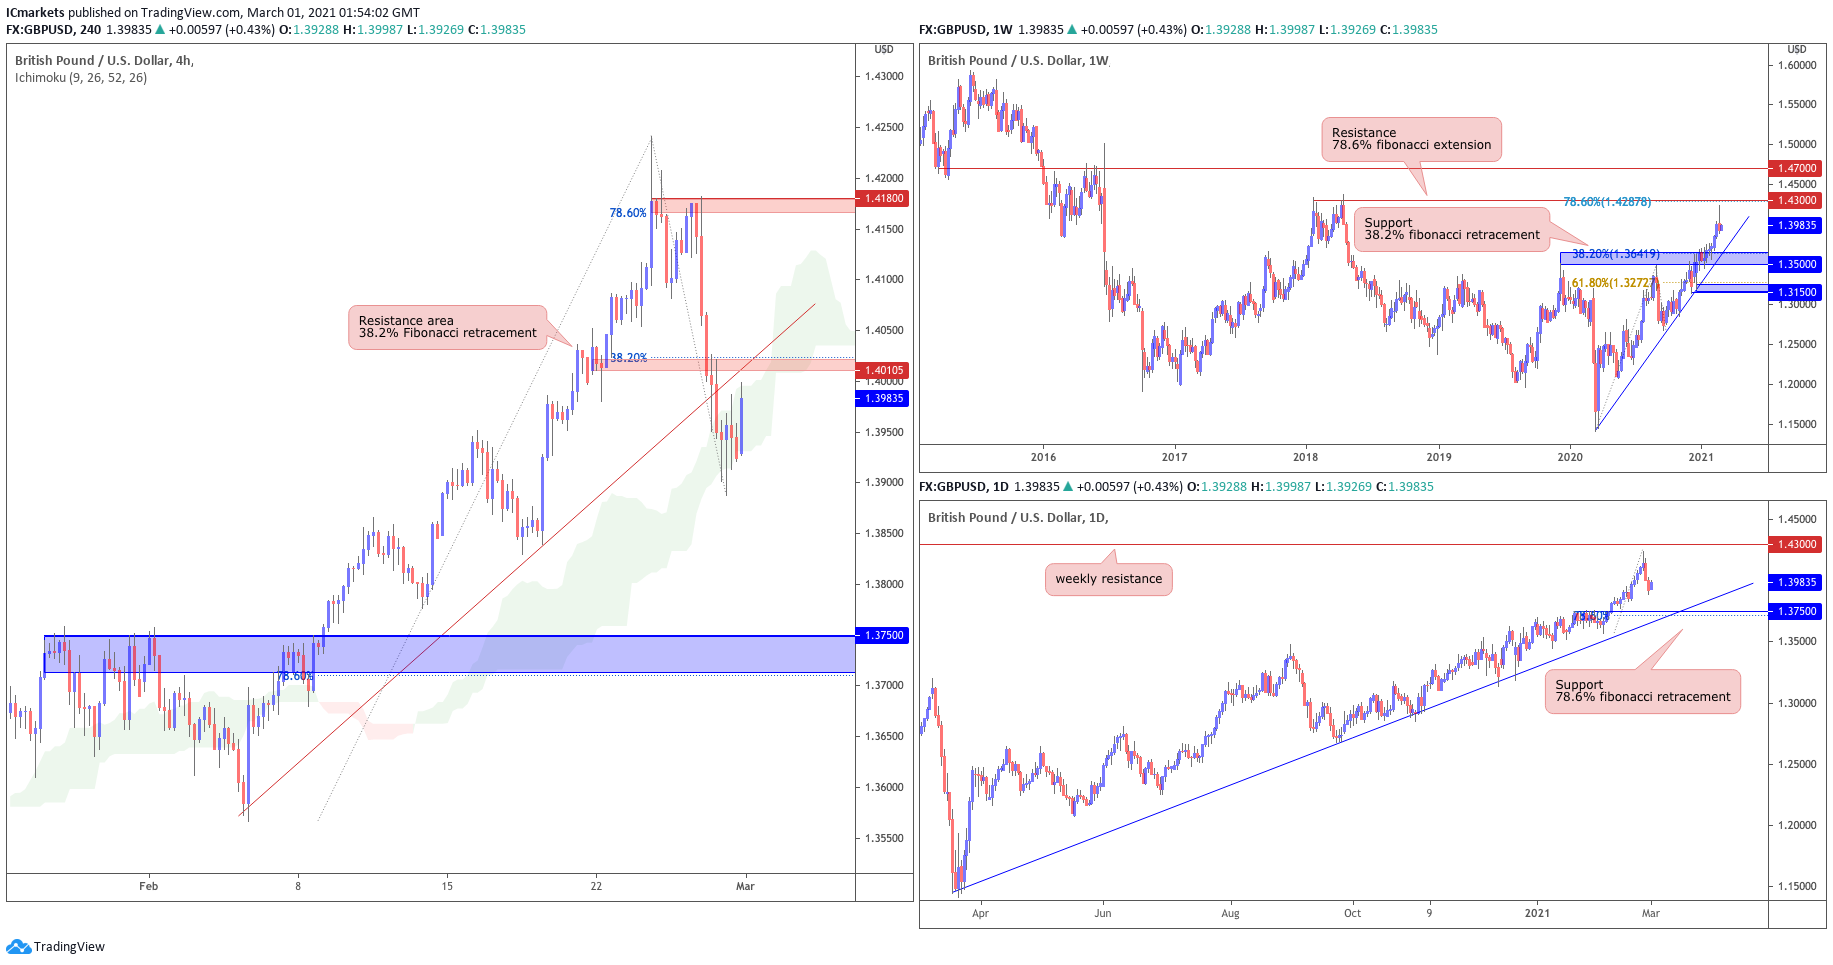
GBP/USD:
Looking at the weekly chart, we can see that prices are approaching our ascending trend line and weekly support area at 1.35000 where we could see a further downside before it reaches our support level, in line with the graphical pullback support area and 38.2% Fibonacci retracement. On the daily time frame, our support area at 1.37500 coincides with the 78.6% Fibonacci retracement and ascending trend line.
On the H4 timeframe, prices are facing bearish pressure from our resistance area at 1.40105, in line with our graphical pullback resistance area and 38.2% fibonacci retracement. We could see a reversal below this level to test our next support level at 1.37500, which can also be found on the daily time frame.
Areas of consideration:
- 40105 resistance area found on H4 time frame
- 37500 support area found on H4 timeframe
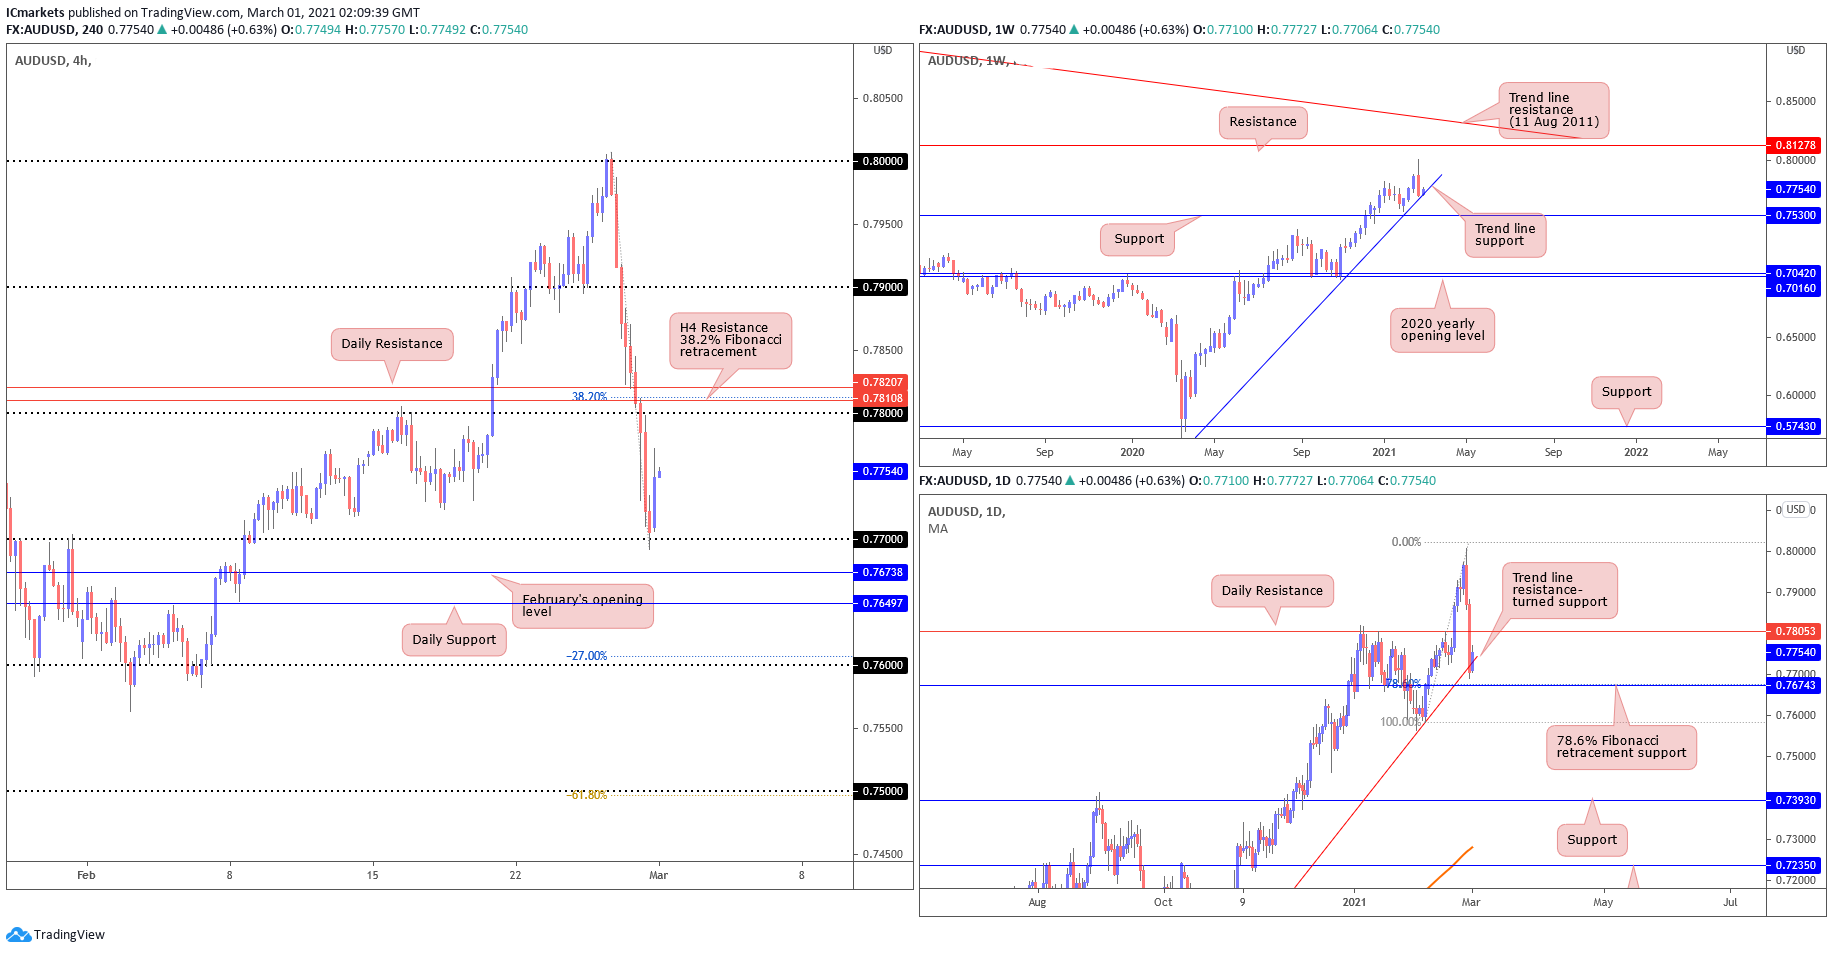
AUD/USD:
From the Weekly timeframe, we can see that the price has returned back to the ascending trendline support drawn from 9th March (2020), where we may witness a bounce up north to continue this bullish momentum, or potentially a break beneath this trendline that challenges the bullish trend. On the Daily timeframe, price has broken the ascending trendline and is currently hovering above the trendline resistance turned support. We may witness a further push downside towards the 0.7674 level where the 78.6% Fibonacci retracement is. On H4, price managed to tap on 0.77 major figure before pushing up north for an overdue pull-back. We may see price moving towards 0.78 major figure, within touching distance of Daily resistance and the 38.2% fibonacci retracement drawn on H4. If not, price may swing towards the next support level of major figure 0.76, in line with -27% Fibonacci retracement.
Areas of consideration:
- H4 may move upside towards 38.2% fibonacci retracement, 0.78 major figure and Daily resistance.
- Daily ascending trendline has been broken, may signify slow down in bullish momentum.
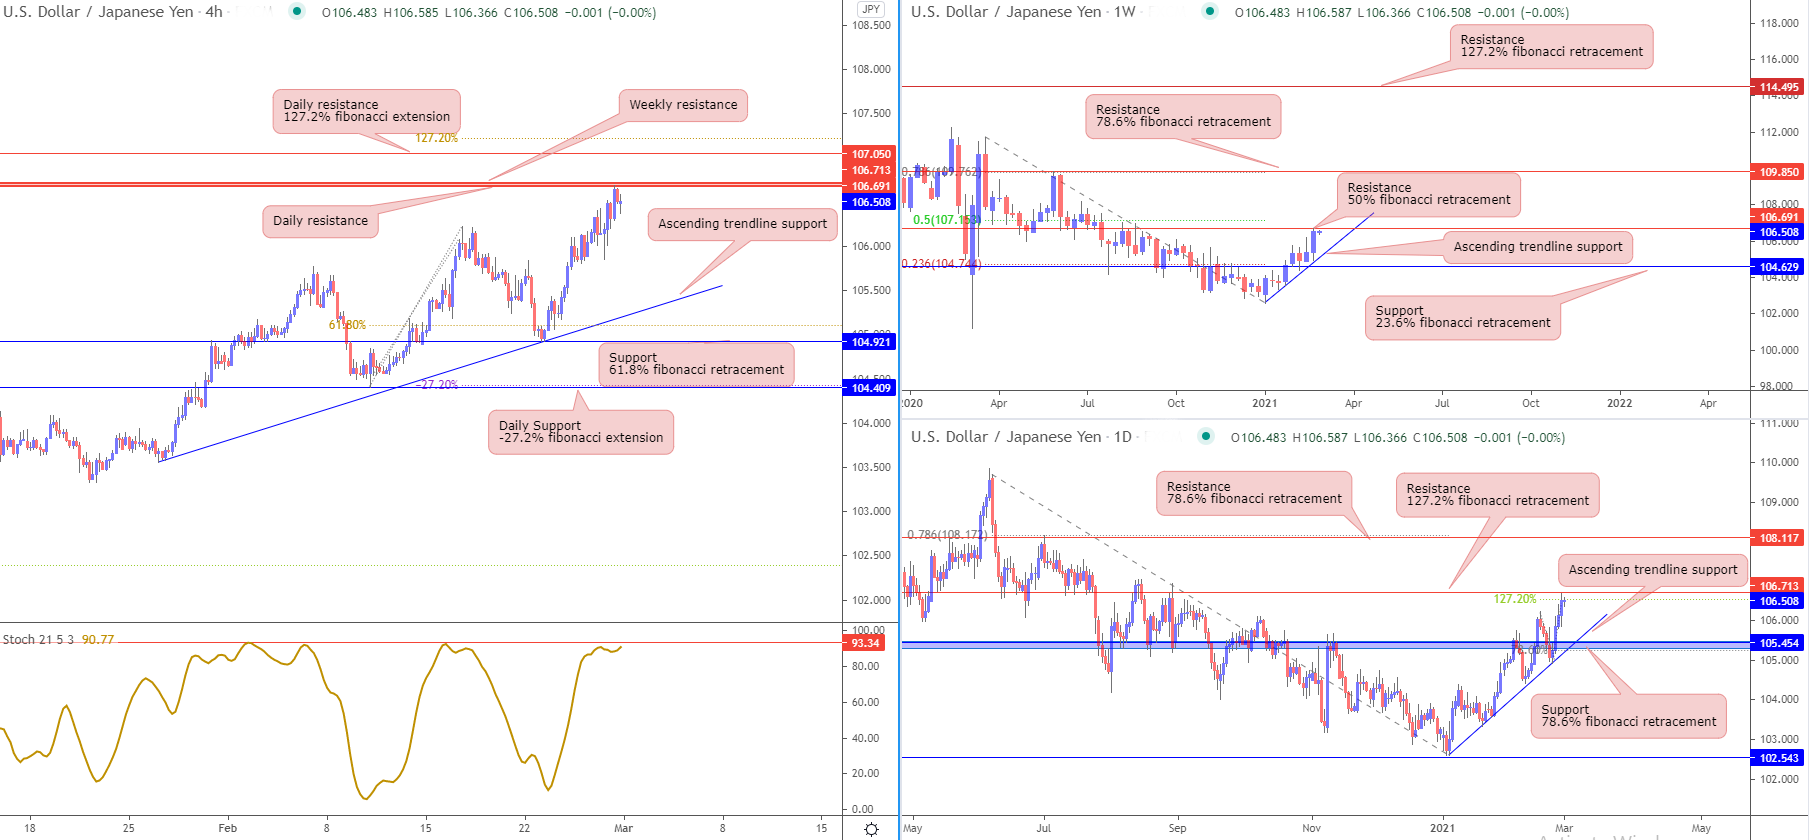
USD/JPY
From the weekly timeframe, we can see that the price is facing resistance from the horizontal swing high resistance which coincides with 50% fibonacci retracement. On the daily time frame, price is also facing resistance from the horizontal swing high resistance which coincides with 127.2% fibonacci retracement. On H4, prices are facing resistance from the weekly and daily horizontal swing high resistance line. Prices might make a pull back to the ascending trend line which is also the horizontal pullback support and 61.8% fibonacci retracement level. Furthermore, stochastics is showing that it is facing resistance from the 93.34 level.
Areas of consideration:
- 454 support level on the daily time frame is a possible upside target
- 454 support level on daily timeframe in line with the ascending trendline support and 78.6% fibonacci retracement
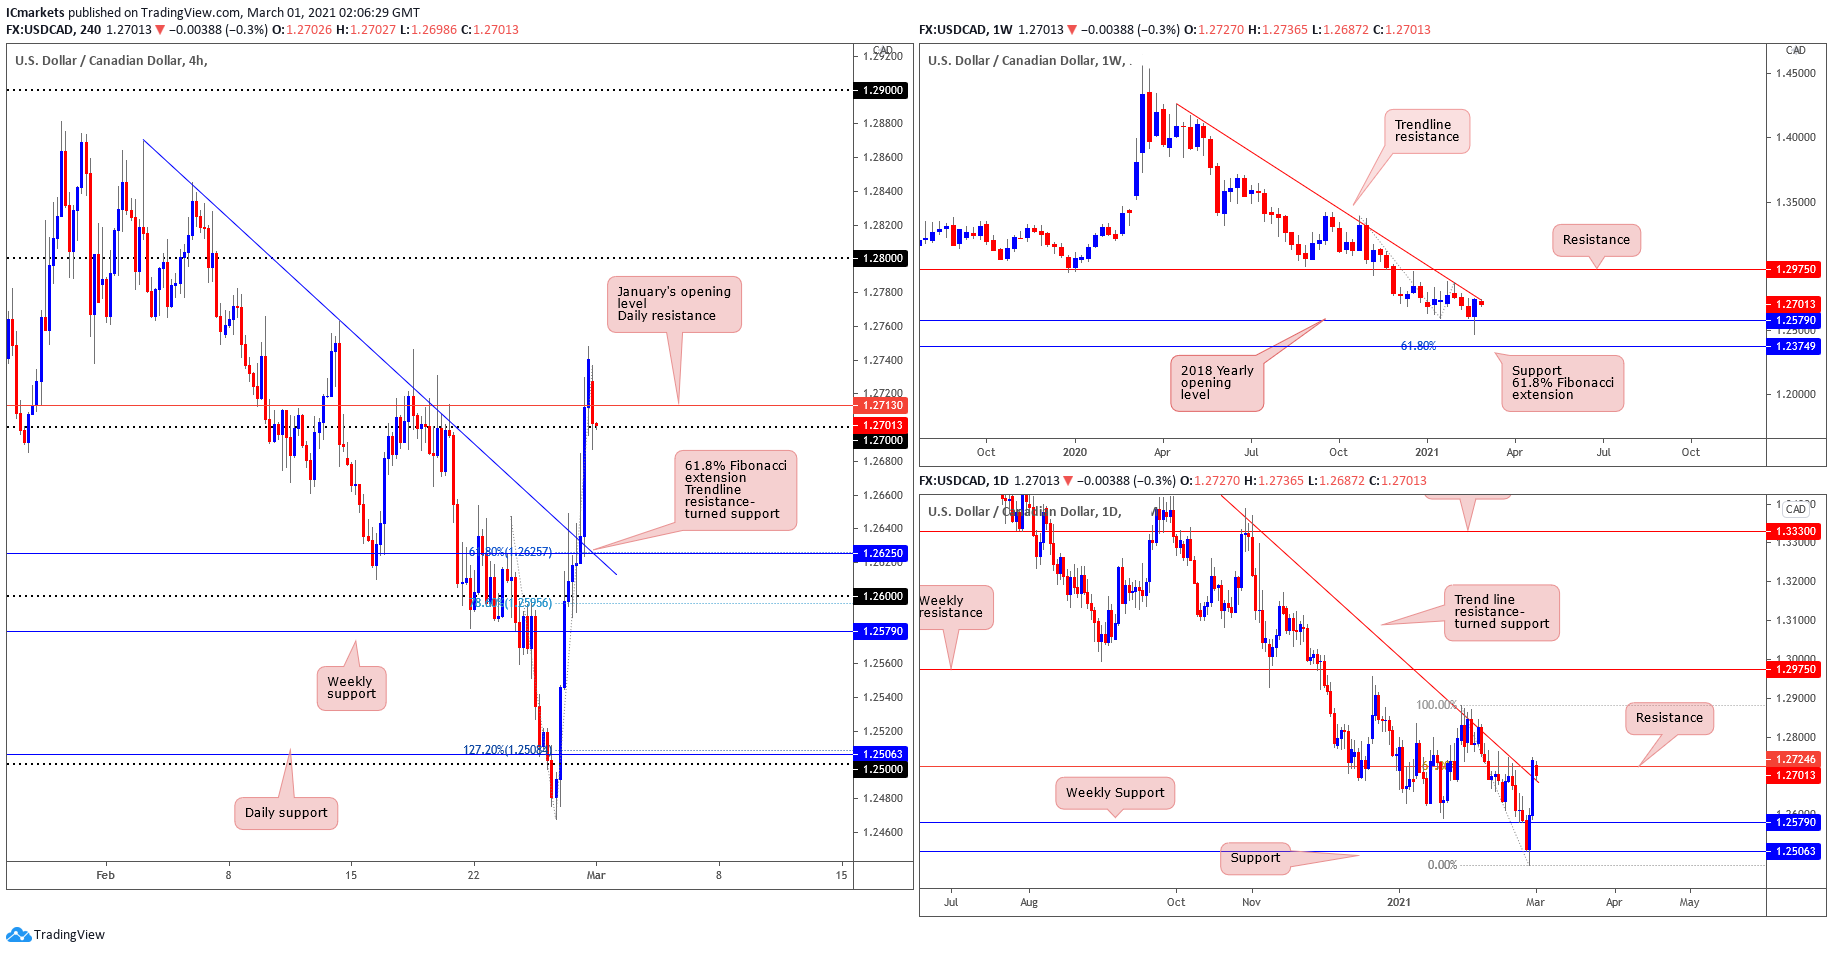
USD/CAD:
Looking at the weekly chart, price has moved towards the descending trendline, and is still showing bearish momentum. It is important to note that the long-term picture has pointed the direction down (trend) since March (2020). In the daily time frame, price has broken above the trendline resistance turned support, and has retested the level with the current candle formed. It is hovering beneath the January opening level of resistance, we may see a break above this level. And on the H4 timeframe, price is sitting above the 1.27 major level. We may expect a pullback into the 1.2625 level where the 61.8% fibonacci extension and H4 trendline resistance turned support level. If not, price may make its way towards the 1.28 major level.
Areas of consideration:
- H4 may return to 1.2625 level where 8% fibonacci extension and H4 trendline resistance turned support
- Daily timeframe shows mild weakness in downtrend.
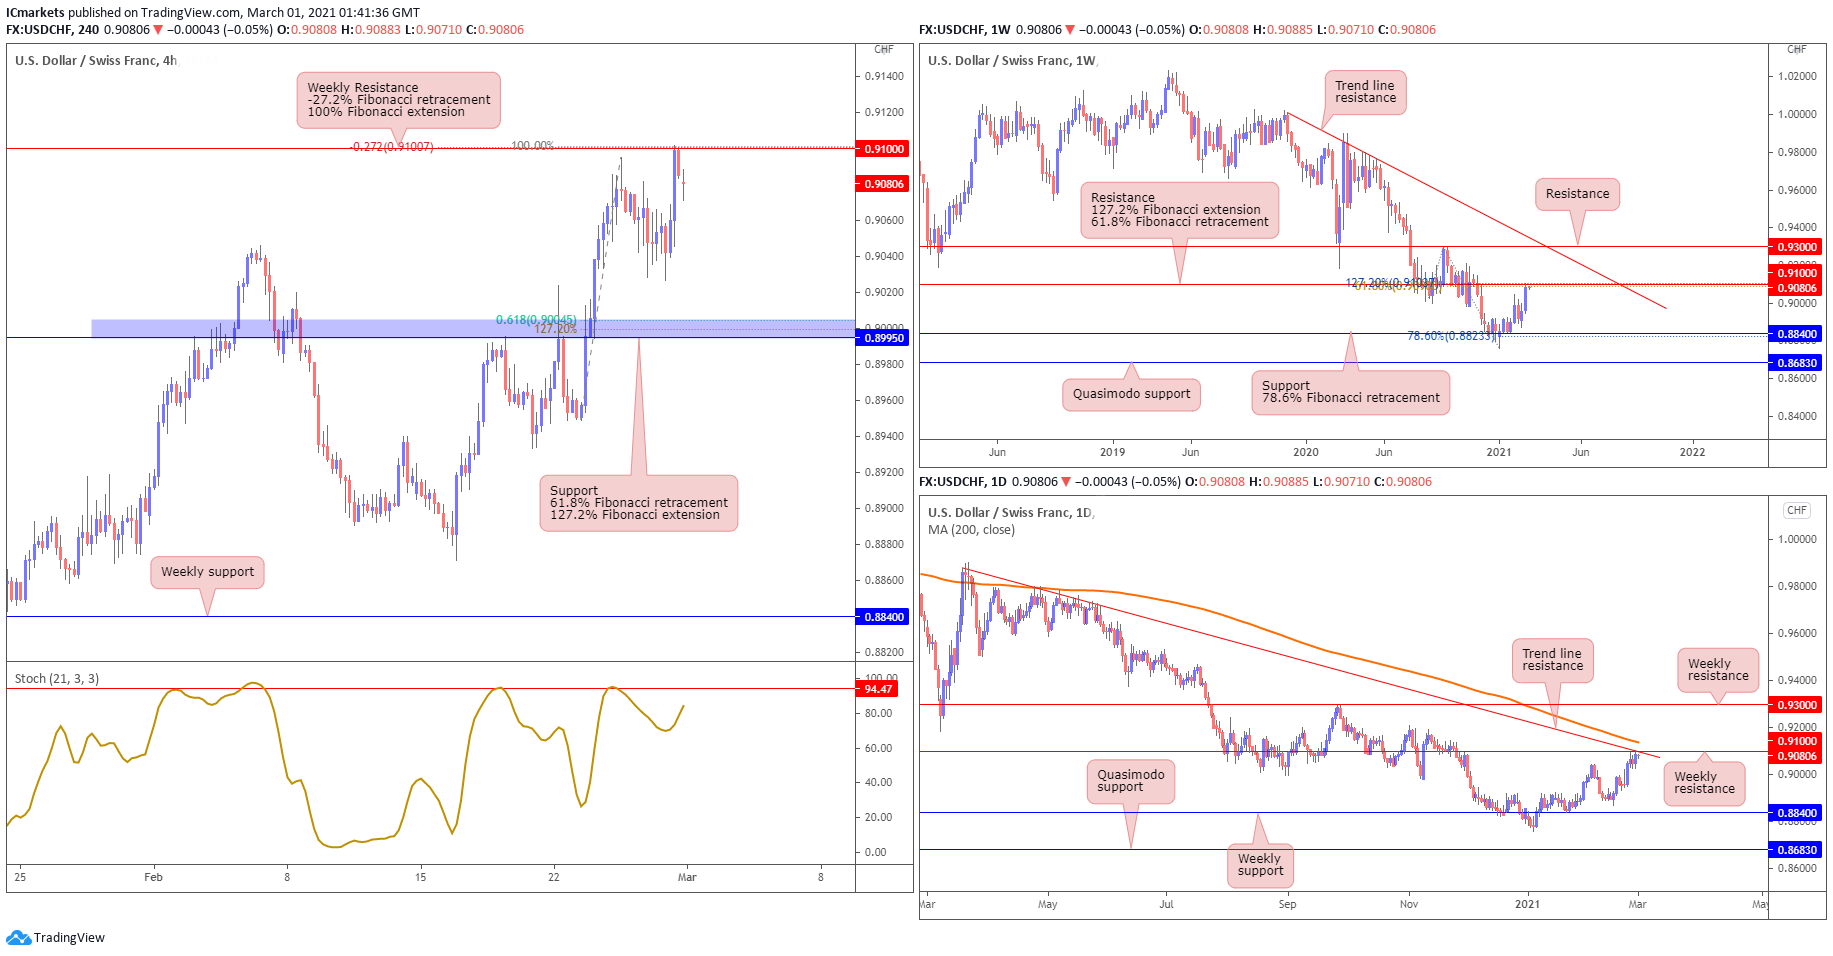
USD/CHF:
USD/CHF continues to show bearish pressure at the start of the month, as seen on both the weekly and daily timeframes. On the weekly timeframe, we can see that price has yet to break above the 0.91000 weekly resistance level, which is in line with our 61.8% Fibonacci retracement and 127.2% Fibonacci extension levels, and continues to hold below the weekly trendline as well. The daily timeframe also shows a similar picture, with price testing the descending trendline, moving average and weekly resistance levels. We could possibly see a reversal and further downside towards the 0.88400 weekly support level.
On the H4 chart, we see that price faced strong resistance and reversed from our 0.91000 weekly resistance level, which is in line with our -27.2% Fibonacci retracement and 100% Fibonacci extension levels. The Stochastic indicator is also approaching the upper resistance level at 94.477 where it has reacted from before as well. In this bearish scenario, we could potentially see price make a further push down south to test the 0.89950 support level which is in line with our 61.8% Fibonacci retracement and 127.2% Fibonacci extension levels. Otherwise, should price fail to hold below the 0.91000 level, we could see a further push up to test the next weekly resistance level at 0.93000.
Areas of consideration:
- Price managed to hold below the weekly 0.91000 resistance level.
- 89950 support level is a potential downside target for sellers in this bearish scenario.
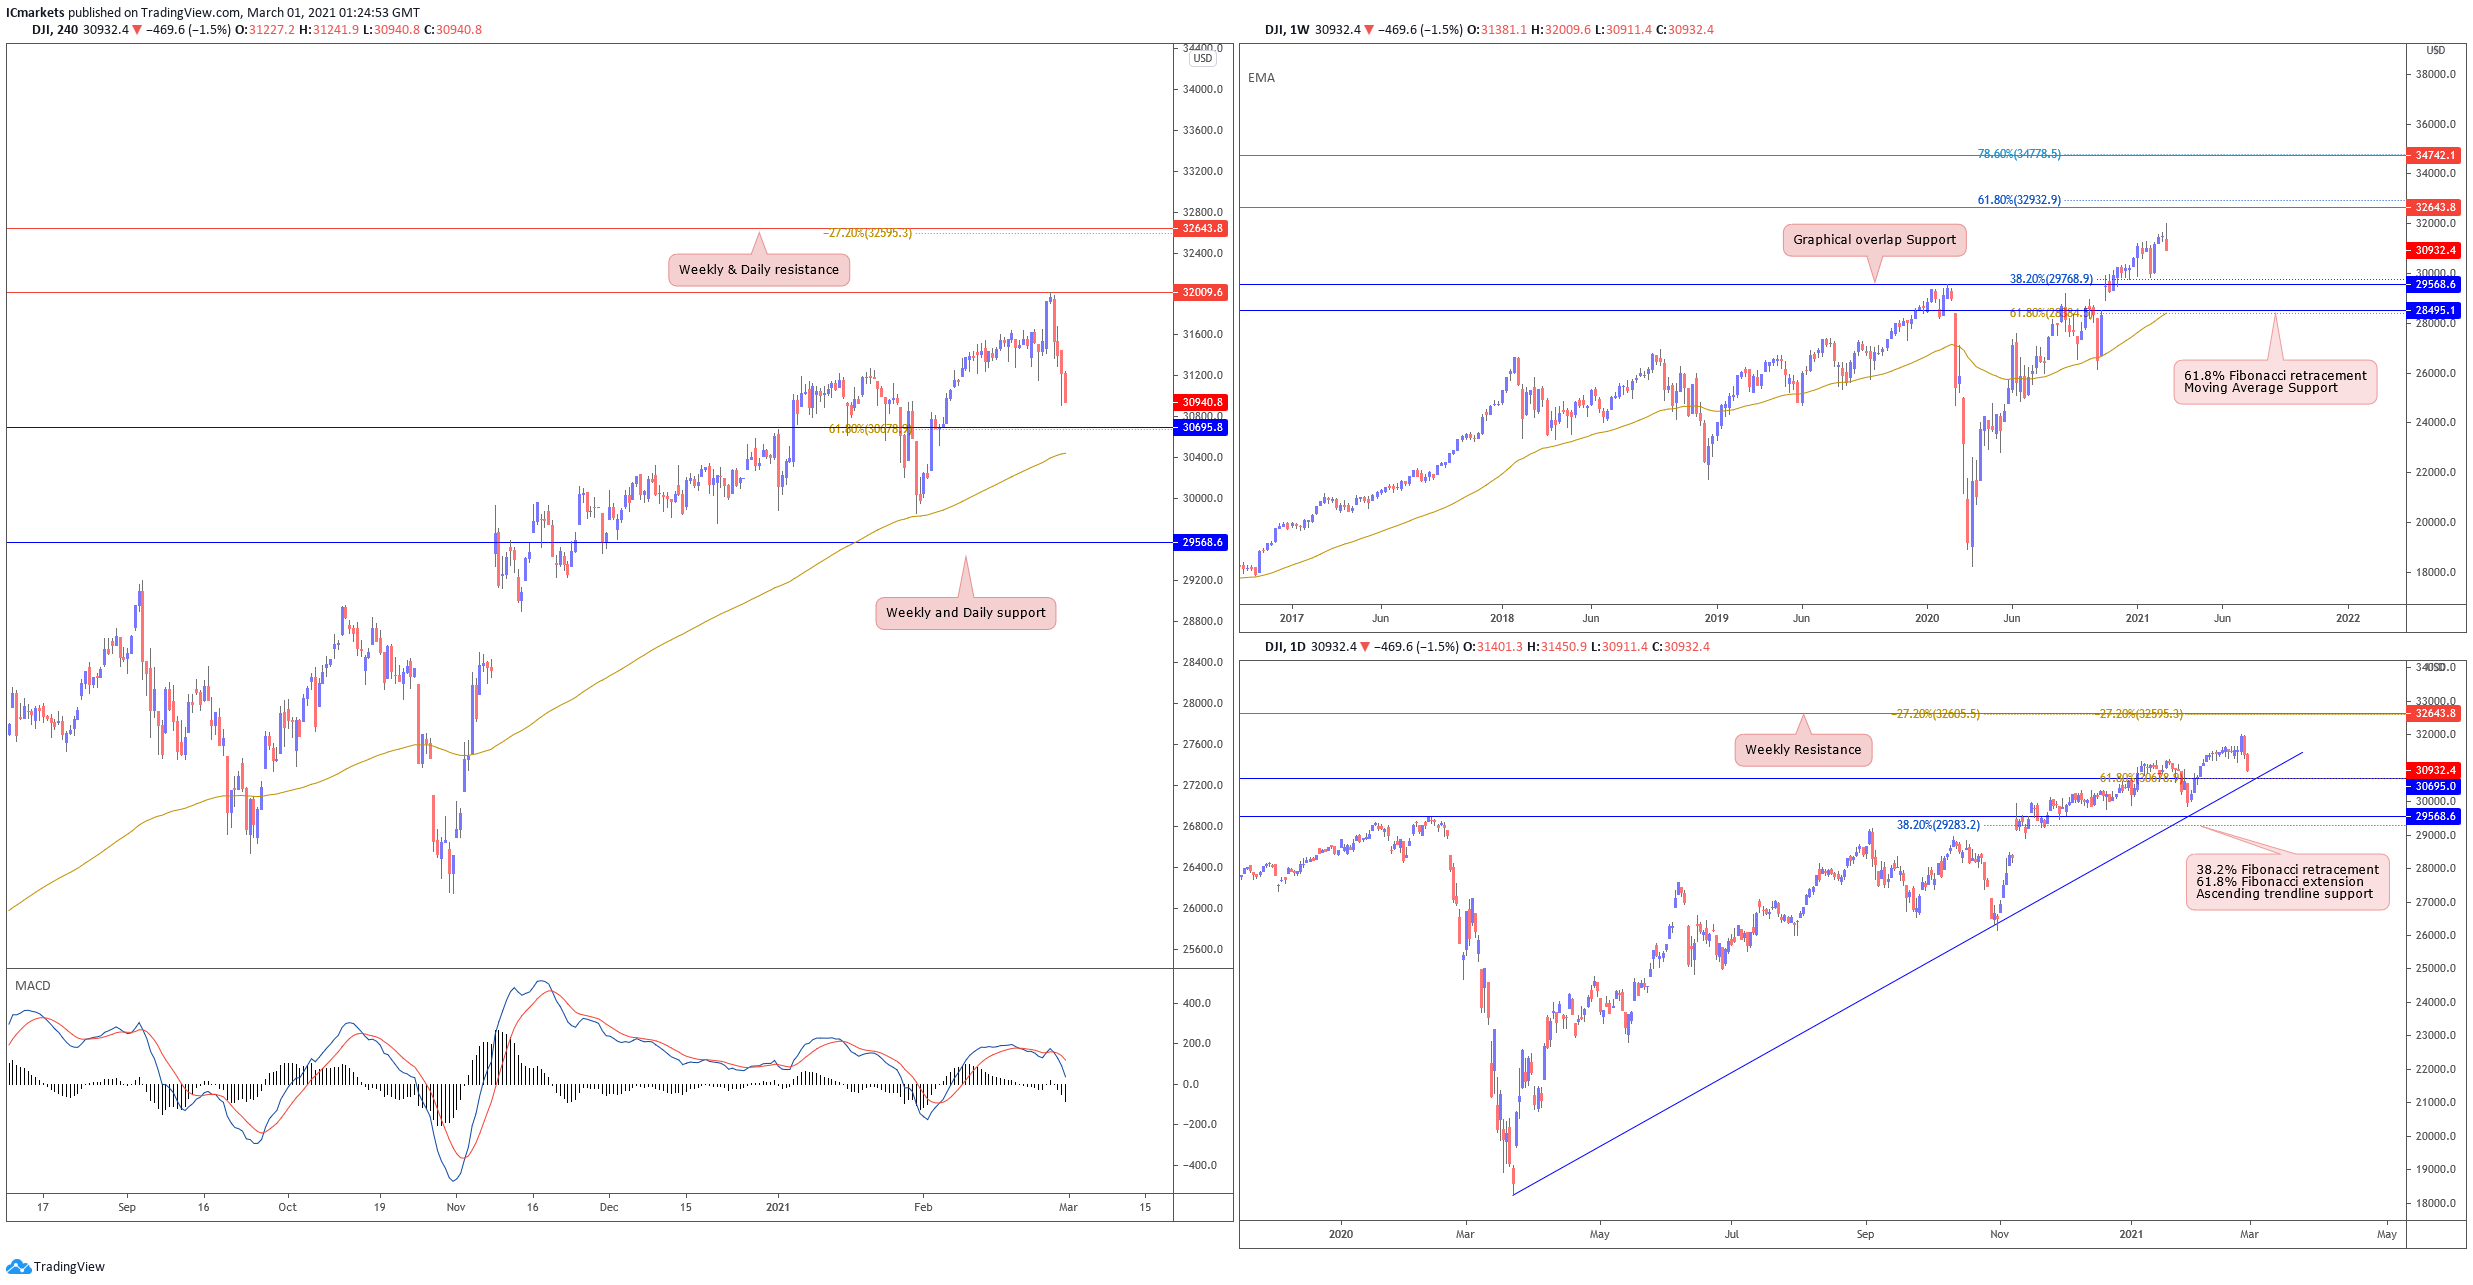
Dow Jones Industrial Average:
On the weekly chart, price failed to hold above 31272. A pull back towards 29568 support could be possible. However we note that price is still holding above the long term moving average. On the Daily, price continues to hold very strongly above ascending trendline support. With price coming back to test the ascending support at 30662, it is possible that traders could see a bounce above this support and should be careful when deciding to trade any short term pullbacks as the bullish momentum still remains strong.
On the H4, price pulled back after making a new high at 32009. With price still holding above moving average support and MACD indicator is above 0, we can expect a low probability bullish scenario where 30695 is the support level we see buyers entering with their longs to push price higher. Otherwise, failure to hold above 30695 could see price push lower towards weekly support at 29568.
Areas of consideration:
- Intraday support at 30695 level to watch
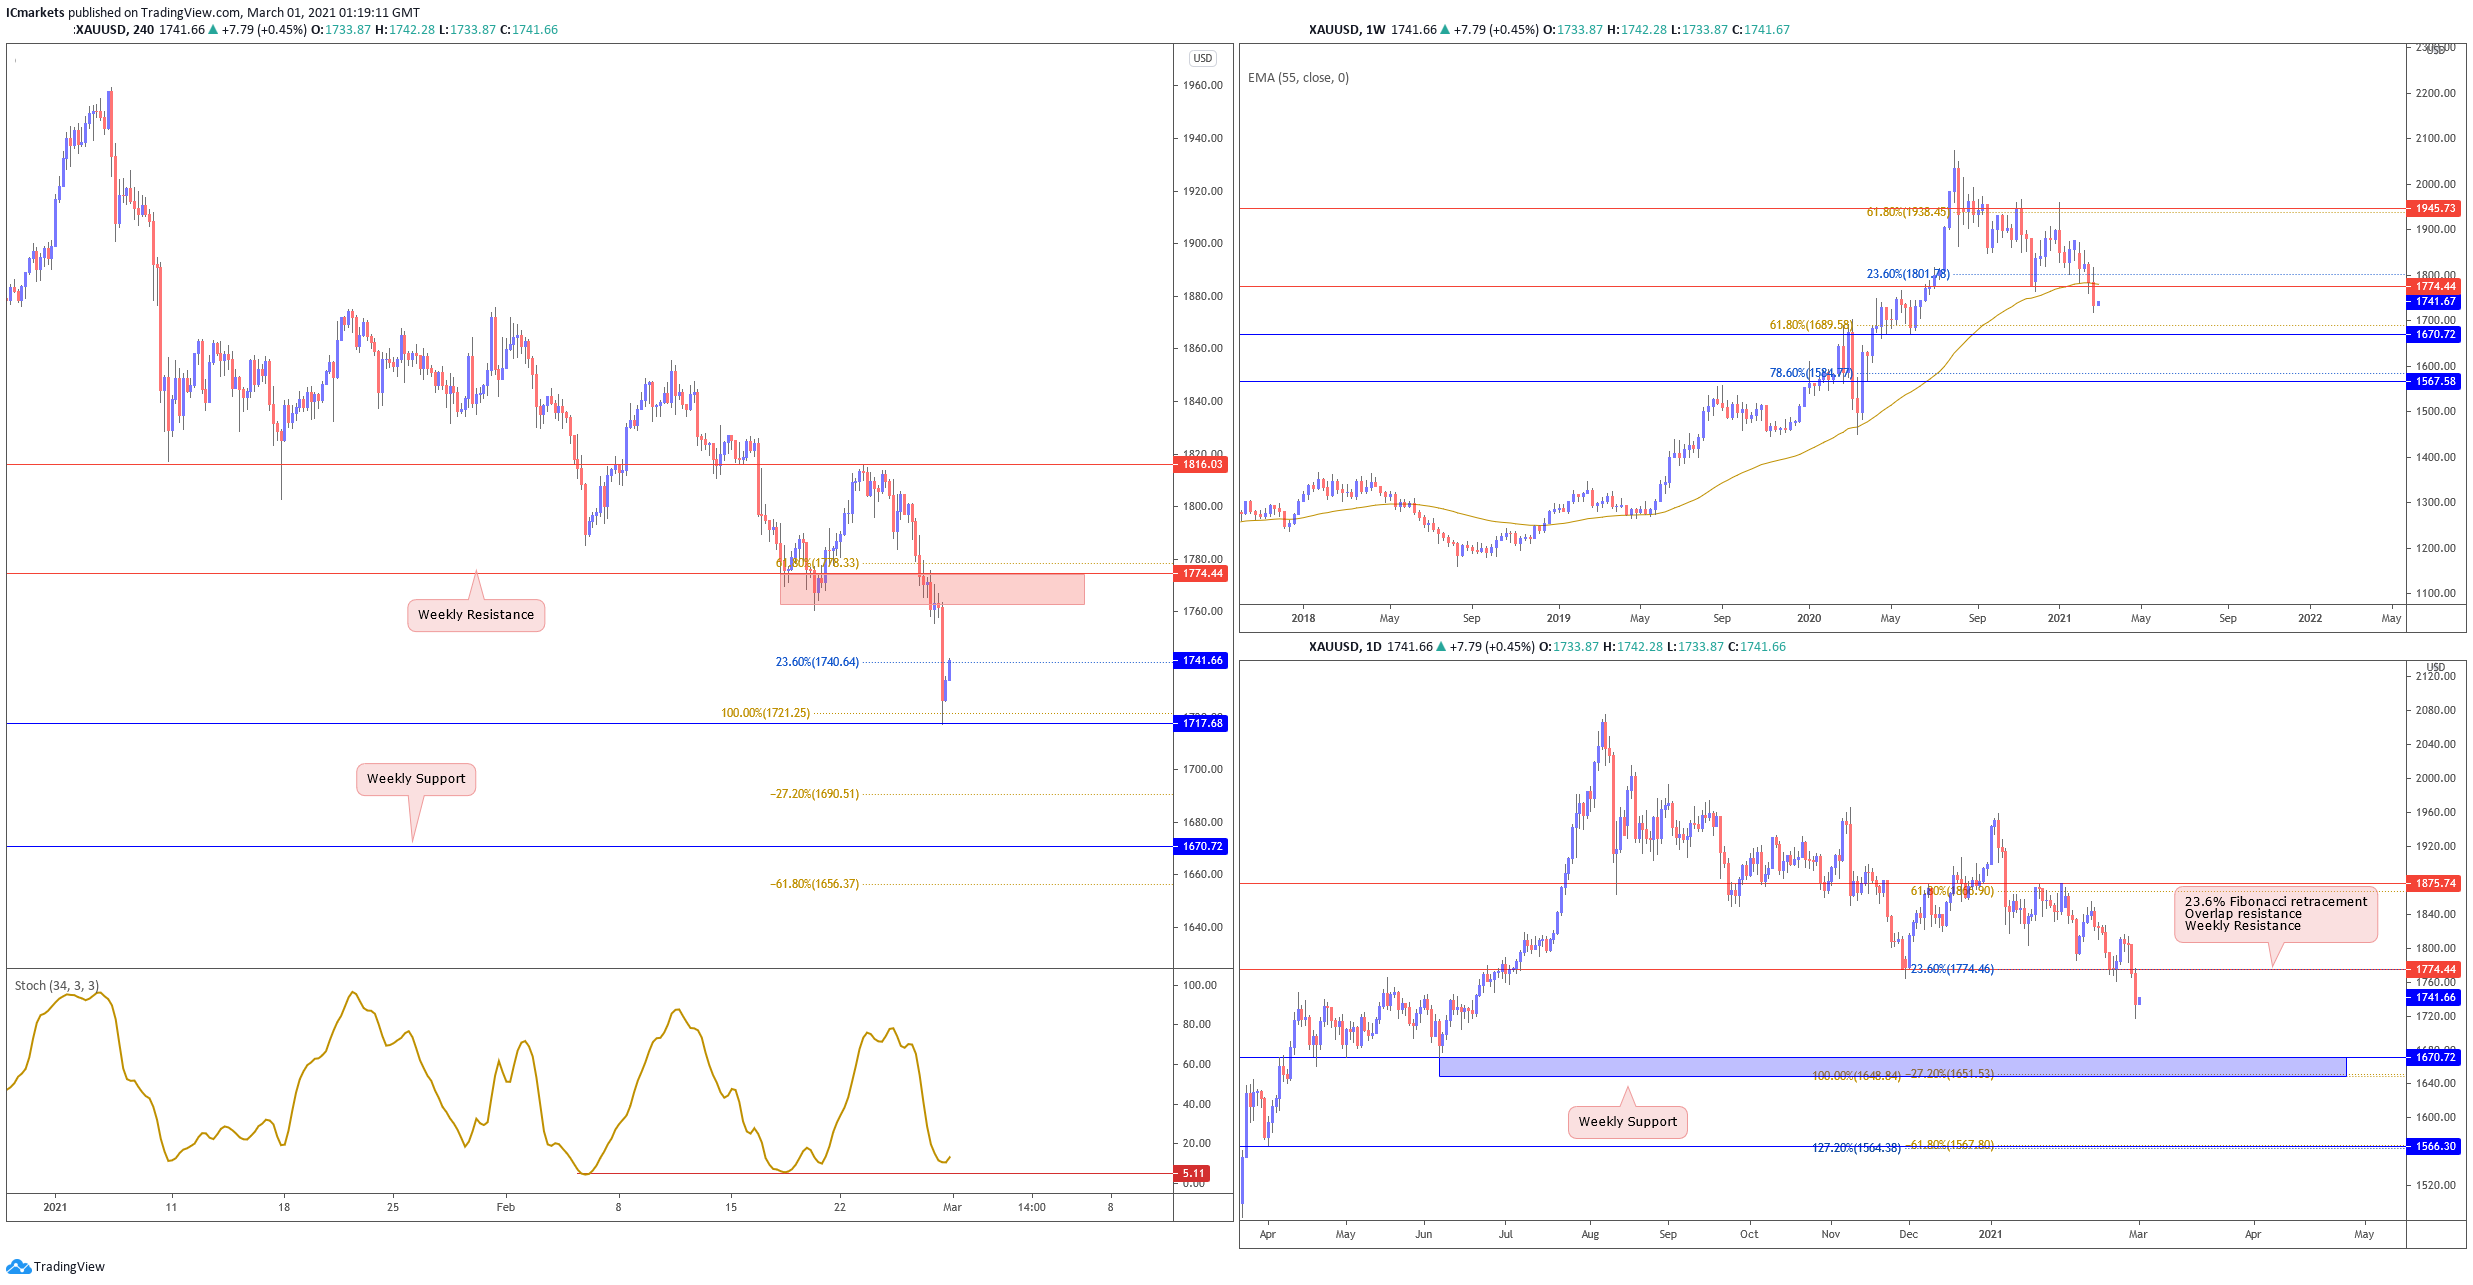
XAU/USD (GOLD):
On the weekly timeframe, gold pushed lower breaking previous supports. Price has also broken below long term moving average. Price could very well ride the bearish momentum and drift lower towards 1670 support which is in line with key 61.8% Fibonacci retracement level. On the daily chart, we see price drifting lower, and traders should look out for any pullbacks towards 1774 resistance where long term swing traders could add to their sells to push price lower towards 1670.
On the 4H timeframe price tested and reacted above 1717 support which is also in line with Key 100% Fibonacci extension level. With stochastics on support where price bounced in the past, a short term intraday bounce towards 1774 weekly resistance could be likely before seeing any chance of a drop. However, should price fail to hold above 1717 support, traders can also expect price to drop towards next weekly support at 1670 level.
Areas of consideration:
- 1717 intraday support to hold short term intraday bounce
The accuracy, completeness and timeliness of the information contained on this site cannot be guaranteed. IC Markets does not warranty, guarantee or make any representations, or assume any liability regarding financial results based on the use of the information in the site.
News, views, opinions, recommendations and other information obtained from sources outside of www.icmarkets.com.au, used in this site are believed to be reliable, but we cannot guarantee their accuracy or completeness. All such information is subject to change at any time without notice. IC Markets assumes no responsibility for the content of any linked site.
The fact that such links may exist does not indicate approval or endorsement of any material contained on any linked site. IC Markets is not liable for any harm caused by the transmission, through accessing the services or information on this site, of a computer virus, or other computer code or programming device that might be used to access, delete, damage, disable, disrupt or otherwise impede in any manner, the operation of the site or of any user’s software, hardware, data or property.


