
EUR/USD:
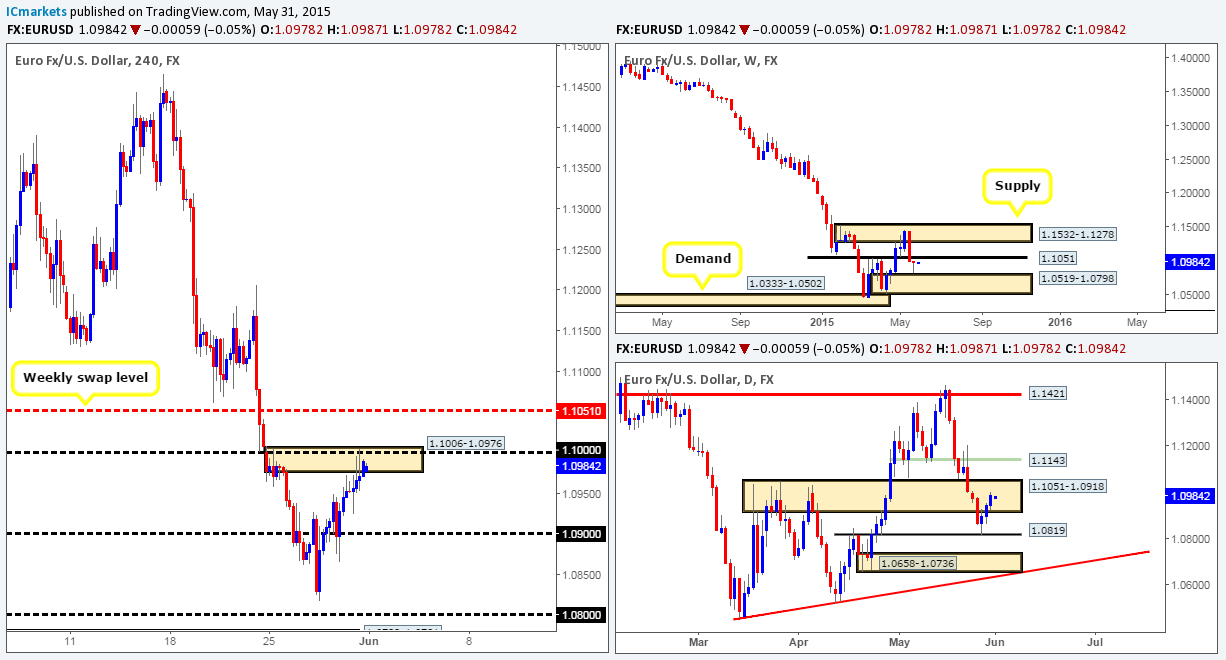
Weekly view – From a long-term standpoint, the trend is still southbound in our opinion, and will only change once price closes above the weekly supply area at 1.1532-1.1278.
Recent action, however, shows that relatively strong buyers came into the market twenty or so pips from above a weekly demand area seen at 1.0519-1.0798 last week. This, as you can clearly see, formed a bullish pin-bar candle going into the close 1.0990. Entering long on the basis of this candlestick pattern this week may not be the best path to take, since no one can be sure how much sell liquidity is sitting around the weekly swap level seen just above at 1.1051. It will be interesting to see what the lower timeframes have to offer…
Daily view: Technically, the reason why buying came into the market a little before the aforementioned weekly demand zone last week was simply because there was clearly enough buy liquidity sitting at the daily swap level coming in at 1.0819. From Wednesday onwards, price rallied from this barrier, consequently forcing price to close the week deep within a daily swap area at 1.1051-1.0918.
4hr view: Friday’s sessions saw the Euro shake hands with a combined 4hr supply/round-number area at 1.1006-1.0976/1.1000 – the reaction from this zone saw very little selling interest.
The open 1.0978 saw price gap south twelve pips below Friday’s closing price –1.0990. This, as you can see, has not really changed the overall technical structure on this timeframe. And as such, the aforementioned combined 4hr supply/round-number zone remains a key area for us today, since this is the point at which pro money likely made the decision to initially push below the daily swap area 1.1051-1.0918. Very similar to Friday’s analysis, there are two ways one could trade this pair today and possibly into the week. The first is keep a close watch on how lower timeframe price action responds within the combined 4hr area, if the you see resistance holding firm on the lower timeframes, it could be worth shorting this market. The second is to wait for this 4hr area to be broken, and look to enter short if price connects with the 1.1051 weekly swap level. If you are considering entering at this number, we would highly recommend waiting for lower timeframe strength to reinforce your higher timeframe expectation before risking capital.
Levels to watch/live orders:
- Buys: Flat (Predicative stop-loss orders seen at: N/A).
- Sells: 1.0006-1.0976 [Tentative – confirmation required] (Predicative stop-loss orders seen at: 1.1012) 1.1051 region [Tentative – confirmation required] (Predicative stop-loss orders seen at: dependent on where one confirms this level).
GBP/USD:
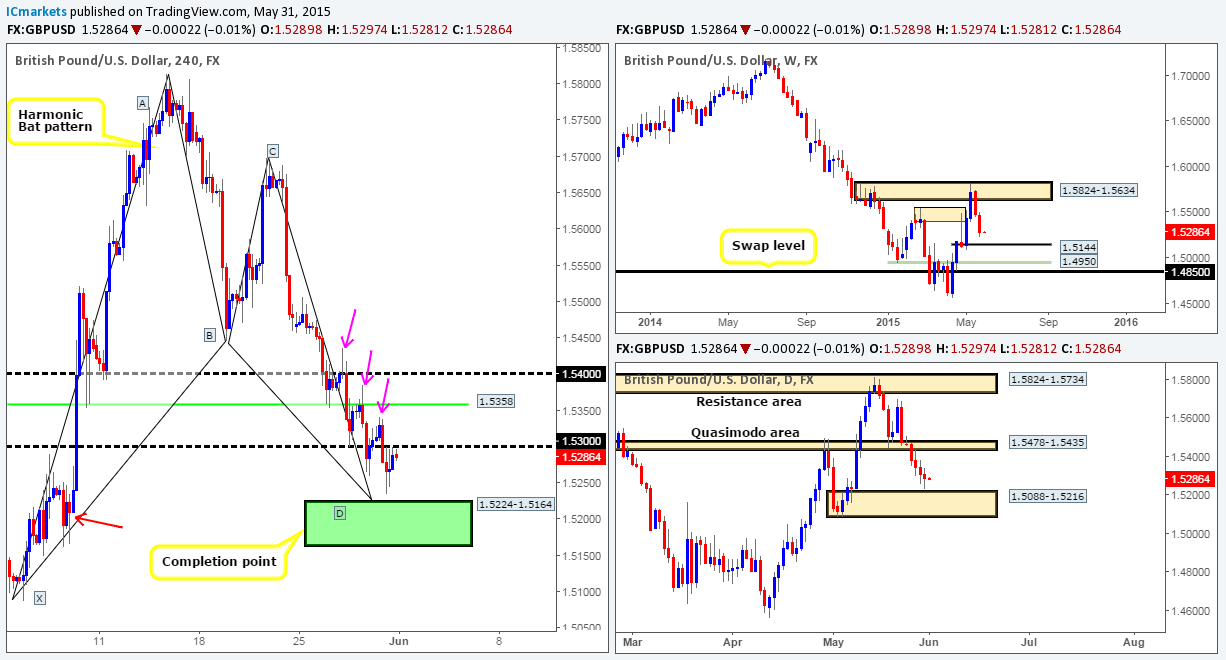
Weekly view – The weekly timeframe shows that the rebound seen from the weekly supply area at 1.5824-1.5634 extended lower last week, consequently forcing the GBP to close negatively at 1.5288. As per this chart, we see absolutely no reason why price will not continue to sell off this week down towards 1.5144.
Daily view: Following the break and retest of the daily Quasimodo area at 1.5478-1.5435 last week, price sold off just missing the daily demand zone seen at 1.5088-1.5216 (surrounds the weekly buy level 1.5144) by twenty or so pips. Therefore, with price not yet at any demand on this timeframe, there’s a good chance the pound will continue to sell off today.
4hr view: Friday’s trading day saw Sterling heavily sell off from 1.5341 and close below 1.5300, which as you can see was retested as resistance going into the close.
The open 1.5289 suggests that there was not really any big change seen over the weekend.
The analysis for this pair is relatively straightforward. If 1.5300 is able to hold this market lower, we may see price greet the 4hr Harmonic Bat completion area seen in green at 1.5224-1.5164 (located around the upper limits of the aforementioned daily demand area) sometime today or early on in the week. The symmetry we’ve seen on the approach to this 4hr Harmonic support zone has been beautiful – check out the already formed three-drive pattern marked with pink arrows. If 1.5300 does indeed hold we may see a final push consequently forming a four-drive pattern into our point of interest, which in itself is a reversal signal. However, this is not the only thing we have supporting the 4hr Harmonic completion zone. It is located within the upper limits of the aforementioned daily demand area, and also converges with not only a round number 1.5200, but with a 4hr demand area seen marked with a red arrow at 1.5162-1.5191 as well. With all of the above in mind, our team has decided that this 4hr Harmonic zone is worthy of a pending buy order – buy at 1.5228 with a stop placed just below at 1.5140.
Levels to watch/ live orders:
- Buys: 1.5228 (Predicative stop-loss orders seen at: 1.5140).
- Sells: Flat (Predicative stop-loss orders seen at: N/A).
AUD/USD:
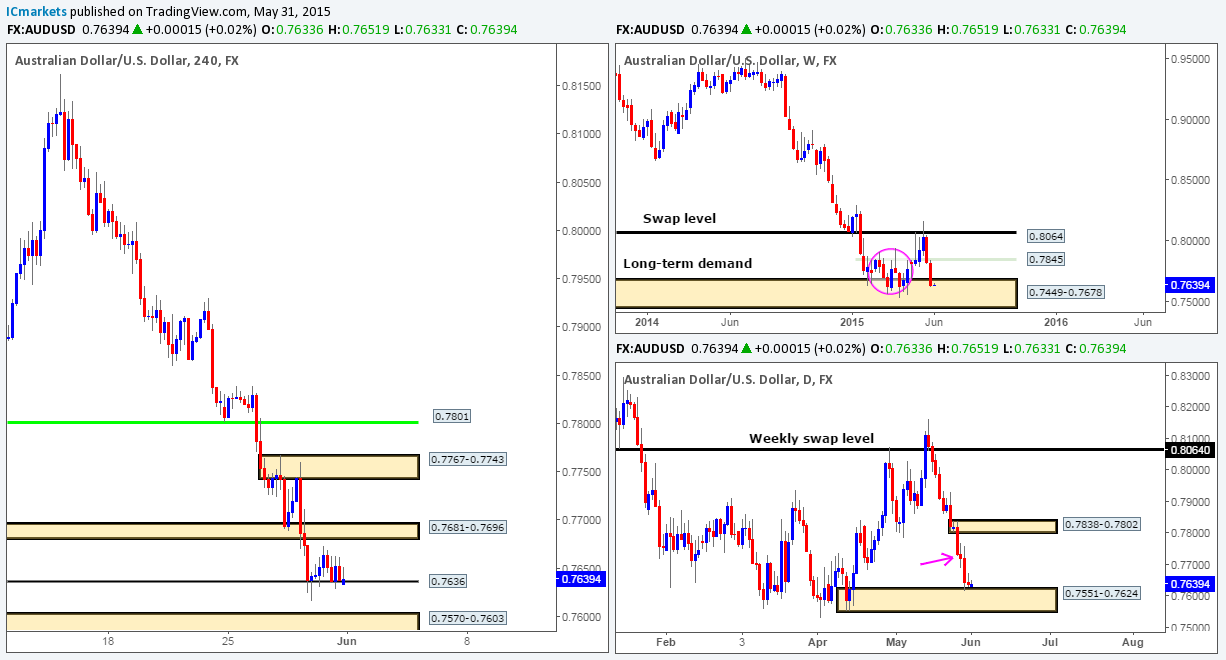
Weekly view – Long term, this trend on this pair is still southbound in our opinion, and will remain that way until we see a convincing push above 0.8064.
Recently though, like the GBP, buy side liquidity has clearly been very weak over the past two weeks. Following the close below the weekly swap level at 0.7845, the market continued to spiral south, consequently closing the week (0.7637) within a long-term weekly demand area coming in at 0.7449-0.7678. Judging by the messy reaction seen a few months earlier (pink circle – 02/02/15-06/04/15) at this zone, things could potentially get messy here once again.
Daily view: From the pits of the daily scale, we can see that price touched base with a relatively strong looking daily demand zone at 0.7551-0.7624 (located within the aforementioned weekly demand area) on Thursday, which as you can see, saw little interest from the buy side on Friday. Assuming that buying interest comes into the market here this week, however, areas to keep an eye on for downward pressure come in at 0.7767-0.7734 (pink arrow), and the small daily supply area sitting just above it at 0.7838-0.7802.
4hr view: The 4hr timeframe shows price spent much of its time teasing the minor 4hr swap level at 0.7636 during Friday’s sessions. There were clearly no big changes over the weekend as the market opened at 0.7633, only four pips below Friday’s closing price at 0.7637. The open, however, did push price below 0.7636, and is at the time of writing seen holding firm. If the sellers can hold the market below this number going into today’s more liquid sessions, it is likely price will test a beautiful 4hr demand area at 0.7570-0.7603. For those who read our previous report, you will probably recall that we have placed a pending buy order just above this zone at 0.7605, with a stop loss at 0.7565. For those who did not read the last report, here is why we’re believe this area is worthy of a pending buy order:
- Positioned deep within the aforementioned daily demand zone. From our experience, area located deep within higher timeframe zones have a higher probability of seeing a decent move.
- Lines up beautifully with the psychological threshold 0.7600.
- If you scroll back to the 15/04/15 where the 4hr demand zone formed, you’ll likely notice how strong the momentum from this area was! It was incredibly violent, indicating there may still be unfilled buy orders remaining with this area.
Levels to watch/ live orders:
- Buys: 0.7605 (Predicative stop-loss orders seen at: 0.7565).
- Sells: Flat (Predicative stop-loss orders seen at: N/A).
USD/JPY:
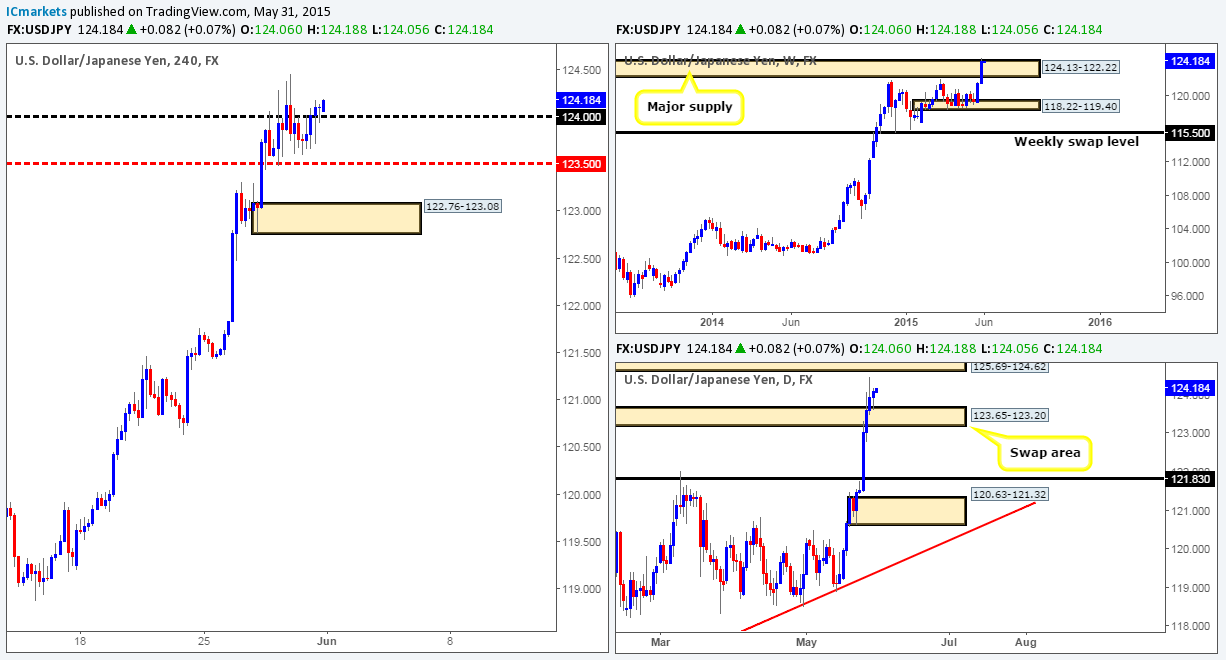
Weekly view – Essentially, the outlook on this pair remains positive. It is only once we see a close below the weekly swap level 115.50 will we be convinced the trend may be shifting.
The latest weekly action on the USD/JPY, however, has seen price rocket north over past two weeks, consequently forcing price to break above a major weekly supply area coming in at 124.13-122.22, and close very near its highs at 124.10. The question we now need an answer to is, was this break a continuation move to trade higher?
Daily view: From the daily timeframe, we can see that during Friday’s session, price held firm at a daily swap area seen at 123.65-123.20. Provided the buyers can hold out above this daily swap zone, it is very likely we will see this market rally to test a daily resistance area visible at 125.69-124.62. Should this occur, does it mean we think that the break above the weekly supply area is likely going to continue? Not necessarily. The reason for why is simply because the daily resistance area just mentioned above could force this market to sell off depending how much sell liquidity is sitting there. Ultimately, for us to be convinced a higher timeframe continuation move is in store, a break above the aforementioned daily resistance area will need to take place. Let’s take a look at what the 4hr timeframe has to say…
4hr view: During both Thursday and Friday’s sessions we saw price oscillating around the 124.00 handle. Going into the close, nonetheless, price did break above this number and retest it as support, consequently forming a bullish pin-bar candle. Buying based on the retest of 124.00 could be a viable option today – not one that we would consider though, since it is very difficult to know if there is any sell side liquidity left within the upper limits of the weekly supply at 124.13-122.22. If you’re still considering a buy here, we would highly recommend waiting for some sort of lower timeframe confirming signal, and keeping your first take-profit target close.
By shorting this pair on the other hand, you run the risk of selling into possible buying pressure from the daily swap area 123.65-123.20, and also round-number support at 124.00. Therefore, as far as we can see, we have little choice but to take a back seat on this pair for the time being until more conducive price action develops.
Levels to watch/ live orders:
- Buys: Flat (Predicative stop-loss orders seen at: N/A).
- Sells: Flat (Predicative stop-loss orders seen at: N/A).
USD/CAD:
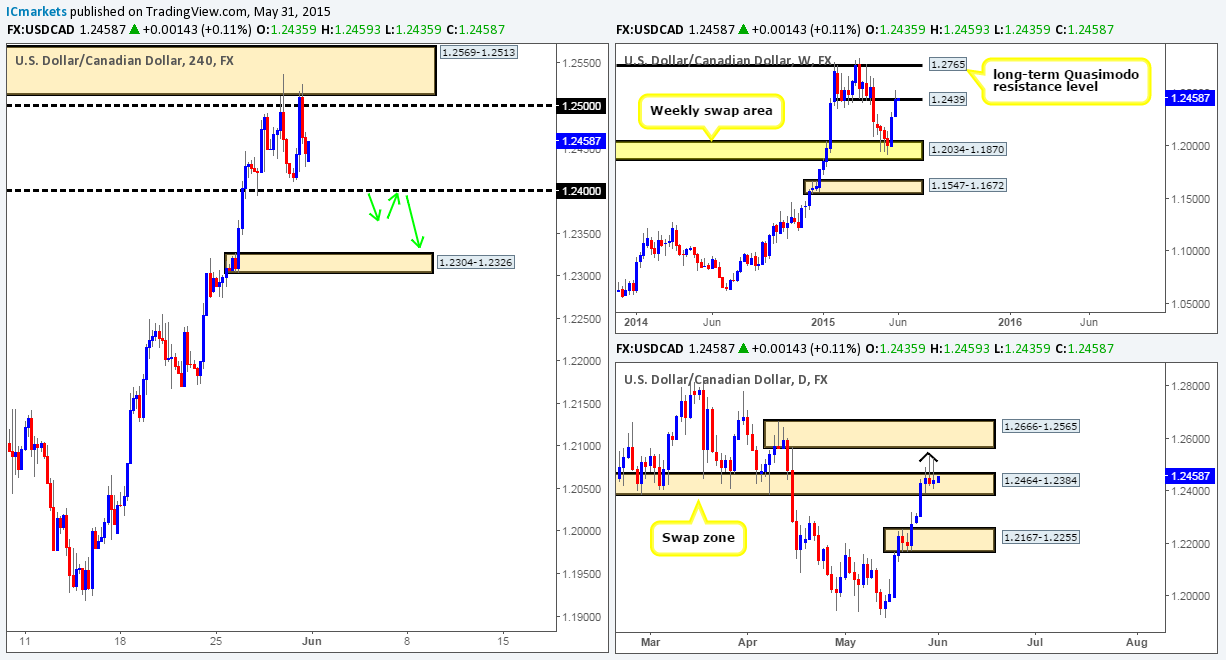
Weekly view – Overall, the trend on this pair is still pointing north. A break below the weekly swap area 1.2034-1.1870 would be required to invalidate this bias.
Recent events on the weekly timeframe, however, show that the rebound seen from the weekly swap area at 1.2034-1.1870, extended higher during last week’s trading with little to no sell side liquidity being seen until price connected with a weekly swap level positioned at 1.2439. Judging by how well 1.2439 supported this market from the 02/02/15 to the 06/04/15, it is likely this will be a challenging resistance to break this week.
Daily view: Thursday and Friday’s price action printed back-to-back bearish pin-bar candles around a daily swap area seen at 1.2464-1.2384, forcing the market to close the week at 1.2444. When we see price print selling tails like this that forms an ‘umbrella-like shape’ in an area of supply or demand (check the chart) it usually results in further buying/selling.
4hr view: Friday’s sessions saw the USD/CAD revisit the 4hr supply area at 1.2569-1.2513 (located just below a daily supply area coming in at 1.2666-1.2565), which, as you can see, once again sold off. For those who read Friday’s report, you may recall we had a live sell position in the market at 1.2509 just below this 4hr supply zone, which is still active since we left the position open over the weekend.
The reason for leaving our position open was simply because of what we’re seeing on the higher-timeframe picture at the moment (see above). As such, very similar to Friday’s analysis, all eyes will be on the 1.2400 number today. Ultimately, we would like to see this level attacked and eventually consumed; as this would give us the confidence to move our stop to breakeven. In addition, a break below this number would also likely clear the path south down towards 4hr demand at 1.2304-1.2326, which is where we intend to liquidate our full position. 1.2400 could also be an ideal place to enter short if a break lower is seen. That said though, we would only consider adding to our position here if price retested this level as resistance (as per the green arrows) and showed some form of lower timeframe selling signal.
Levels to watch/ live orders:
- Buys: Flat (Predicative stop-loss orders seen at: N/A).
- Sells: 1.2509 [Live] (Predicative stop-loss orders seen at: 1.2574).
USD/CHF:
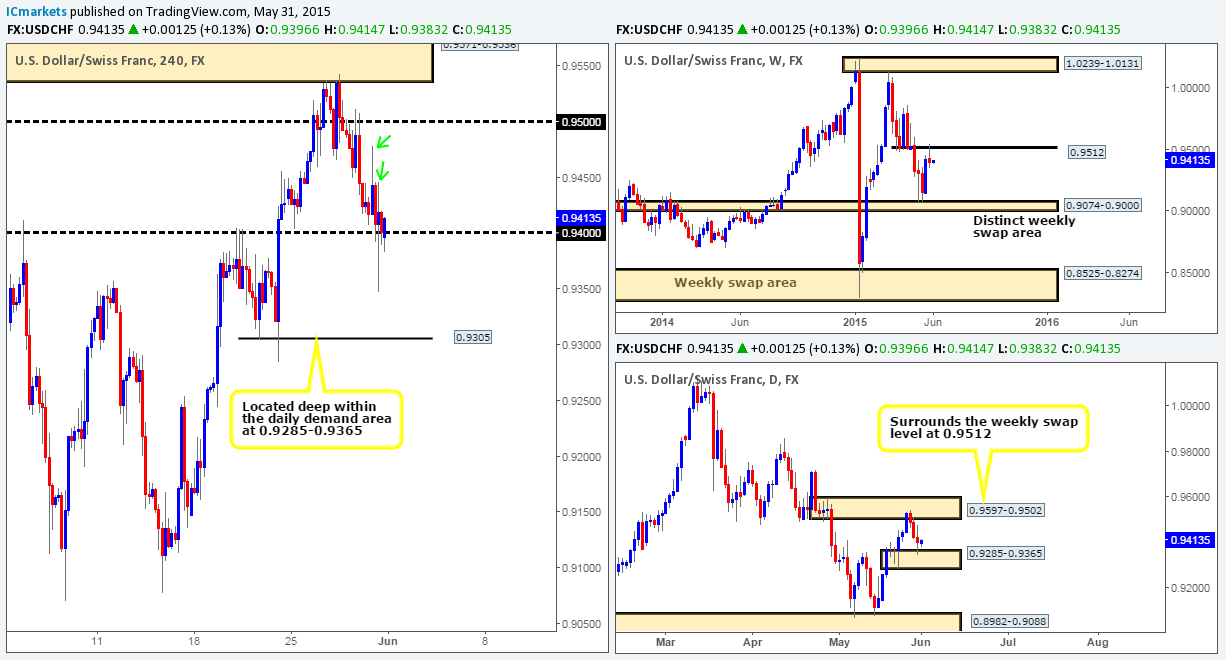
Weekly view –The weekly timeframe shows price respected the weekly swap level at 0.9512 last week, resulting in the market closing bearishly at 0.9401. Assuming that the sellers can continue with this tempo this week, we may see the market drive back down to the weekly swap area at 0.9074-0.9000.
Daily view: From Wednesday onwards, we can see that price sold off nicely from a daily supply area seen at 0.9597-0.9502 (surrounds the aforementioned weekly swap level). This sell off eventually saw price punch into a daily demand area coming in at 0.9285-0.9365. Therefore, in order for further selling to be seen on the weekly timeframe this week, any buy side liquidity will need to be eaten around this daily demand zone.
4hr view: Throughout the majority of Friday’s sessions, price was seen teasing the 0.9400 number. As you can see, there was clearly not much buy side interest sitting around this level at that time, as the 0.9400 opened up to a deep stop run at the beginning of the U.S open, which if you look back to the daily chart, you’ll actually see this move tagged in the aforementioned daily demand area.
Little change was seen over the weekend as the market opened only five pips below Friday’s close (0.9401) at 0.9396. With this, and all of the above taken into consideration, 0.9400 will be a key level for our team in today’s sessions. In the event that price holds above 0.9400, we could potentially see price rally up to 0.9500. The reason why we believe price could rally this far is due to the majority of the supply above already likely being consumed. Check out the two supply consumption wicks seen marked with green arrows at 0.9445 and 0.9478. However, although 0.9400 is showing backing from the aforementioned daily demand area and the path north is potentially free of 4hr supply, we still have to take into consideration that by buying from 0.9400 (even with lower timeframe confirmation) we are potentially crossing swords with oncoming selling opposition from the weekly swap level mentioned above. Therefore, any trades long taken from this number will need constant monitoring.
On the other hand, should a violation of 0.9400 be seen today, this could stimulate a decline down towards the 4hr Quasimodo support level 0.9305 (located deep within the aforementioned daily demand area). Despite this, we’d only be interested in trading this move if price retested 0.9400 as resistance beforehand.
Levels to watch/ live orders:
- Buys: 0.9400 [Tentative – confirmation required] (Predicative stop-loss orders seen at: dependent on where one confirms this level).
- Sells: Flat (Predicative stop-loss orders seen at: N/A).
US 30:
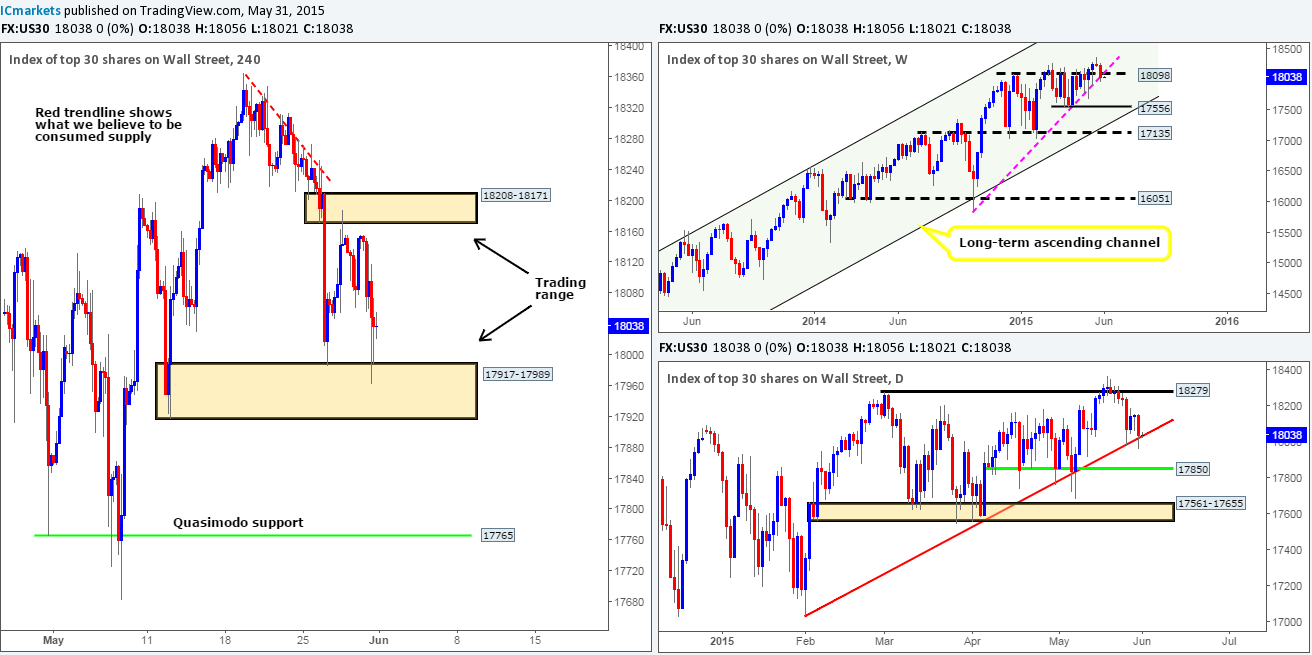
Weekly view – Overall, this index is still in a very strong uptrend. A push below the weekly support level 16051 would be required to invalidate this bias.
Last week’s action, nevertheless, shows that the DOW index sold off. This move saw price close (18038) below the 18098 weekly swap level, and drive head first into a weekly trendline extended from the low 15849. Provided that this trendline can support the market this week, we may see a counter-attack take place. If on the other hand, this weekly trendline gives way, we could witness a decline in value down towards the weekly swing low 17556, or even the weekly swap level at 17135 given enough time.
Daily view: Similar to the weekly timeframe, we can see that price is now currently nibbling at a daily trendline taken from the low 17033. Assuming that the buyers can hold out here, we may see a rally back up to 18279. Conversely, a break below this daily trendline would likely attract further selling down towards the daily support level 17850.
4hr view: The 4hr timeframe shows that the DOW sold off for the majority of Friday’s sessions, a little buying interest was seen as London’s session opened for business, but other than this it was certainly a sellers’ market until price connected with a 4hr demand area coming in at 17917-17989.
There were clearly no big changes over the weekend as price opened at exactly the same number it closed at on Friday, 18038.
With all of the above taken into consideration, what do we see happening today and possibly into the week? Well, at the time of writing, price is capped between the aforementioned 4hr demand area and a 4hr supply zone coming in at 18208-18171. Therefore, intraday trades could be possible today off of these limits – waiting for lower timeframe confirming price action here is recommended.
Going further into the week, we’ll likely see a break of one of these zones. A violation of the 4hr demand area could open the gates for prices to challenge the 4hr Quasimodo support level at 17765 (located just below the daily support level mentioned above at 17850). A push above the 4hr supply area, nevertheless, could suggest further upside towards at least 18340. The reason we believe price could stretch that far is simply because above this 4hr supply area we see nothing but consumed sellers. The wicks you see poking above the red trendline was likely the work of pro money spiking north to fill any unfilled sell orders to continue shorting this market, thus once/if price reaches this area, the market should slice through this congested zone like a hot knife through butter.
Entering on the break of either of the above 4hr zones will (for us) require a retest along with corresponding support from the lower timeframes to execute a position.
Levels to watch/ live orders:
- Buys: 17917-17989 [Tentative – confirmation required] (Predicative stop-loss orders seen at: 17907).
- Sells: 18208-18171 [Tentative – confirmation required] (Predicative stop-loss orders seen at: 18215).
XAU/USD (Gold)
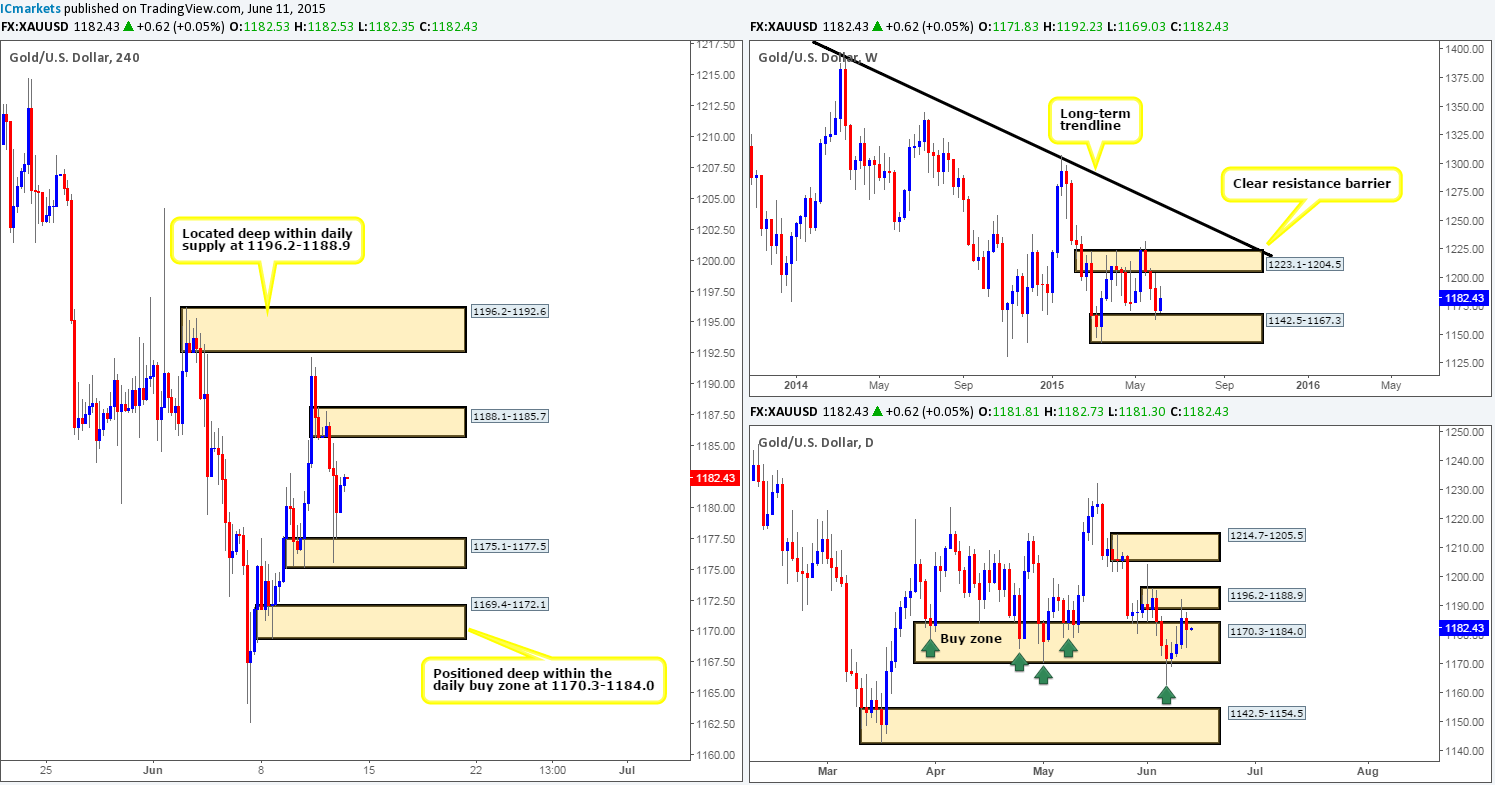
Weekly view – From a long-term perspective, the gold market is still trending south in our opinion. For this bias to be invalidated, a push above the weekly trendline extended from the high 1488.0 would need to be seen. Last week’s trading, nonetheless, saw price continue to sell off, consequently slam dunking itself into a small weekly demand zone at 1170.3-1188.4 and closing at 1190.4.
Daily view: Mid-week, we can see that price came into contact with a daily buy area at 1170.3-1184.0 (located within the aforementioned weekly demand zone), which as you can see, converges just beautifully with a daily trendline extended from the low 1142.5. In the event that the buying interest comes into the market here, it is likely we’ll see price shake hands with a daily supply area seen just above at 1214.7-1205.5.
4hr view: From this timeframe, we can see that Friday’s sessions saw some volatility at the underside of a 4hr swap area coming in at 1191.1-1194.4 but ended up closing relatively neutral going into the close.
The open 1190.5 on the other hand, forced price to spike above the aforementioned 4hr swap area, consequently forming a very distinct 4hr bearish pin-bar candle. This break higher should not really come as much of a surprise considering where price is located on the higher timeframe picture (see above) at the moment. Provided that this push higher triggered in any sell side liquidity above this zone, it is very likely the path north is clear for price to test the 4hr resistance cluster seen at 1203.2/1205.8 sometime this week. To trade this move, nonetheless, we’d need to see a firm retest of this 4hr swap area as demand, which should be followed by lower timeframe confirming price action. Shorting this market on the other hand, is not really something our team is showing interest in at the moment. The reason for why is of course the where price is positioned on the higher timeframes, and also there is very little room for price to move south – very congested.
Levels to watch/ live orders:
- Buys: Flat (Predicative stop-loss orders seen at: N/A).
- Sells: Flat (Predicative stop-loss orders seen at: N/A


