
A note on lower timeframe confirming price action…
Waiting for lower timeframe confirmation is our main tool to confirm strength within higher timeframe zones, and has really been the key to our trading success. It takes a little time to understand the subtle nuances, however, as each trade is never the same, but once you master the rhythm so to speak, you will be saved from countless unnecessary losing trades. The following is a list of what we look for:
- A break/retest of supply or demand dependent on which way you’re trading.
- A trendline break/retest.
- Buying/selling tails – essentially we look for a cluster of very obvious spikes off of lower timeframe support and resistance levels within the higher timeframe zone.
- Candlestick patterns. We tend to only stick with pin bars and engulfing bars as these have proven to be the most effective.
For us, lower timeframe confirmation starts on the M15 and finishes up on the H1, since most of our higher timeframe areas begin with the H4.
EUR/USD:
Despite last week’s action ranging over 180 pips, the single currency closed a mere 37 pips above the prior week’s close at 1.0829. Looking at the weekly chart, we can see that a rather vicious selling wick formed, dragging price down to support at 1.0796 (blue line) which has capped the downside in this market since the beginning of Dec 2015. Therefore, one might want to be mindful of this fact if considering sells this week.
Moving down to the daily timeframe, the EUR was well-bid for the best part of last week from support penciled in at 1.0813. It was only until Friday’s session got into full swing did things begin to turn sour. A strong wave of offers pummeled this pair from supply at 1.0992-1.0951, erasing most of the week’s gains and ending the day by jabbing back down into the above said support.
And finally, a look at the H4 timeframe shows just how relentless Friday’s sell-off was, despite fundamentals printing a weak U.S. GDP report! Both psychological support 1.0900 and the mid-level barrier 1.0850 were taken out, finishing the day off around lows of 1.0809.
For those who read Friday’s report (http://www.icmarkets.com/blog/friday-29th-january-daily-technical-outlook-and-review/), it was noted that between mid-level resistance 1.0950 and the H4 supply at 1.0992-1.0973 (pink circle) was a good place to sell at. However, in an attempt to get more bang for our buck, we wanted to sell higher at the H4 supply rather than taking what was offered at the time – clearly a silly decision in this case! Well done to any of our readers who managed to short this move!
In light of both the weekly and daily charts trading at support (see above) right now, shorting this market today, and quite possibly during the week, is not really something we’d be comfortable with. What has taken our fancy, however, is the collection of H4 structures just below current prices consisting of a psychological support 1.0800, a H4 support area at 1.0777-1.0790 and the H4 support lurking directly below here at 1.0772. This – coupled with the bedrock of higher timeframe supports in play (see above), marks a high-probability reversal zone. Whether one chooses to enter here with a pending order or wait for further confirmation is totally trader dependent. For us, nonetheless, we’re going to wait for lower timeframe confirmation before buying here. Reason being is that our stop would likely be smaller thus increasing risk/reward. Targets are difficult to predict right now since the approach to this zone is not yet visible.

Levels to watch/live orders:
- Buys: 1.0772/1.0800 [Tentative – confirmation required] (Stop loss: dependent on where one confirms this area but will likely be beyond the 1.0772 mark).
- Sells: Flat (Stop loss: N/A).
GBP/USD:
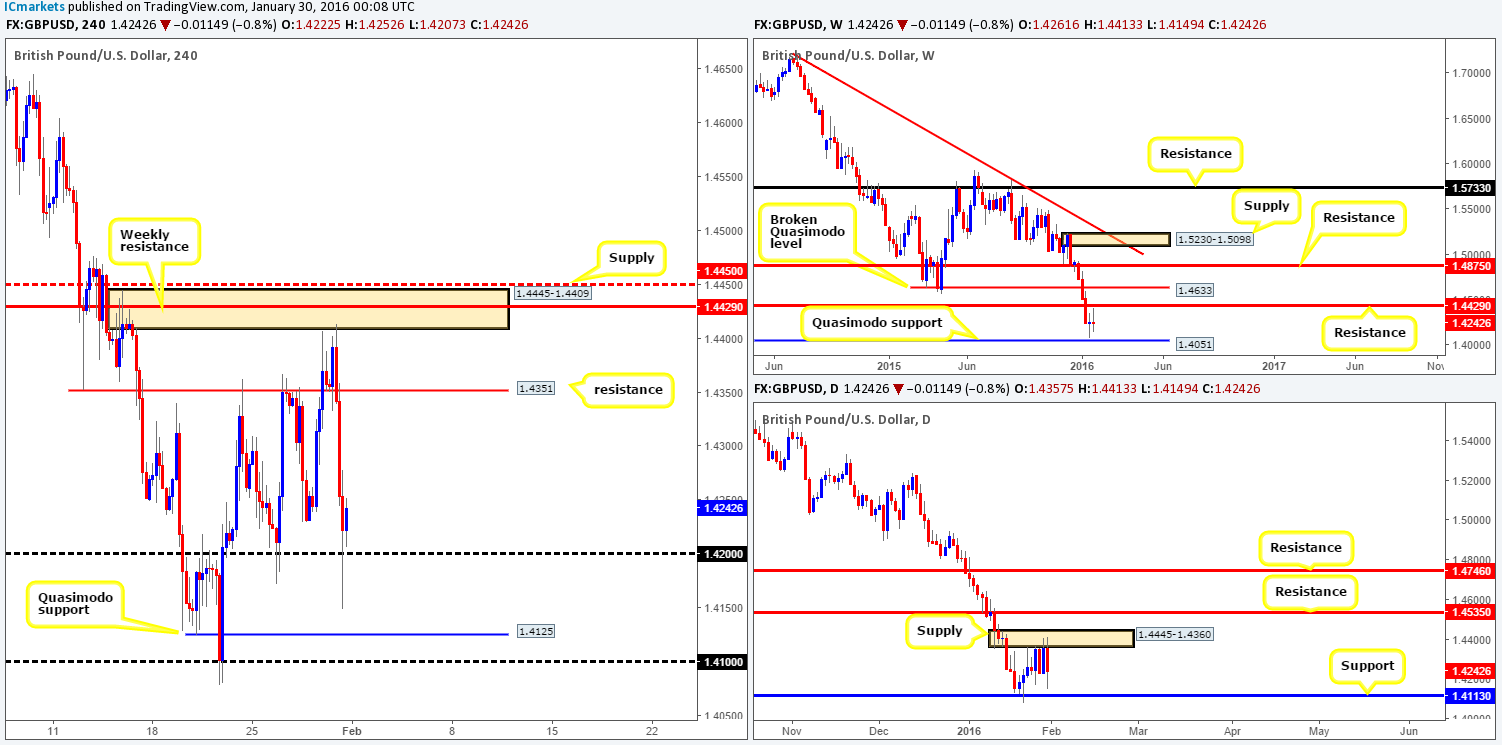
GBP/USD remained relatively unchanged at the close 1.4242 last week, forming yet another weekly indecision candle. Despite this, Cable recorded a 260-pip price range last week, just missing the weekly resistance at 1.4429 by a hair. As such, both the aforementioned weekly resistance and weekly Quasimodo support seen below at 1.4051 will once again be on our watch list this week.
Daily action on the other hand shows that price remained suppressed by supply drawn from 1.4445-1.4360. This is no ordinary supply though guys since it encapsulates the weekly resistance discussed above, thus adding more weight to this barrier. In spite of this, the market closed the week out mid-way between this area and support drawn from 1.4113 which already held this market higher beautifully on the 20th Jan 2016. Therefore, both of these barriers will also be on our watch list this week as each has proved reliable.
Going into Friday’s European session on the H4, the Pound snowballed south from the underside of supply seen at 1.4445-1.4409 despite weak U.S. GDP figures. Both H4 support at 1.4351 (now resistance) and psychological support 1.4300 were taken out with price ending the week aggressively whipsawing through psychological support 1.4200.
To our way of seeing things right now, there is little direction seen from the higher timeframe structures as both are effectively trading mid-range (see above). To that end, trading anywhere other than the H4 Quasimodo support 1.4125/psychological support 1.4100 (converges with daily support at 1.4113) and the H4 resistance 1.4351/H4 supply mentioned above at 1.4445-1.4409 (both structures fuse together with higher timeframe resistances [see above]) is considered lower probability for us. That being the case, no action will be taken until either one of these areas come into play since we believe that trading without higher-timeframe confluence is difficult – not impossible mind you, but certainly a lot less stressful.
Levels to watch/live orders:
- Buys: 1.4125/1.4100 [Tentative – confirmation required] (Stop loss: dependent on where one confirms this area).
- Sells: 1.4351 [Tentative – confirmation required] (Stop loss: dependent on where one confirms this level). 1.4445-1.4409 [Tentative – confirmation required] (Stop loss: dependent on where one confirms this area).
AUD/USD:
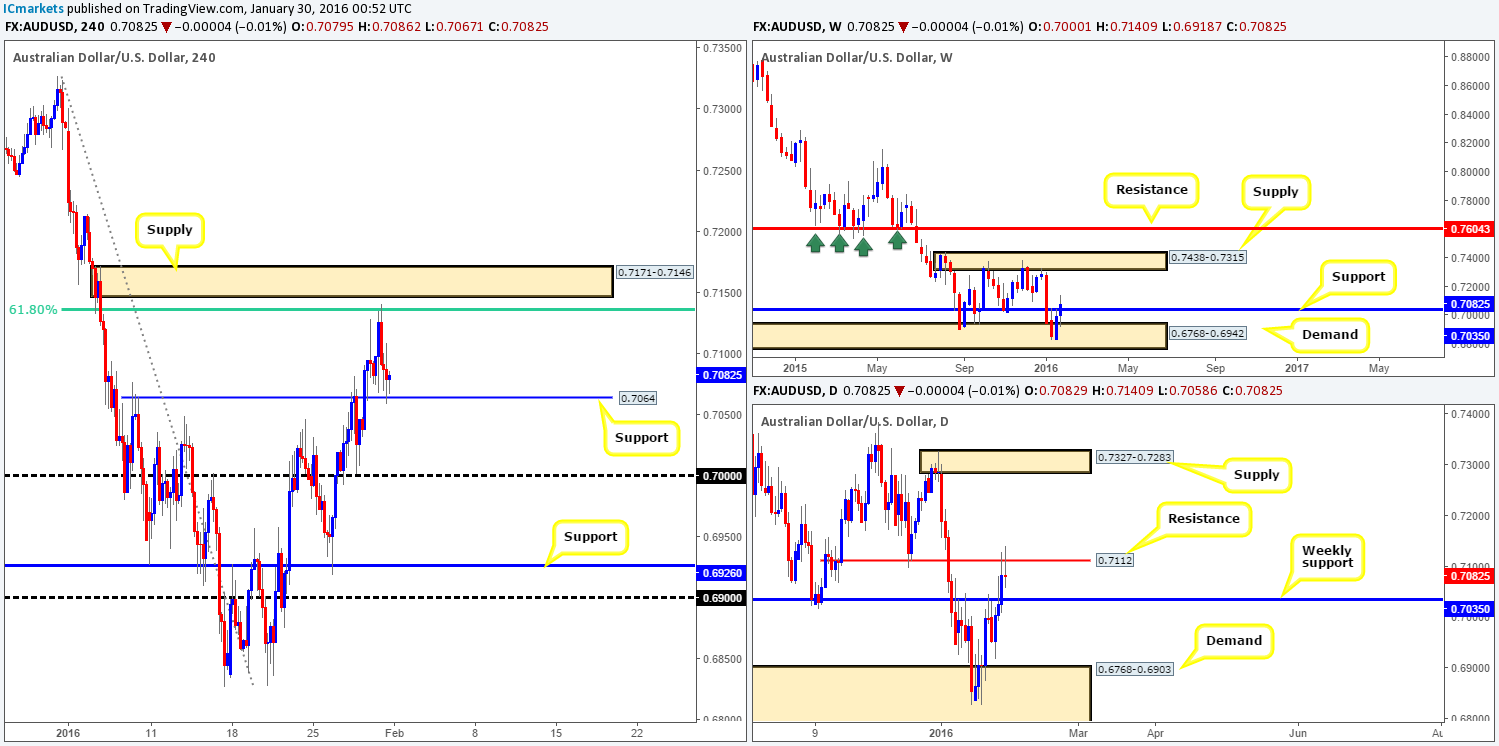
Following the rebound from weekly demand at 0.6768-0.6942 the Aussie continued to press higher last week, consequently gaining around 85 pips and closing above a weekly resistance (now acting support) level at 0.7035. In the event that the buyers manage to hold ground above this number this coming week, the next upside target on our radar falls in around supply drawn from 0.7438-0.7315.
By contrast, daily flow was recently seen crossing paths with resistance coming in at 0.7112, which, as you can see, has so far managed to hold firm. Considering shorts from this region, nevertheless, may be troublesome due to how close weekly support at 0.7035 is sitting. On the flip side, supposing that price closes above the current resistance, then, as far as we see, there’s very little stopping this market from rallying up to at least supply coming in at 0.7327-0.7283.
A quick recap of Friday’s sessions on the H4 show that strong sellers stepped in at around the 0.7134 (61.8% Fibonacci level) figure as London began opening its doors for business, driving the pair down to H4 support at 0.7064 which held steady into the close 0.7082.
From our perspective, neither long nor shorts seem appropriate at this time. Entering long from the current H4 support will see traders buying into daily resistance, whereas selling from either the 0.7134 mark or even the supply above at 0.7171-0.7146 would place you against current weekly flow! Therefore, we feel the most logical path to take would be to wait for the higher-timeframe structures to produce clearer direction. For example, a daily close above daily resistance at 0.7112 would confirm direction on both timeframes, thus suggesting longs are the more probable trades. Alternatively, a daily close below the weekly support at 0.7035 indicates weakness, and sells would likely be the more appropriate trades.
Levels to watch/live orders:
- Buys: Flat (Stop loss: N/A).
- Sells: Flat (Stop loss: N/A).
USD/JPY:
The USD/JPY had a spectacular week, gaining around 240 pips by the close 121.11. Consequent to this, resistance (now support) at 118.84 was taken out and price ended the week nudging into resistance drawn from 121.62. On account of this, entering long this week may be a risky endeavor to undertake…
Branching lower to the daily timeframe, it’s clear to see that Friday was the main catalyst for the big gains recorded last week. This recent surge in buying was triggered due to the BoJ introducing negative rates. Both resistance (now support) at 120.16 and supply (now demand) seen just above at 120.65-120.35 were consumed during this onslaught, which, as you can see, ended with price topping out at 121.68, thirty or so pips below resistance penciled in at 122.02
Zooming in and looking at the H4 timeframe shows the extent of Friday’s volatility. Getting caught on the wrong side of this would have been a painful experience! As can be seen from the chart, price concluded trade above support visible at 120.63 (represents the top side of daily demand at 120.65).
Now, considering that this unit is already crossing swords with weekly resistance at 121.62, a sell-off is very much a possibility this week. For all that though, both the daily and H4 charts show room to appreciate further up to around the 122.00 mark (see above). Given this, here is how we intend to approach this market in the coming week:
- Watch lower timeframe price action around the current weekly resistance level for possible short opportunities.
- Should further buying be seen we’d then be looking to short the 122.00 region, since it’s also backed by both H4 resistance at 122.21 and daily resistance at 122.02.
- If the aforementioned H4 support gives way, there is a high probability that this market will continue driving lower down to at least H4 demand drawn from 119.69-119.43. With that, shorts could be possible on any confirmed retest seen at this number.

Levels to watch/live orders:
- Buys: Flat (Stop loss: N/A).
- Sells: Watch for bids to be consumed around 120.63 then look to trade the any retest seen thereafter (lower timeframe confirmation required). Keep an eye on lower timeframe structure around the weekly resistance barrier at 121.62 for potential (confirmed) shorts). 122.00 region [Tentative – confirmation required] (Stop loss: dependent on where one confirms this level).
USD/CAD:
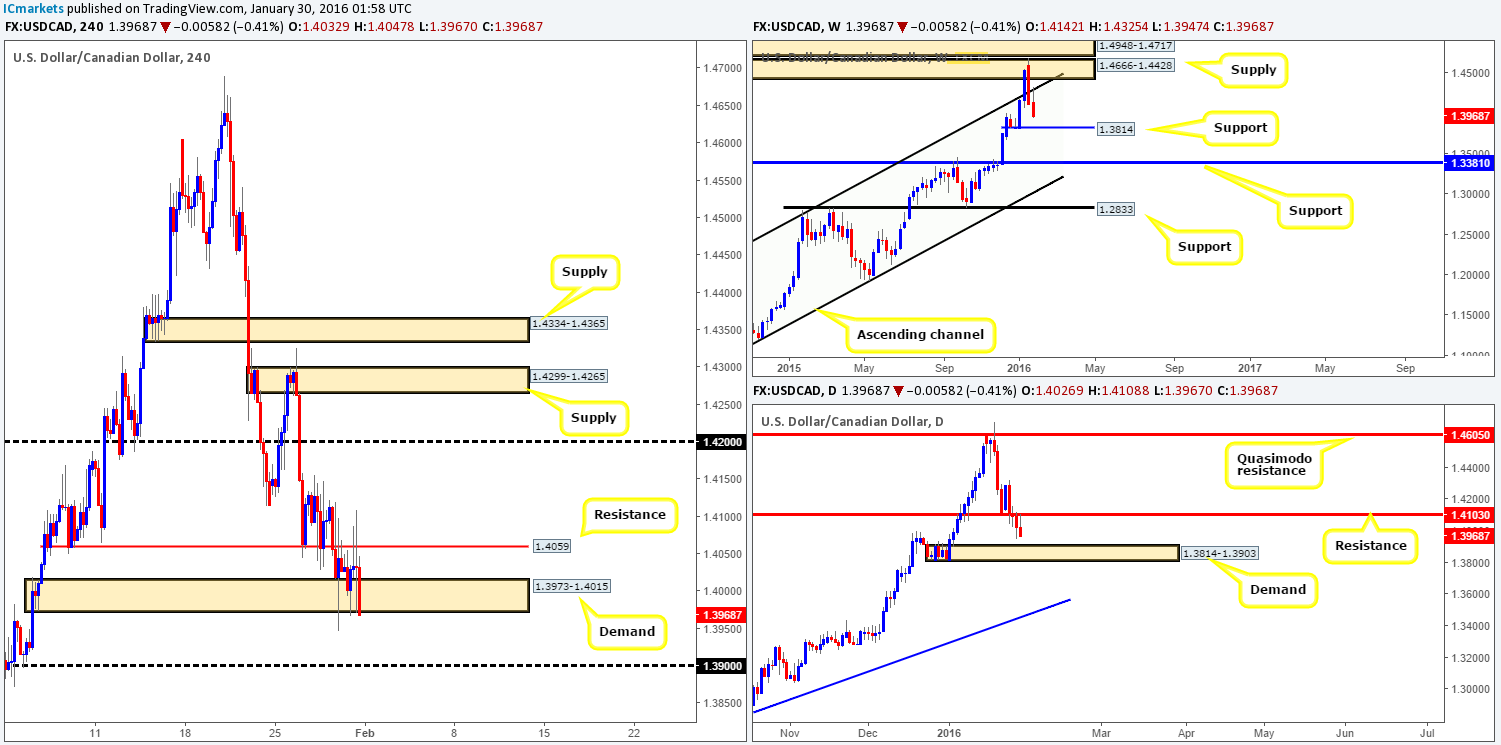
The USD/CAD pair shredded a further 150 pips of value into the close 1.3968 last week after price retested the underside of the weekly channel resistance (1.1173). On the assumption that the sellers continue to perform, it’s likely this unit will be crossing swords with weekly support penciled in at 1.3814 sometime this week, so do keep a tab on this hurdle.
From the other side of the field, daily flow recently retested 1.4103 as resistance. This, at least in our book, indicates that prices may want to plug into bids sitting around demand taken from 1.3814-1.3903 sometime this week. We would strongly advise against placing pending buy orders on the basis of this demand though, since the weekly support discussed above at 1.3814 represents the floor of this daily demand. And from experience fixed levels such as these are prone to stops runs!
In-line with the higher-timeframe structures, H4 demand at 1.3973-1.4015 was recently chewed to pieces as bids failed to push this pair above near-term resistance 1.4059. In light of this, our team now has their eyes on psychological support 1.3900 which is likely to come into play this week. Taking longs from this number are high probability in our opinion due to 1.3900 representing the top-side of daily demand just mentioned above. As bullish as this sounds though guys, we have to keep in mind that weekly flow could potentially push prices as low as the 1.3800 region before any rebound is seen (discussed above in bold). In consequence, pulling the trigger at 1.3900 without any supporting lower timeframe price action is not something we’d be comfortable with.
Levels to watch/live orders:
- Buys: 1.3900 [Tentative – confirmation required] (Stop loss: dependent on where one confirms this level).
- Sells: Flat (Stop loss: N/A).
USD/CHF:
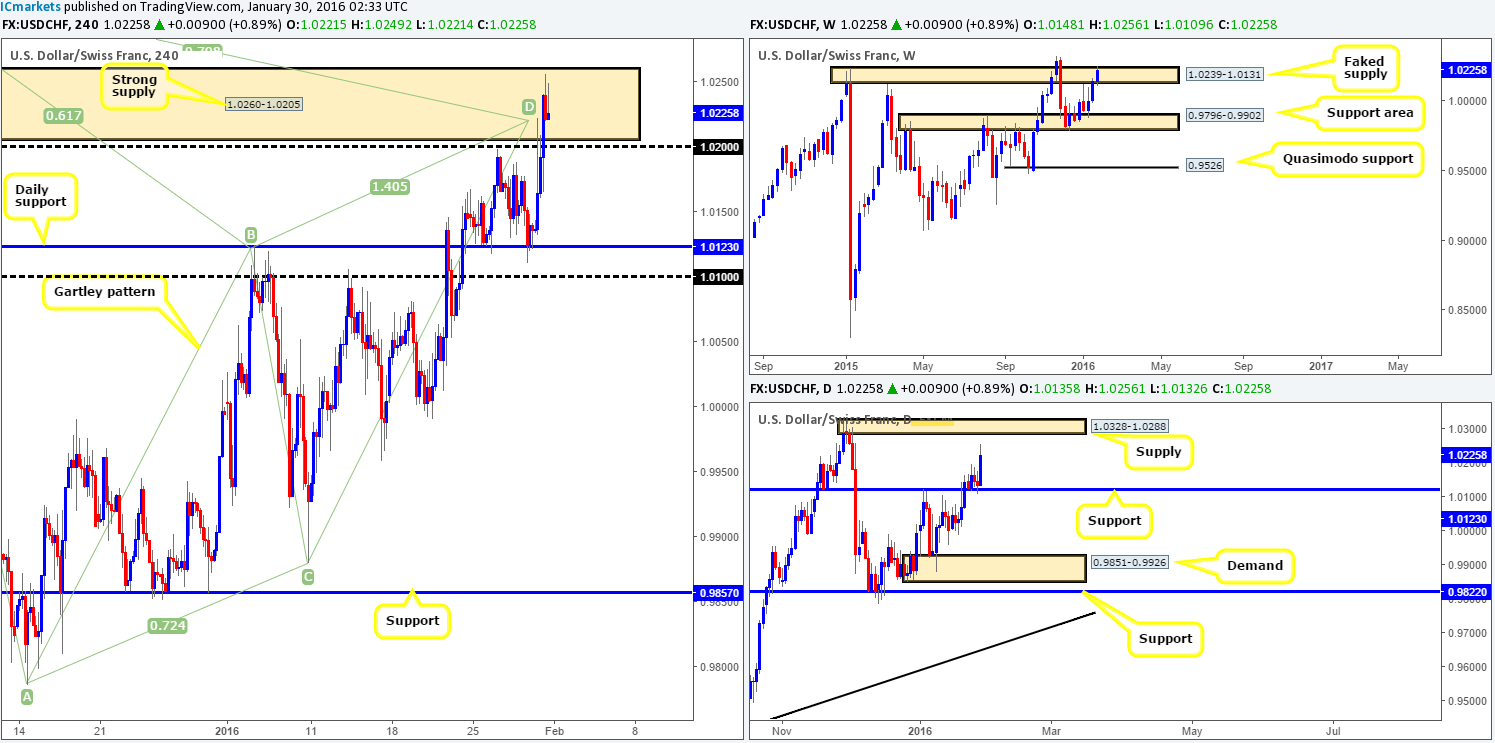
Despite the USD/CHF trading around the underside of a faked supply area on the weekly timeframe at 1.0239-1.0131, further gains of around eighty pips were posted by the week’s close 1.0225. Although price spiked above this weekly area during last week’s rally, it’s still very difficult to judge if offers are consumed until the next weekly candle closes up shop. It will be interesting to see what the lower timeframes have to say on the matter…
Looking at the daily chart, support at 1.0123 provided a very strong floor for this pair over the past week. In addition to this, there’s quite a bit of room for this unit to appreciate this week at least until supply drawn from 1.0328-1.0288. This is certainly not a good sign for the aforementioned faked weekly supply!
Stepping down one more level to the H4 timeframe, however, H4 supply at 1.0260-1.0205 came into play during Friday’s sessions, which, as you can see, was slightly defended into the close. For those who read Friday’s report on this pair (http://www.icmarkets.com/blog/friday-29th-january-daily-technical-outlook-and-review/), you may recall that we placed a pending sell order at 1.0203. Well, at 3.30am GMT our order was filled and price quickly sank over sixty pips, which saw our team move the stop to breakeven. Ten hours later, we were taken out at breakeven, which at the time we were not too pleased about but considering the position of price on the higher timeframes right now, we’re quite happy with the result.
Taking into consideration all of the above points, let’s run through what we have here:
- Weekly area of supply at 1.0239-1.0131 still in play but showing signs of weakness.
- Daily shows room to continue advancing towards supply at 1.0328-1.0288.
- H4 is trading within supply that boasts a H4 Harmonic Gartley pattern completion point between 1.0207/1.0218.
In light of this, we believe it’s still worth keeping a close eye on how the lower timeframes behave within the current H4 supply for possible shorts – preferably on the M30 or M60. A sustained move above this supply, however, is likely an indication that the USD/CHF will test the aforementioned daily supply.
Levels to watch/live orders:
- Buys: Flat (Stop loss: N/A).
- Sells: 1.0260-1.0205 [Tentative – confirmation required] (Stop loss: dependent on where one confirms this area).
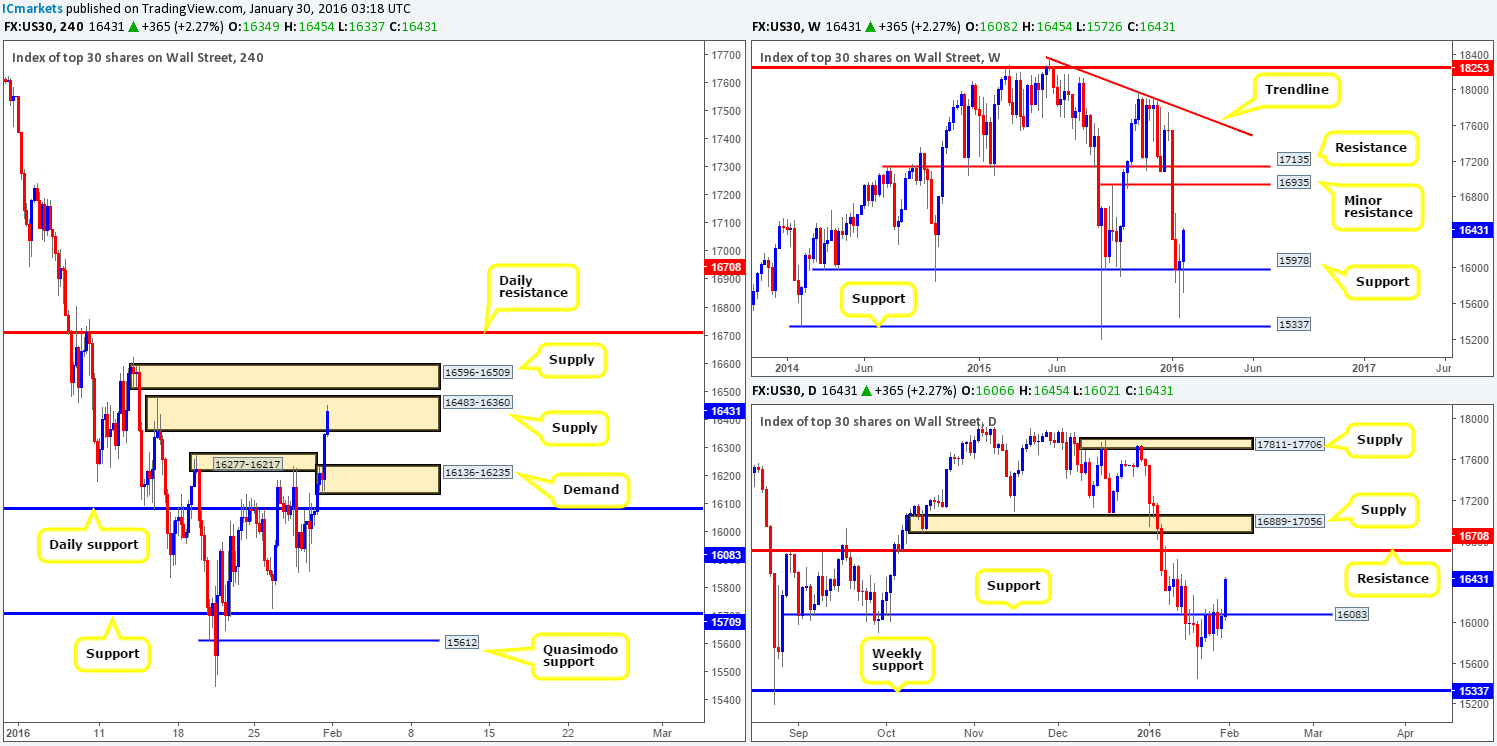
DOW 30:
Following a rather miserable past couple of week for U.S. stocks, the index rebounded around 350 points from weekly support at 15978. As long as the buyers remain dominant here, there appears to be little standing in way to stop prices from challenging the minor weekly resistance level drawn from 16935.
On the other side of the ledger, daily flow remained below resistance at 16083 right up until Friday’s BoJ shenanigans. As can be seen from the chart, price smashed through this resistance and managed to record highs of 16455 on the day. Consequent to this, we’ll be keeping a close eye on the recently breached resistance as it could potentially act as support now, and also on the resistance overhead penciled in at 16708.
The H4 picture on the other hand, shows price ended the day closing within a relatively nice-looking supply zone seen at 16483-16360. Due to what we’re seeing on the higher timeframes at the moment, it’s quite difficult to be confident in this current supply area. However, there is a strong possibility price may correct itself today from Friday’s rally, which could bring prices down into either the jaws of H4 demand at 16136-16235 or daily support lurking just beneath it at 16083.
The way we see it right now is a buy from either of these two barriers has a high probability of holding due to the upside potential being seen on the higher timeframes (see above). What is more, the recent drive into the current H4 supply has very likely consumed a truckload of offers thus weakening this zone and opening up the possibility for a run up to the H4 supply hanging just above it at 16596-16509.
Therefore, the most ideal setup at the time of writing would be a sell-off down to our H4 buy zones, which in turn will allow us to begin looking for confirmed longs into this market, targeting at least the H4 upper supply area mentioned above at 16596-16509, followed closely by daily resistance just above it at 16708.
Levels to watch/live orders:
- Buys: 16136-16235 [Tentative – confirmation required] (Stop loss: dependent on where one confirms this area). 16083 [Tentative – confirmation required] (Stop loss: dependent on where one confirms this level).
- Sells: Flat (Stop loss: N/A).
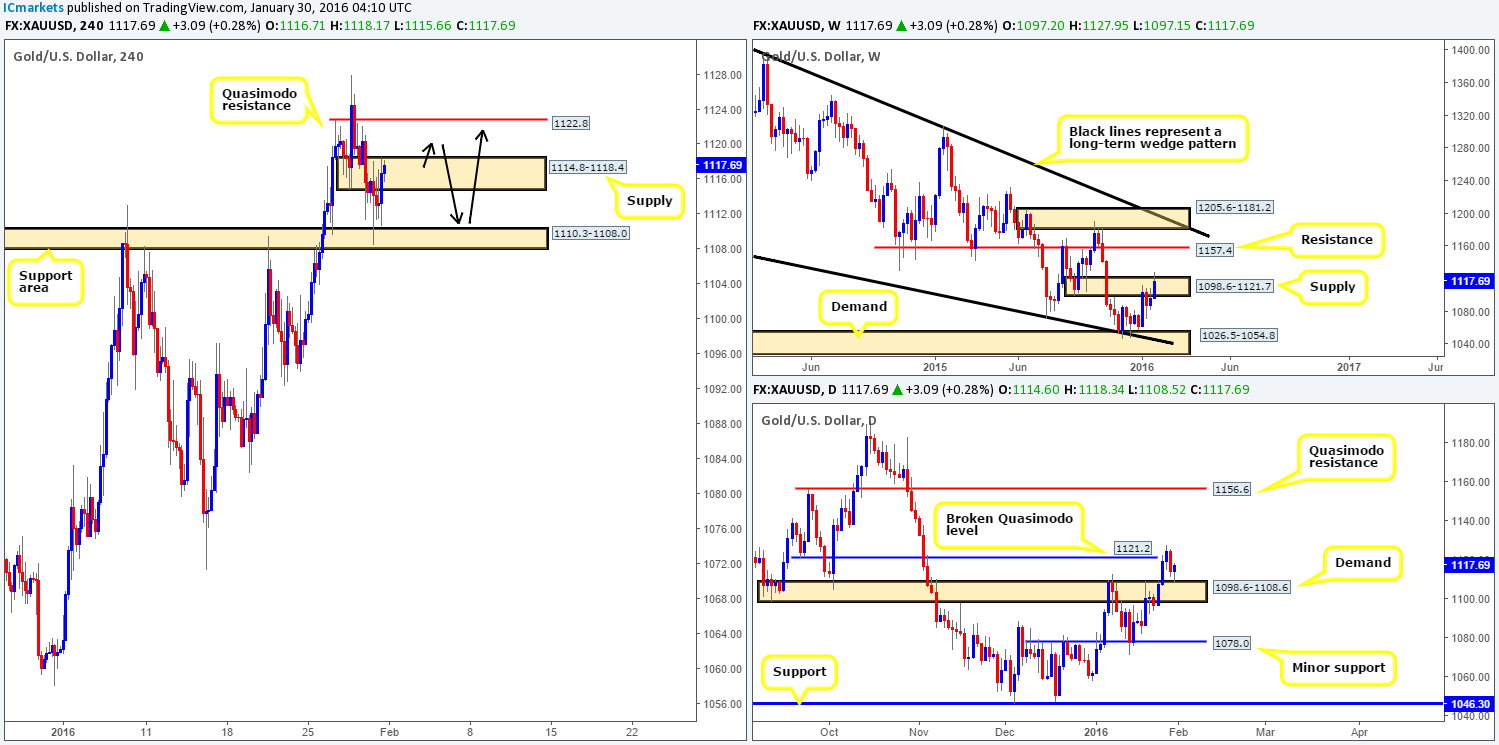
XAU/USD: (Gold)
During the course of last week’s trading, Gold increased over $20 in value by the close 1117.6. This, as you can see, forced price to pierce above weekly supply coming in at 1098.6-1121.7, and has, as a result, potentially opened the path north for further buying this week up to weekly resistance penciled in at 1157.4.
Rolling a page lower to the daily timeframe, however, we can see that Wednesday’s action closed above a broken daily Quasimodo level at 1121.2, which saw Gold pullback and retest the recently broken supply (now demand) at 1098.6-1108.6 on Friday. Judging by the beautiful-looking buying tail seen printed from this area, and the fact that price likely triggered a boatload of stops above weekly supply, our team, at least from a higher- timeframe perspective, are bullish Gold. Upside targets from this region fall in around the Quasimodo resistance level seen at 1156.6.
Down on the H4, Friday’s movement closed the week out deep within H4 supply seen at 1114.8-1118.4, following a bounce from a H4 support area drawn from 1110.3-1108.0. In this case, buying right now is out of the question for us. Before we’d consider attempting to trade with higher-timeframe flow (see above), price would need to close above the current H4 supply (taking out offers from this area) and pullback to the aforementioned H4 support zone, WITHOUT hitting the H4 Quasimodo resistance level above at 1122.8 (as per the black arrows). The reason for why is simply because 1122.8 would be one of our take-profit targets should price trade according to our analysis. Bear in mind, nevertheless, that 1122.8 is only likely going to be the first-take-profit target since as we know from our higher-timeframe analysis (see above in bold), the yellow metal can potentially rally much higher this week.
Levels to watch/live orders:
- Buys: 1110.3-1108.0 [Tentative – confirmation required] (Stop loss: dependent on where one confirms this area).
- Sells: Flat (Stop loss: N/A).


