
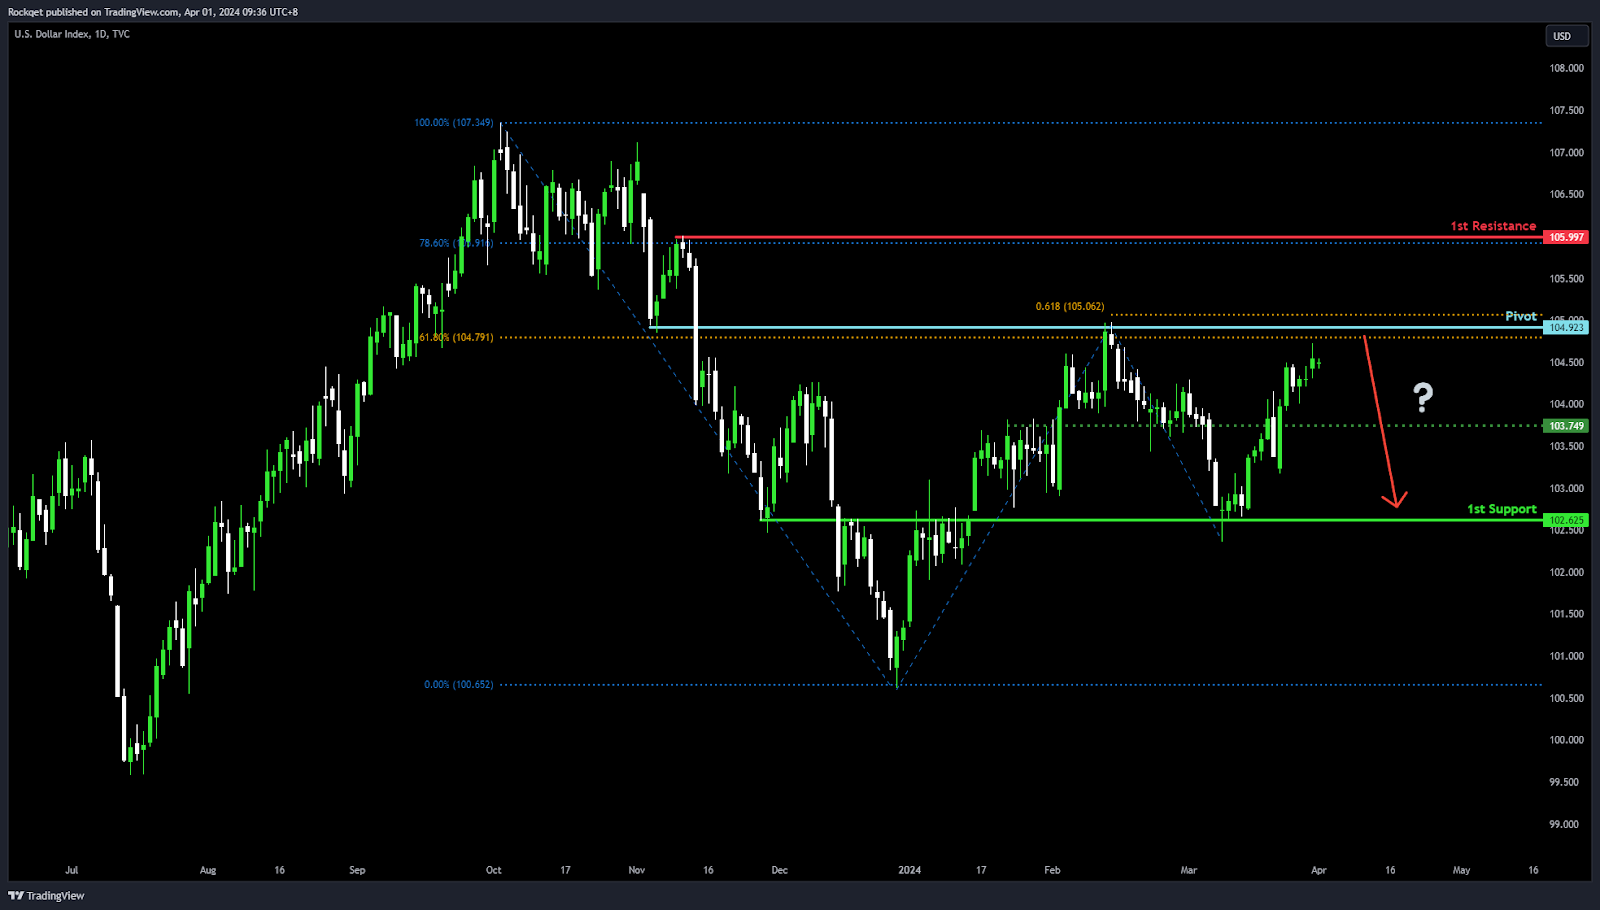
DXY:
Potential Direction: Bearish
Overall momentum of the chart: Bullish
Price could potentially make a bearish reaction off pivot and drop to 1st support
Pivot: 104.92
Supporting reasons: Acts as an Overlap resistance with a 61.80% Fibonacci Retracement and a 61.80% Fibonacci Projection, indicating a significant level of Fibonacci confluence. This suggests a potential turning point where selling pressure might increase, leading to a potential reversal or pullback in the bullish trend.
1st support: 102.62
Supporting reasons: Known as an Overlap support, indicating a strong area where buying interest has historically been present, providing a solid foundation for potential price stabilization or a minor rebound if the bearish movement extends from the pivot point.
1st resistance: 105.99
Supporting reasons: Identified as an Overlap resistance with a 78.60% Fibonacci Retracement, marking a significant barrier that could cap upward movements, highlighting its importance as a critical threshold for bullish attempts to continue the upward momentum.
EUR/USD:
Potential Direction: Bearish
Overall momentum of the chart: Bearish
Price could potentially make a bearish reaction off pivot and drop to 1st support
Pivot: 1.0794
Supporting reasons: Acts as an Overlap resistance, a crucial level that might indicate where selling pressure can intensify, suggesting a potential turning point for the price to continue its downward movement.
1st support: 1.0663
Supporting reasons: Known as overlap support with a 61.80% Fibonacci Projection, indicating a significant area where the market has previously found support, providing a foundation for potential price stabilization or a minor rebound within the bearish trend.
1st resistance: 1.0960
Supporting reasons: Identified as Swing high resistance, marking a significant barrier that could cap upward movements, highlighting its importance as a critical threshold for monitoring bearish momentum within the context of an overall bearish market.
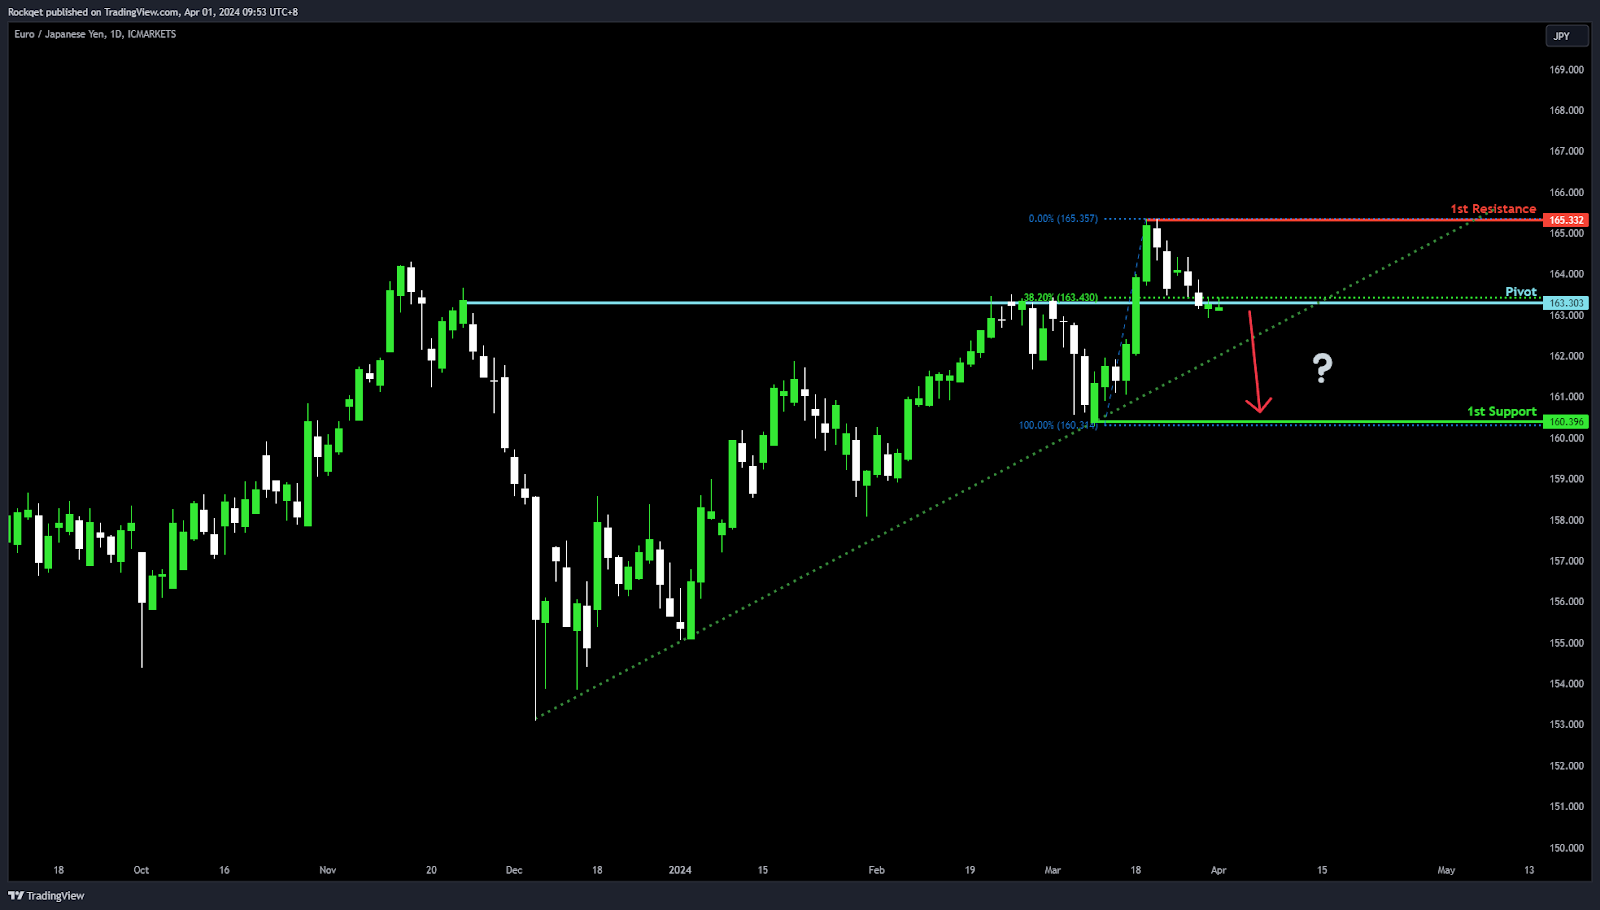
EUR/JPY:
Potential Direction: Bearish
Overall momentum of the chart: Bullish
Factors contributing to the momentum include the price being above a major ascending trend line, suggesting further bullish momentum is likely.
Price could potentially make a bearish reaction off pivot and drop to 1st support
Pivot: 163.30
Supporting reasons: Acts as Pullback resistance, a level where selling pressure could intensify, indicating a potential spot for the price to reverse and move downwards despite the prevailing bullish trend.
1st support: 160.39
Supporting reasons: Known as Swing low support, suggesting a significant area where the market has previously found strong buying interest, providing a foundation for potential price stabilization or a rebound within the context of a bearish move.
1st resistance: 165.33
Supporting reasons: Identified as Swing high resistance, marking a significant barrier that has previously capped upward movements.
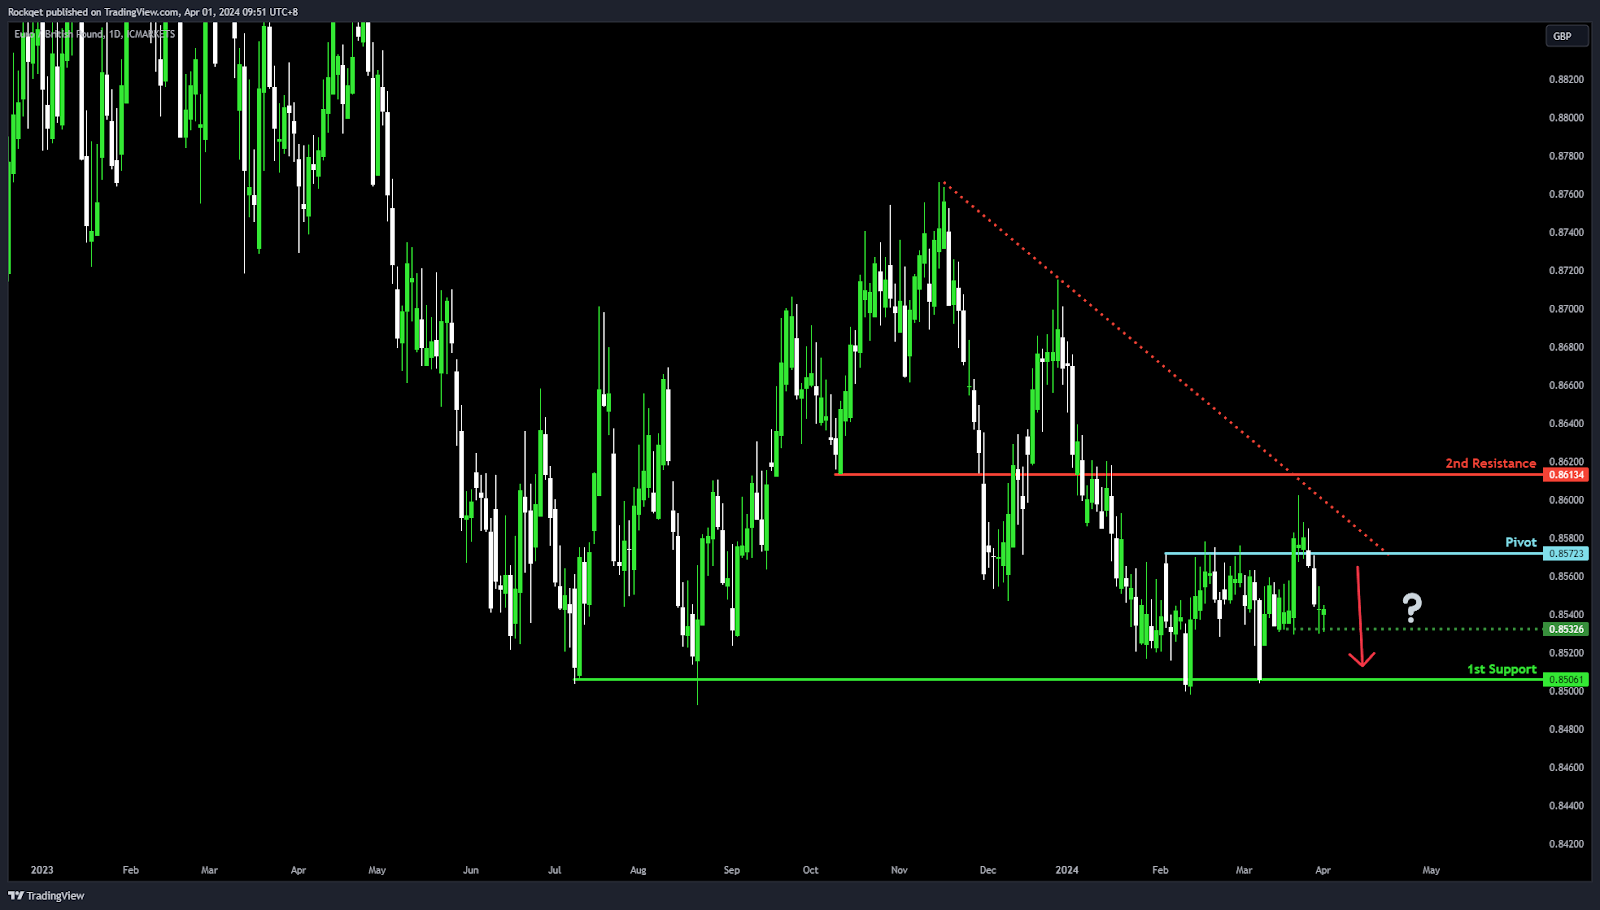
EUR/GBP:
Potential Direction: Bearish
Overall momentum of the chart: Bearish
Price could potentially make a bearish continuation towards 1st support
Pivot: 0.8572
Supporting reasons: Acts as an Overlap resistance, indicating a key level where selling pressure might increase, suggesting a potential turning point for the price to continue its downward movement.
1st support: 0.8506
Supporting reasons: Known as Multi-swing low support, suggesting a significant area where the market has previously found strong buying interest, providing a foundation for potential price stabilization or a rebound within the context of a bearish move.
1st resistance: 0.8613
Supporting reasons: Identified as an Overlap resistance, marking a significant barrier that has previously capped upward movements.
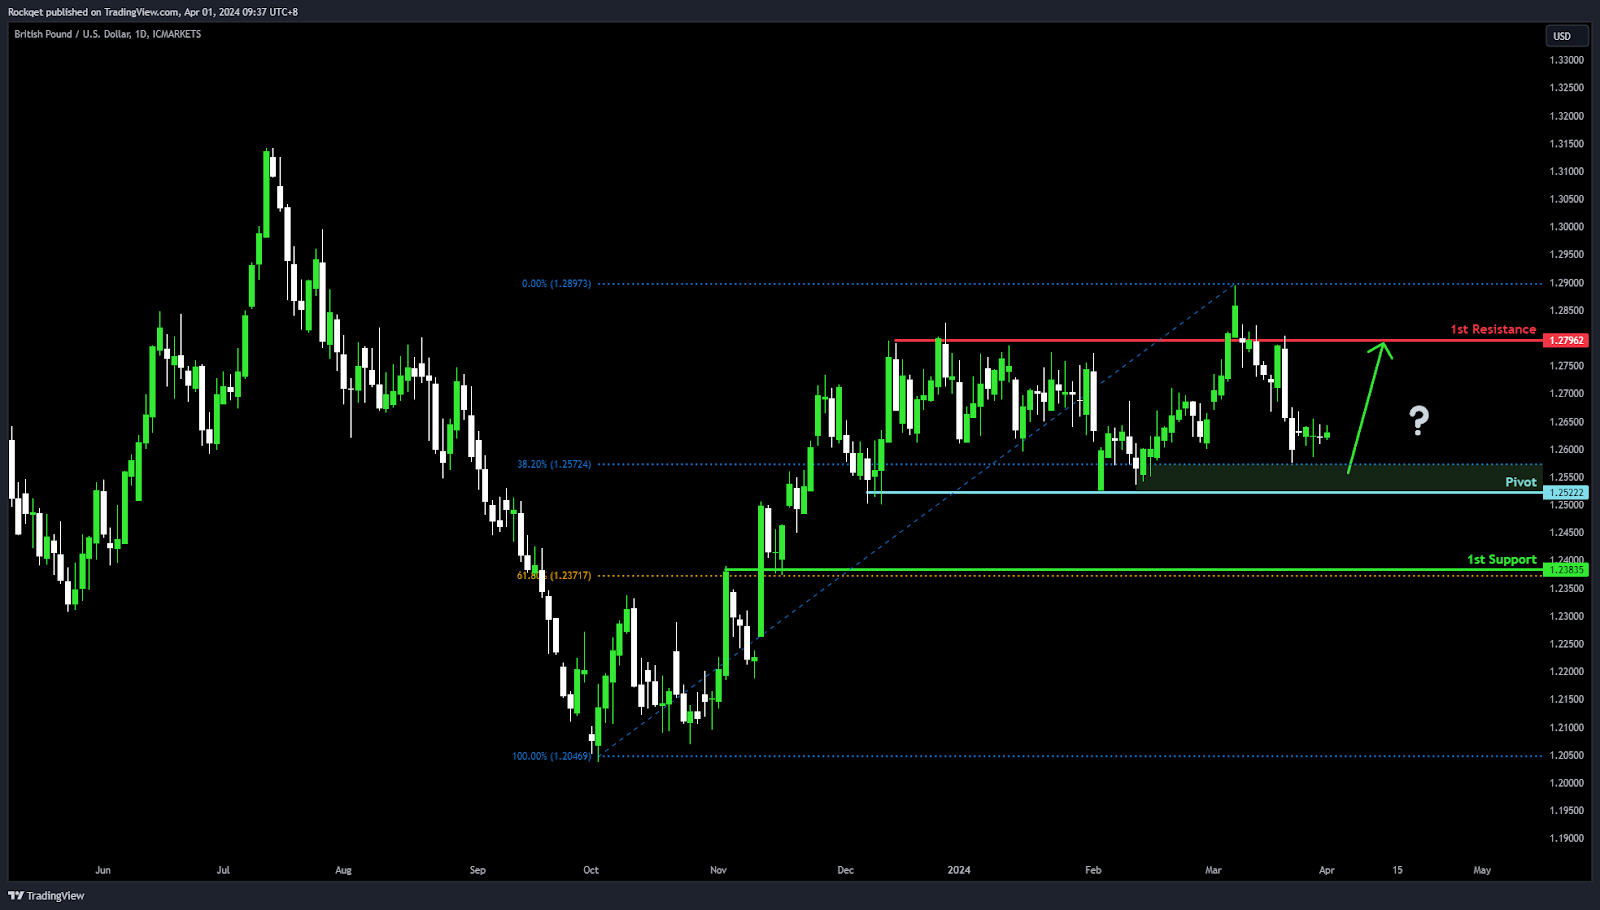
GBP/USD:
Potential Direction: Bullish
Overall momentum of the chart: Neutral
Price could potentially make a bullish bounce off pivot and head toward 1st resistance
Pivot: 1.2522
Supporting reasons: Acts as an Overlap support with a 38.20% Fibonacci Retracement, indicating a key level where buying interest could intensify, suggesting a solid foundation for a potential upward movement.
1st support: 1.2383
Supporting reasons: Known as an Overlap support with a 61.80% Fibonacci Retracement, suggesting a significant area where the market has previously found strong buying support, providing a deeper layer of potential price stabilization or a rebound within a bullish context.
1st resistance: 1.2796
Supporting reasons: Identified as Multi-swing high resistance, marking a significant barrier that has capped previous upward movements.
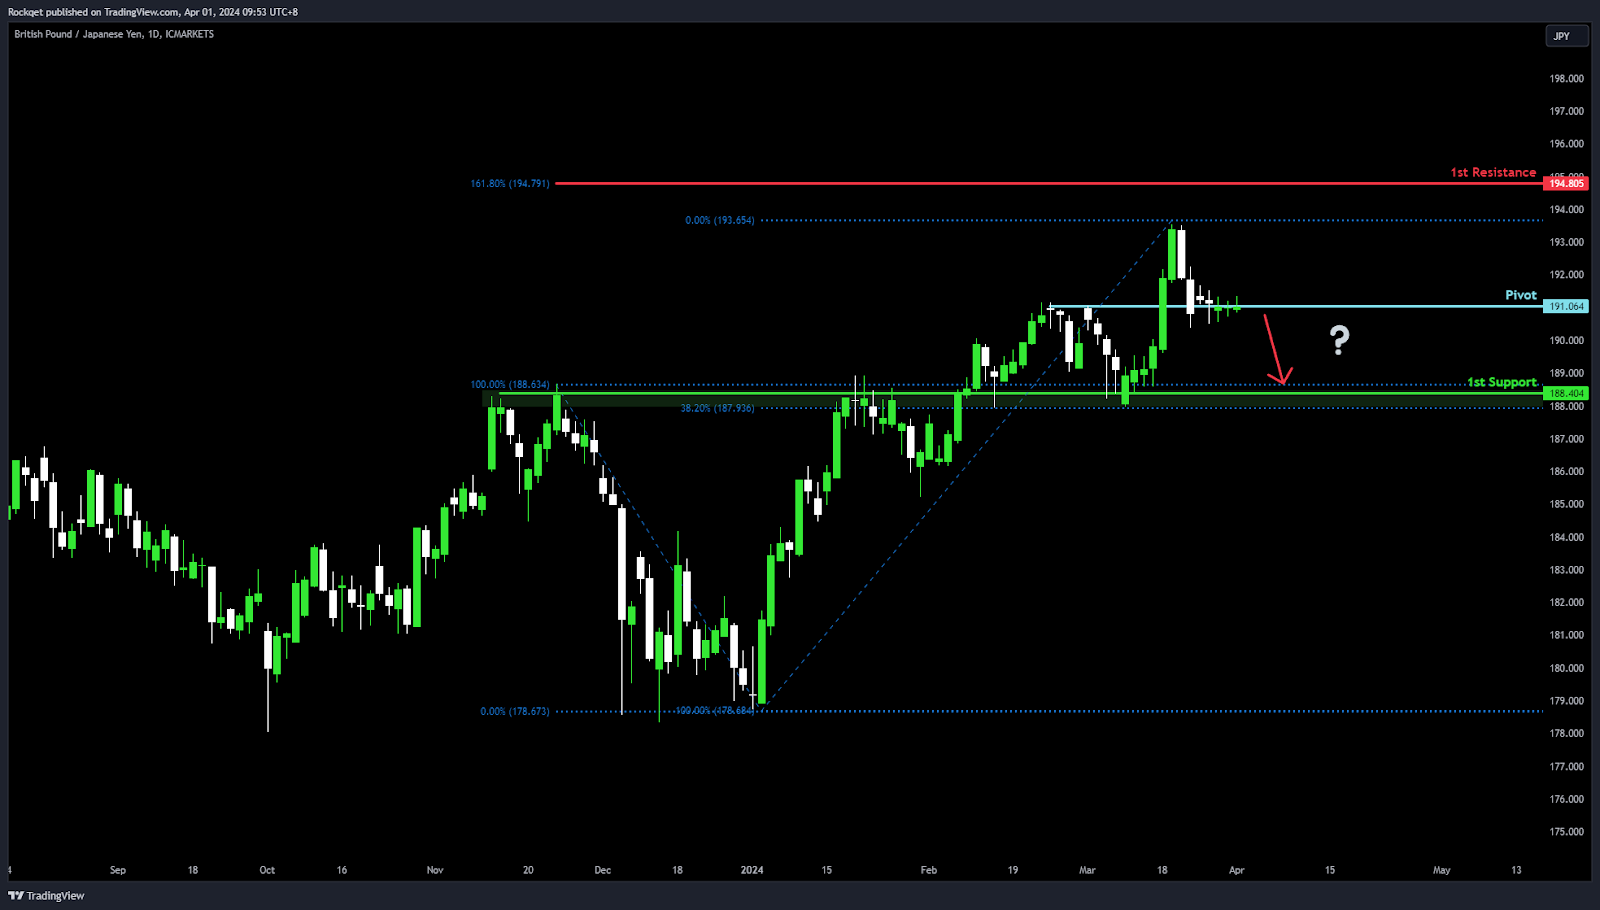
GBP/JPY:
Potential Direction: Bearish
Overall momentum of the chart: Bullish
Price could potentially make a bearish reaction off pivot and drop to 1st support
Pivot: 191.06
Supporting reasons: Acts as an Overlap resistance, a critical level where selling pressure might intensify, indicating a potential spot for the price to reverse and move downwards despite the prevailing bullish trend.
1st support: 188.40
Supporting reasons: Known as an Overlap support, suggesting a significant area where the market has previously found strong buying interest, providing a foundation for potential price stabilization or a rebound within the context of a bearish move.
1st resistance: 194.80
Supporting reasons: Marked by a 161.80% Fibonacci Extension, indicating a significant barrier that could cap upward movements.
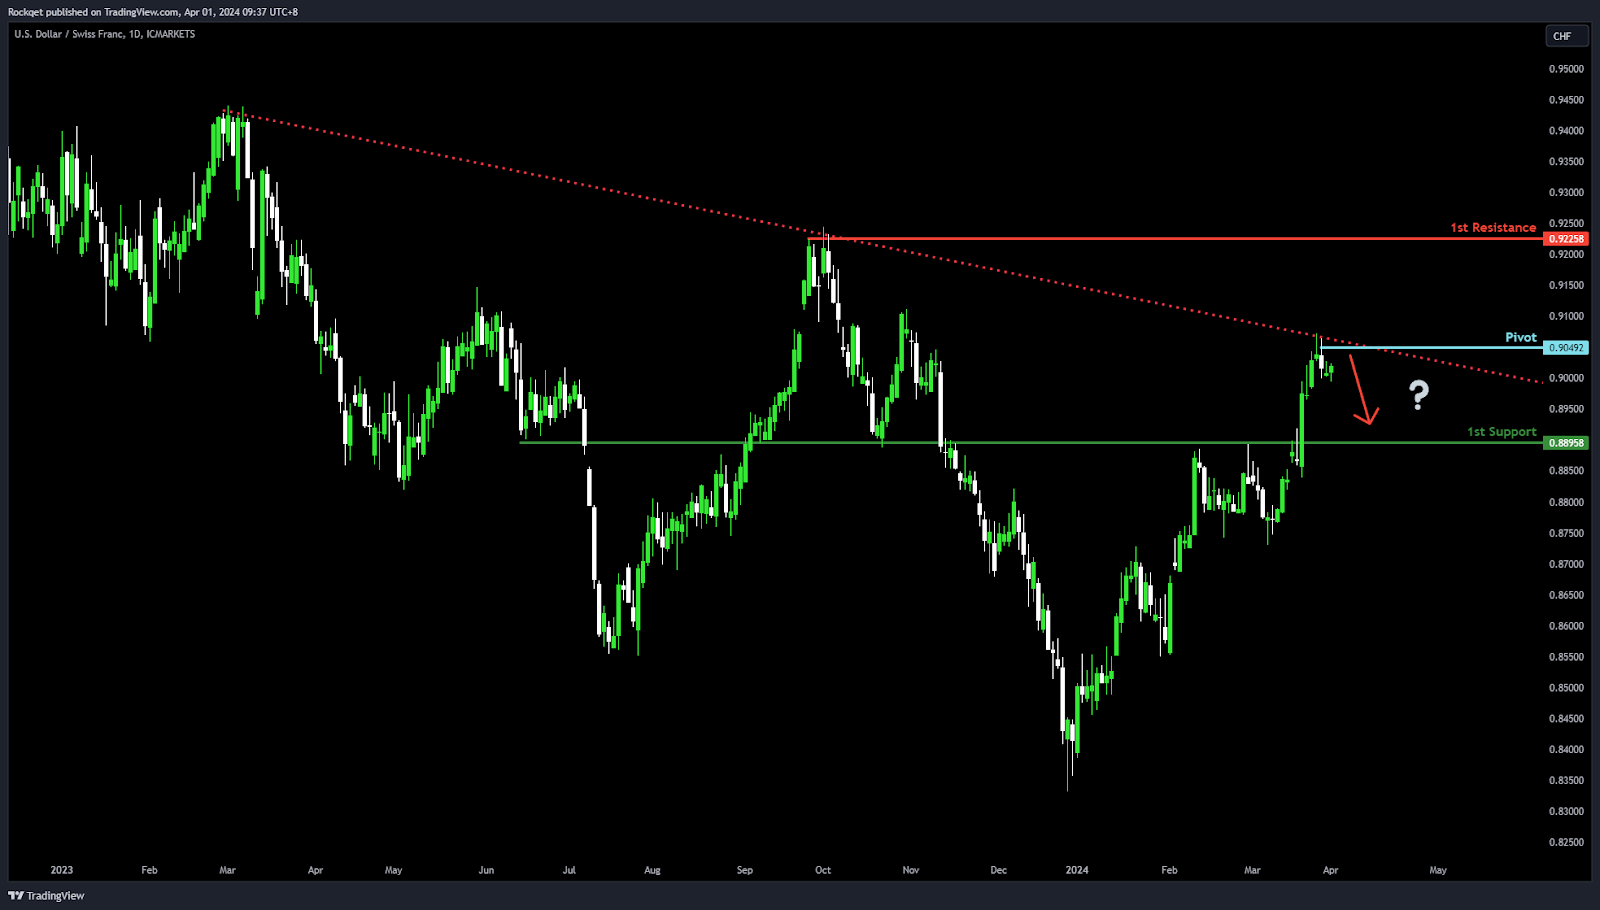
USD/CHF:
Potential Direction: Bearish
Overall momentum of the chart: Bearish
Price could potentially make a: Bearish reaction off pivot and drop to 1st support
Pivot: 0.9049
Supporting reasons: Acts as Multi-swing high resistance, indicating a critical level where selling pressure could intensify, suggesting a potential turning point for the price to continue its downward movement.
1st support: 0.8895
Supporting reasons: Known as Pullback support, suggesting a significant area where the market has previously found support, providing a foundation for potential price stabilization or a minor rebound within the bearish trend.
1st resistance: 0.9225
Supporting reasons: Identified as Multi-swing high resistance, marking a significant barrier that has capped previous upward movements. This indicates a crucial threshold for monitoring bearish momentum, reinforcing the bearish outlook in the context of an overall bearish market
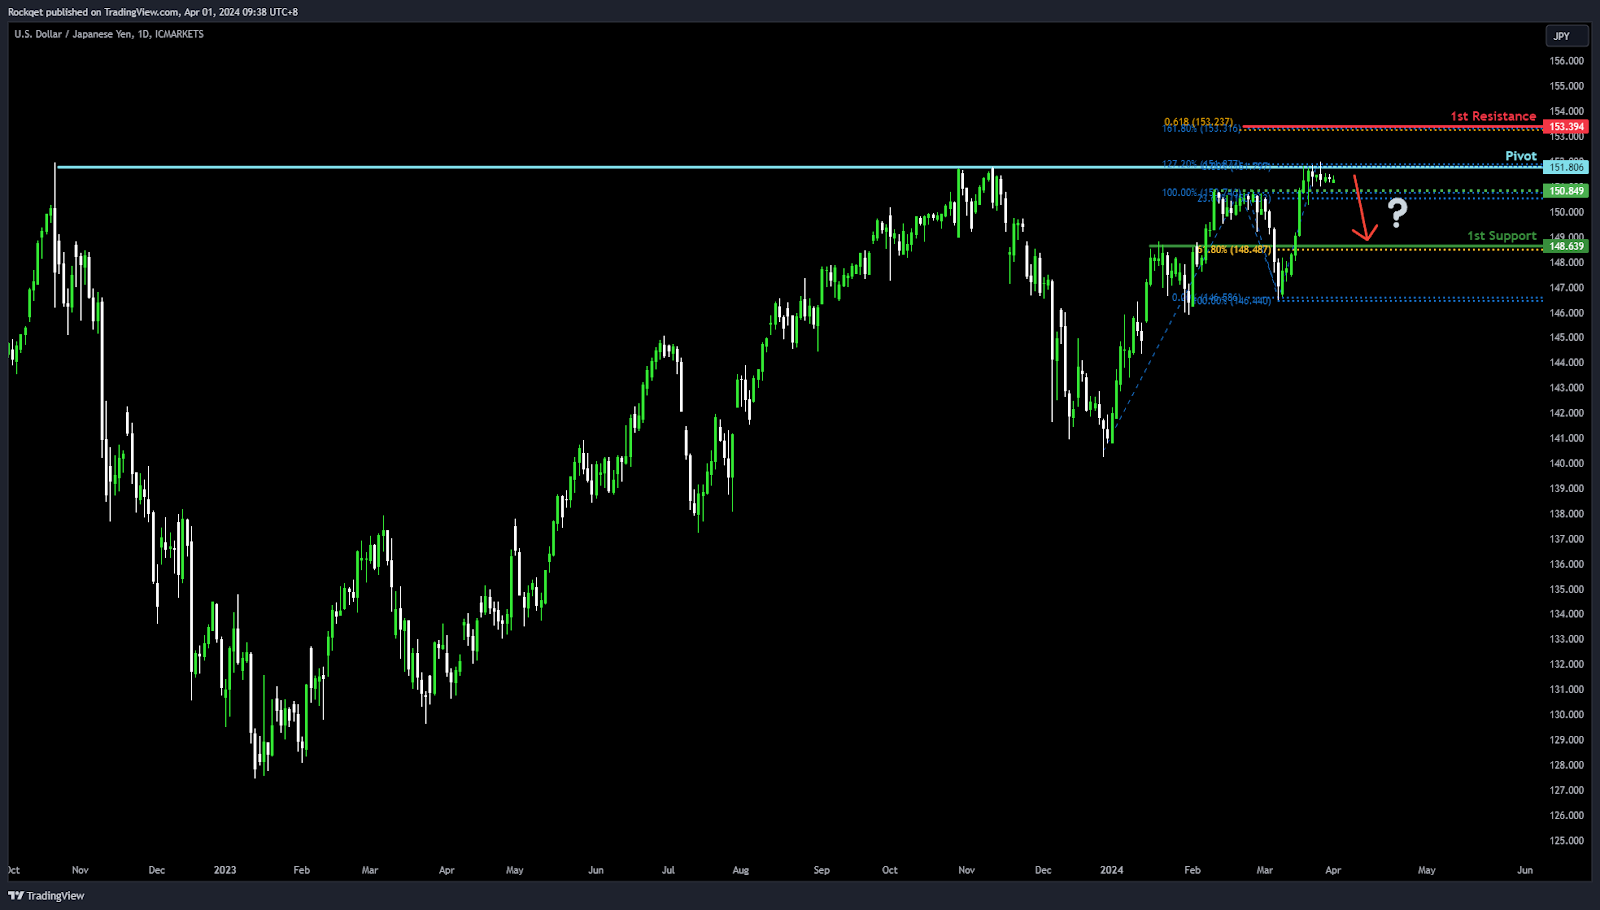
USD/JPY:
Potential Direction: Bearish
Overall momentum of the chart: Bullish
Price could potentially make a: Bearish reaction off pivot and drop to 1st support
Pivot: 151.80
Supporting reasons: Identified as Multi-swing high resistance with a 127.20% Fibonacci Extension, marking a significant level where selling pressure could intensify, suggesting a potential reversal point for the price to continue its downward movement within the context of an overall bullish trend.
1st support: 148.63
Supporting reasons: Acts as Pullback support with a 61.80% Fibonacci Retracement, indicating a critical area where the market has previously found support, providing a foundation for potential price stabilization or a minor rebound.
1st resistance: 153.39
Supporting reasons: Characterized by a 161.80% Fibonacci Extension and a 61.80% Fibonacci Projection, indicating a significant level of Fibonacci confluence. This confluence acts as a strong technical indicator that the price might target, underscoring its importance for the bearish momentum.
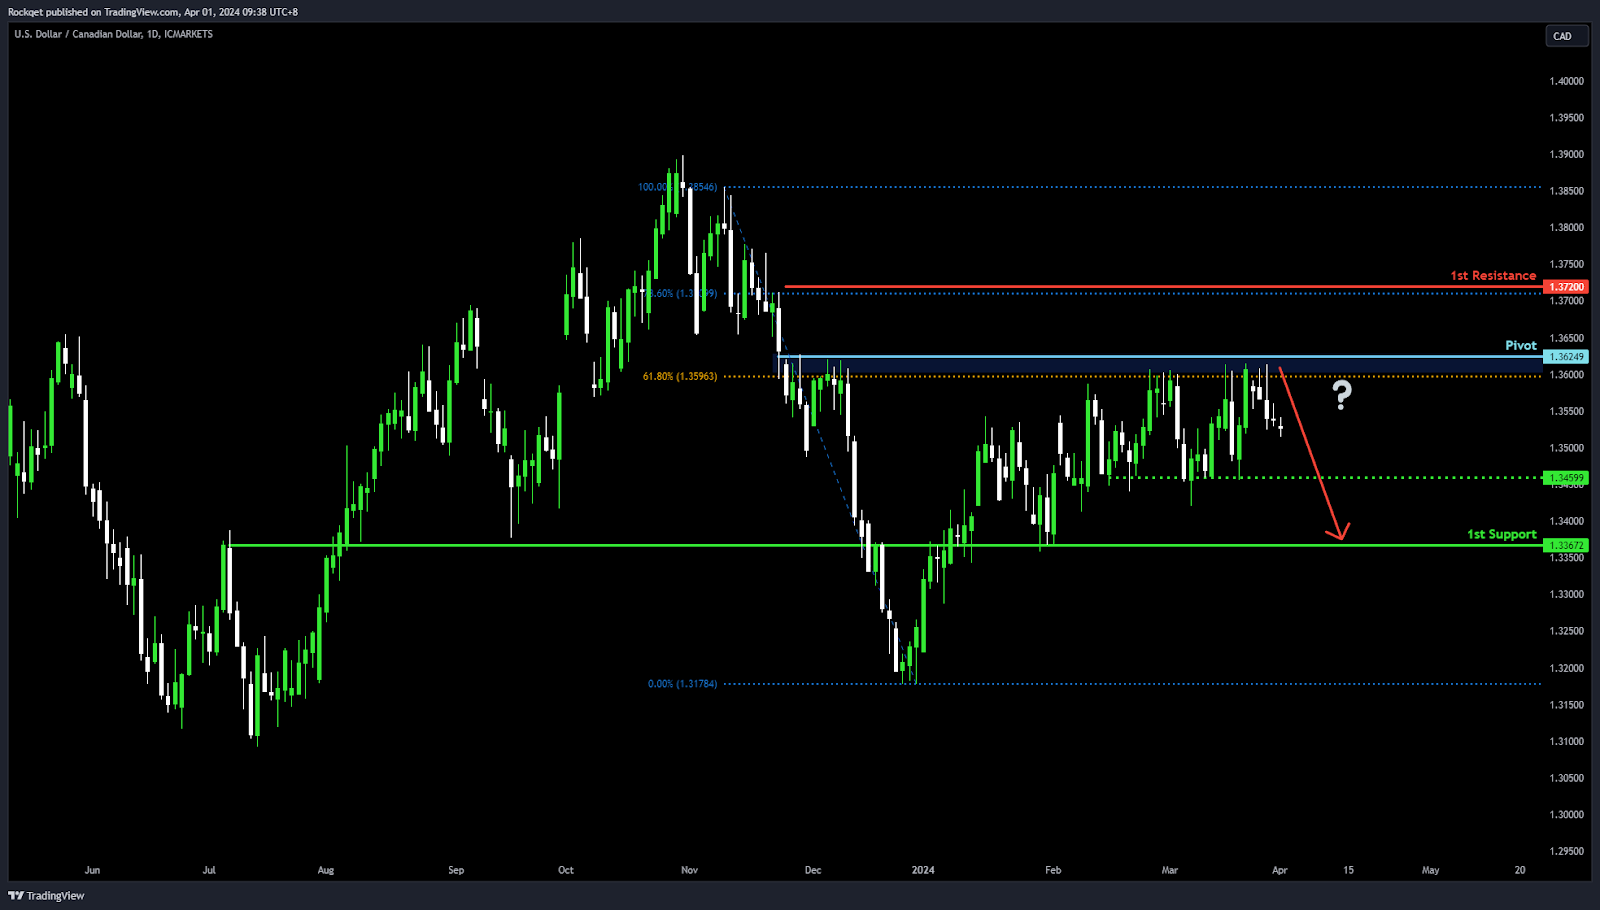
USD/CAD:
Potential Direction: Bearish
Overall momentum of the chart: Neutral
Price could potentially make a bearish reaction off pivot and drop to 1st support
Pivot: 1.3624
Supporting reasons: Acts as an Overlap resistance with a 61.80% Fibonacci Retracement, indicating a key level where selling pressure might intensify, suggesting a potential turning point for the price to reverse and move downwards.
1st support: 1.3367
Supporting reasons: Known as an Overlap support, suggesting a significant area where the market has previously found strong buying interest, providing a foundation for potential price stabilization or a rebound within the context of a bearish move.
1st resistance: 1.3720
Supporting reasons: Identified as Pullback resistance with a 78.60% Fibonacci Retracement, marking a significant barrier that could cap upward movements
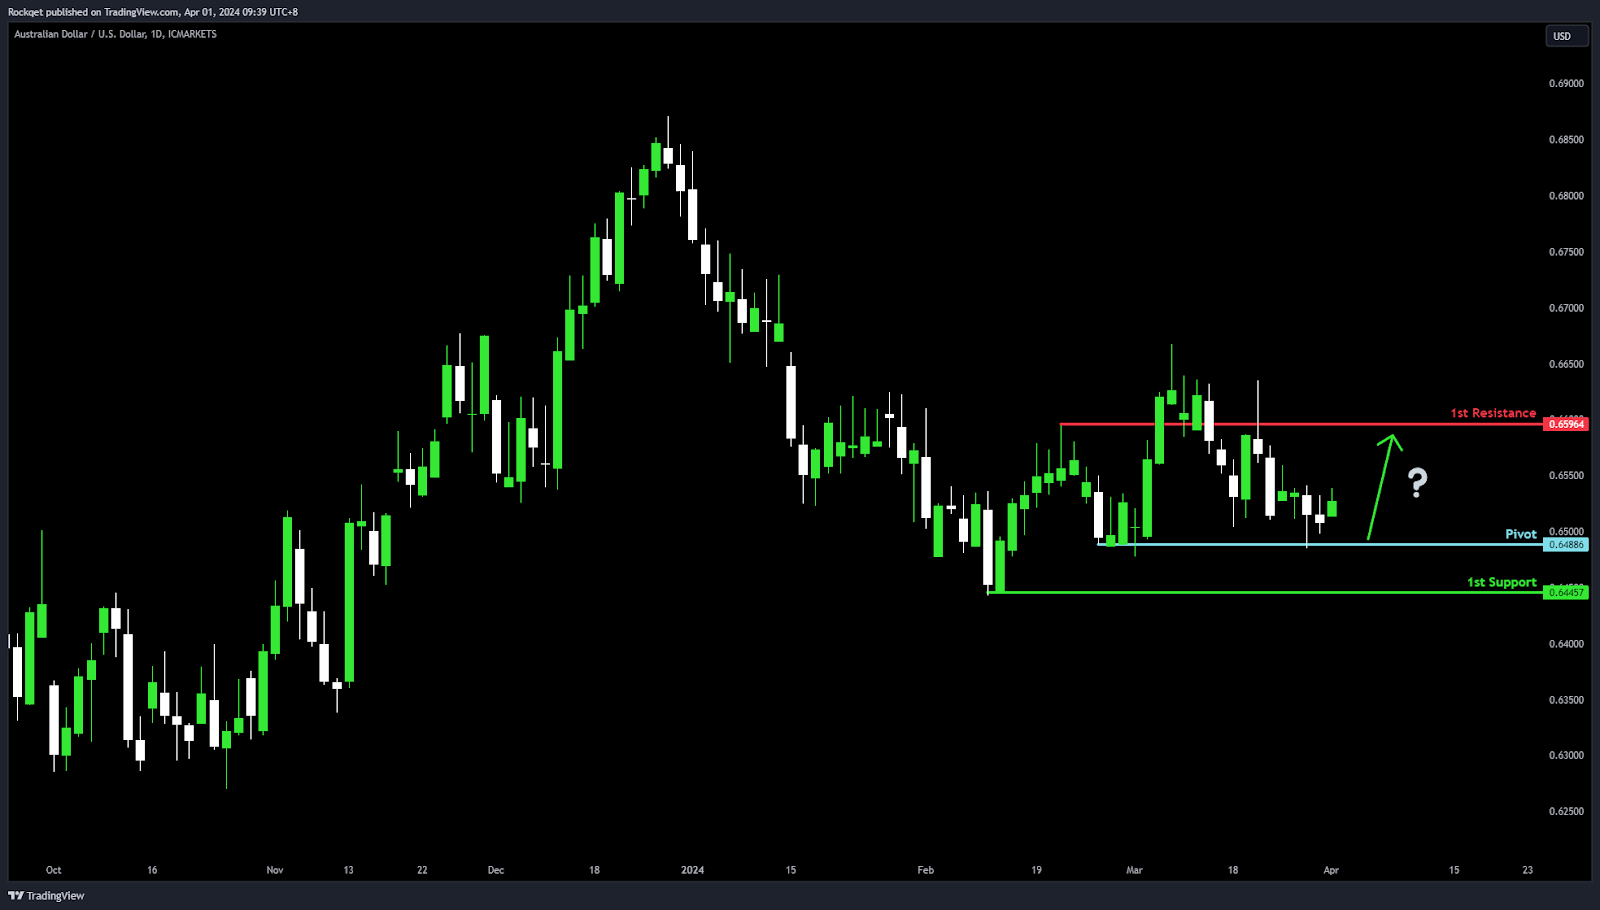
AUD/USD:
Potential Direction: Bullish
Overall momentum of the chart: Neutral
Price could potentially make a bullish bounce-off pivot and head toward 1st resistance
Pivot: 0.6488
Supporting reasons: Acts as Multi-swing low support, indicating a key level where buying interest has historically been strong, suggesting a solid foundation for a potential upward movement.
1st support: 0.6445
Supporting reasons: Known as Swing low support, suggesting a significant area where the market has previously found support, providing a basis for potential price stabilization or a minor rebound within the bullish context.
1st resistance: 0.6596
Supporting reasons: Identified as an Overlap resistance, marking a significant barrier that has previously capped upward movements.
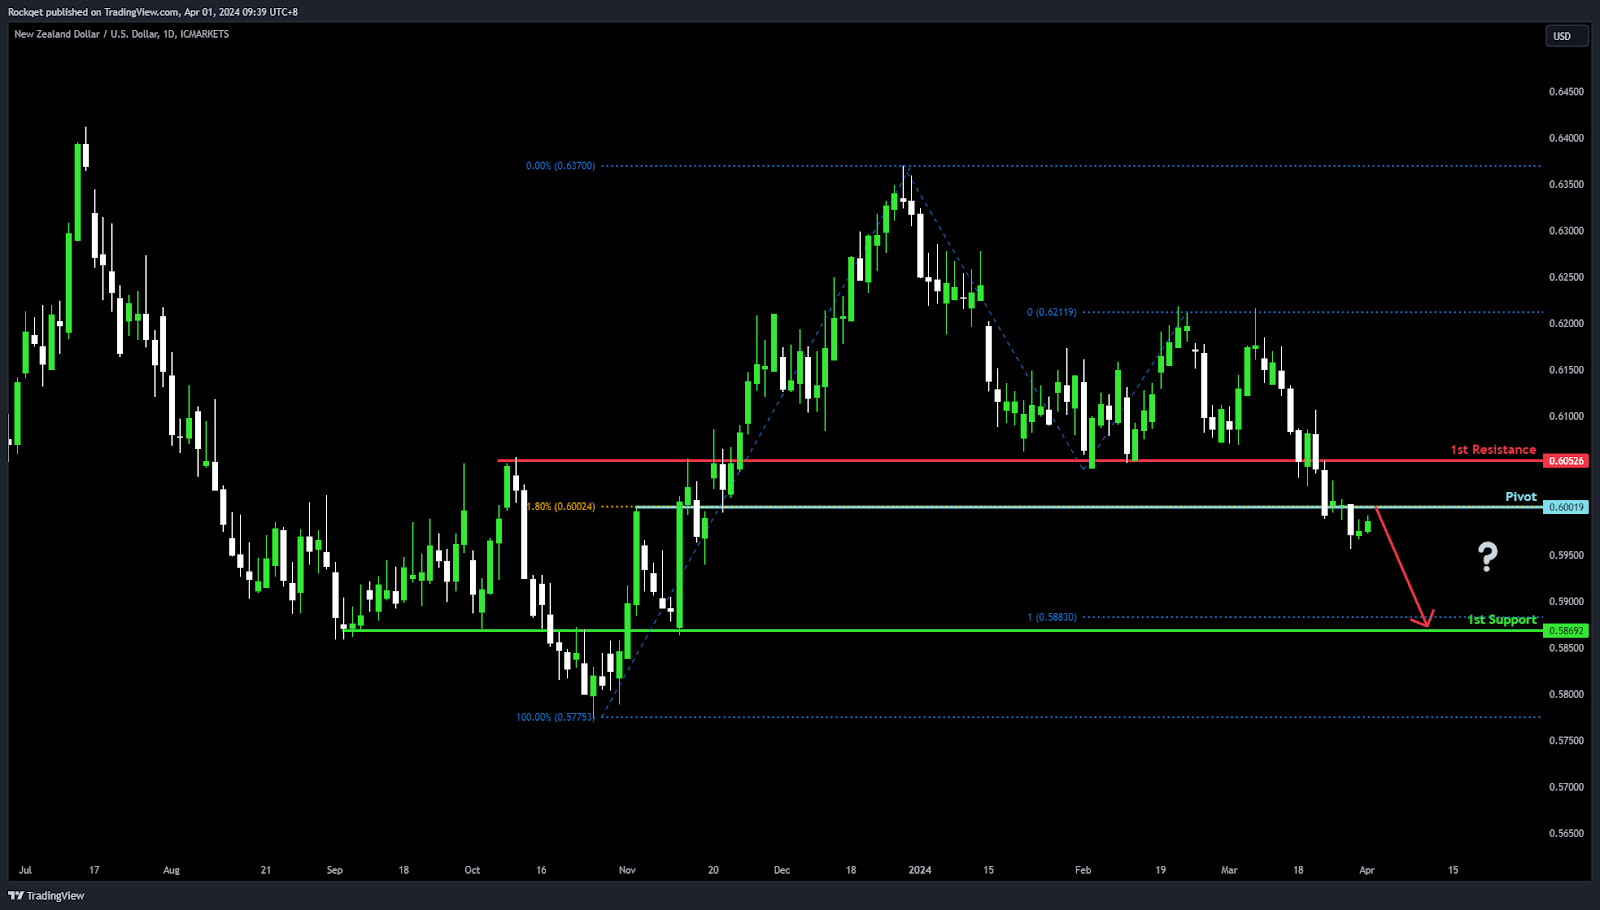
NZD/USD
Potential Direction: Bearish
Overall momentum of the chart: Bearish
Price could potentially make a: Bearish reaction off pivot and drop to 1st support
Pivot: 0.6001
Supporting reasons: Acts as Pullback resistance with a 61.80% Fibonacci Retracement, indicating a key level where selling pressure might intensify, suggesting a potential turning point for the price to reverse and move downwards.
1st support: 0.5869
Supporting reasons: Known as an Overlap support, suggesting a significant area where the market has previously found strong buying interest, providing a foundation for potential price stabilization or a minor rebound within the bearish context.
1st resistance: 0.6052
Supporting reasons: Identified as Pullback resistance, marking a significant barrier that could cap upward movements.
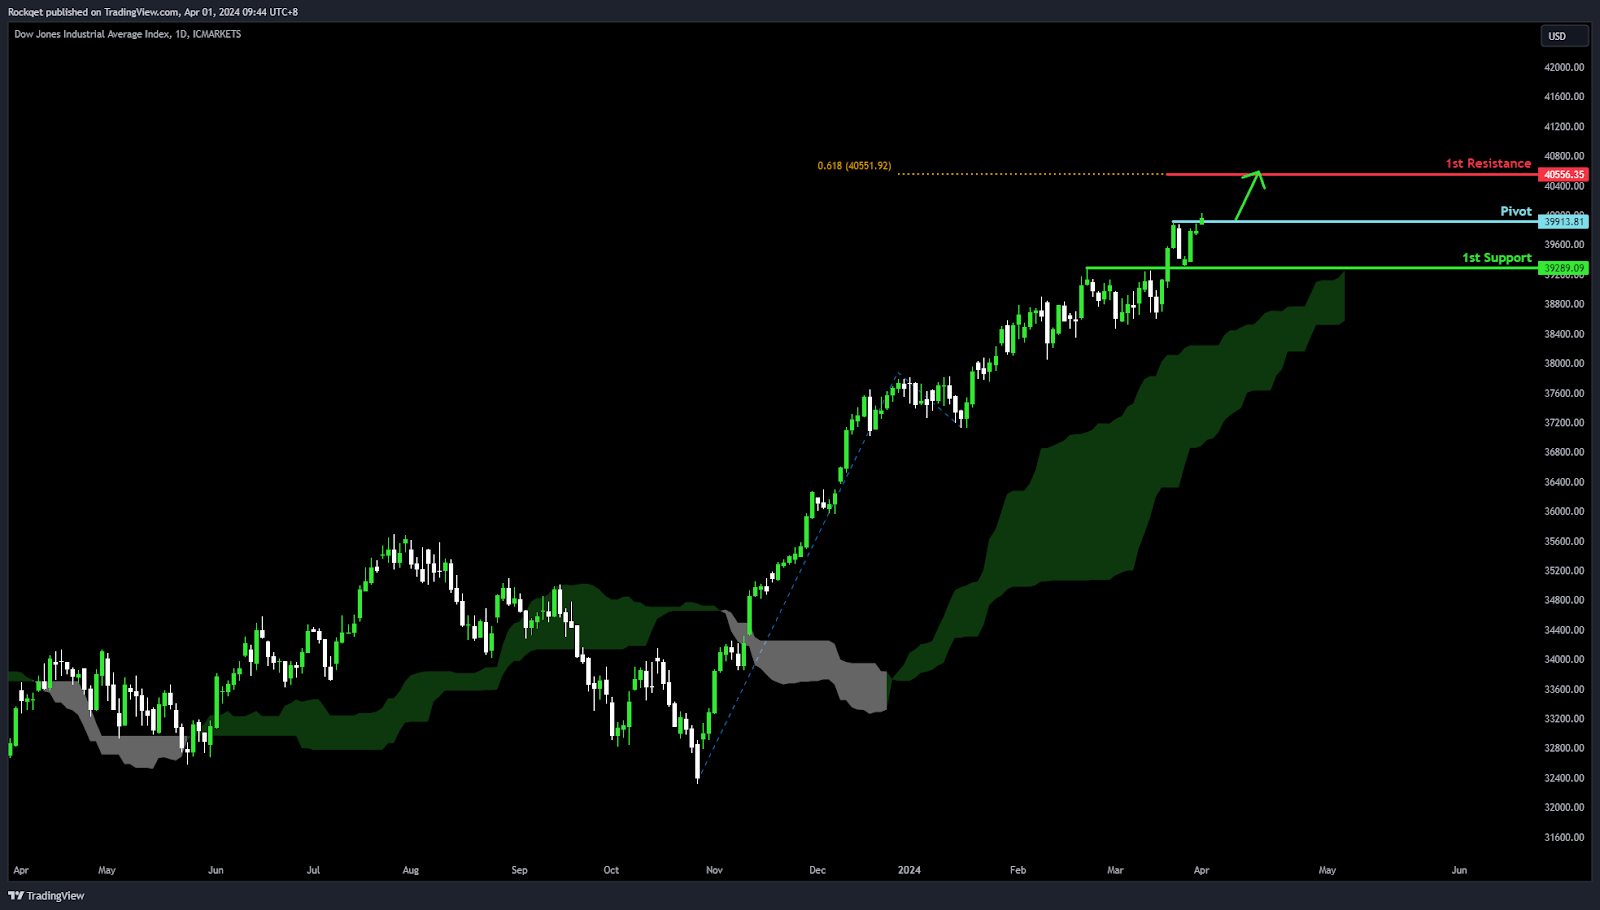
DJ30:
Potential Direction: Bullish
Overall momentum of the chart: Bullish
Factors contributing to the momentum include the price being above the bullish Ichimoku cloud, indicating strong upward momentum and a positive outlook for the market.
Price could potentially make a: Bullish break through of pivot and rise to 1st resistance
Pivot: 39913.81
Supporting reasons: Identified as Swing high resistance, a critical level that, once breached, could indicate strong buying pressure and a continuation of the bullish trend.
1st support: 39289.09
Supporting reasons: Acts as an Overlap support, suggesting a significant area where the market has previously found strong buying interest, providing a solid foundation for potential price stabilization or a rebound in the event of a pullback.
1st resistance: 40556.35
Supporting reasons: Marked by a 61.80% Fibonacci Projection, indicating a significant barrier that could cap upward movements.
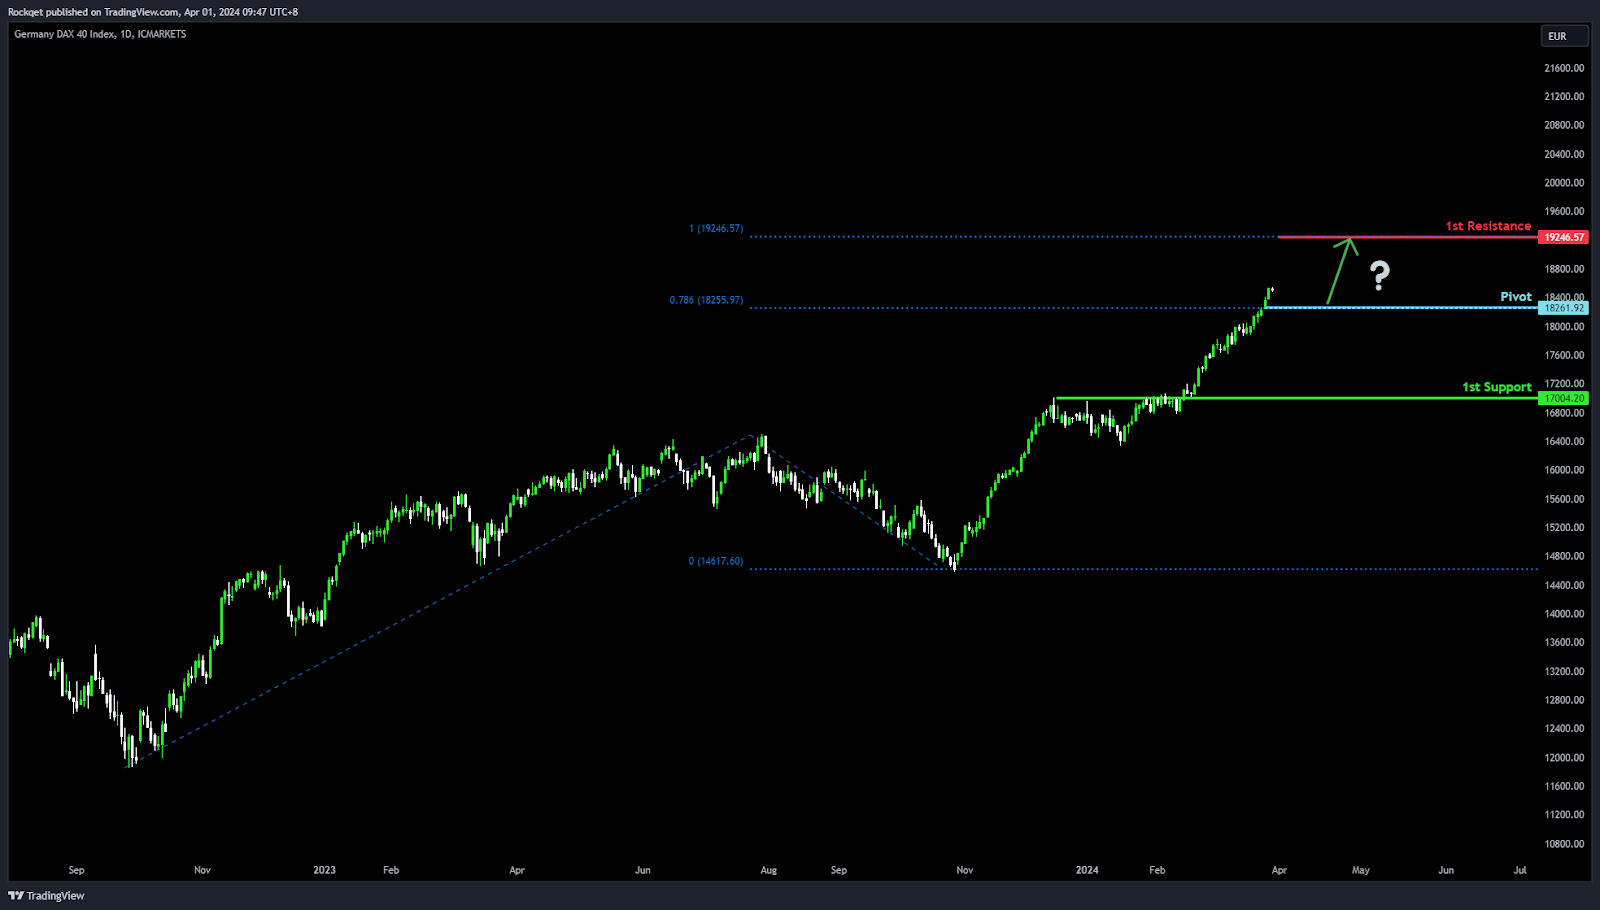
GER40:
Potential Direction: Bullish
Overall momentum of the chart: Bullish
Price could potentially make a: Bullish break through of pivot and rise to 1st resistance
Pivot: 18261.92
Supporting reasons: Identified as Swing high resistance, a critical level that, once breached, could signify strong buying pressure and a continuation of the bullish trend.
1st support: 17004.20
Supporting reasons: Acts as an Overlap support, suggesting a significant area where the market has previously found strong buying interest, providing a solid foundation for potential price stabilization or a rebound in the event of a pullback.
1st resistance: 19246.57
Supporting reasons: Marked by a 100% Fibonacci Projection, indicating a significant barrier that could cap upward movements. Overcoming this level would underscore the strength of the bullish momentum, highlighting its importance as a target for the bullish trend continuation.
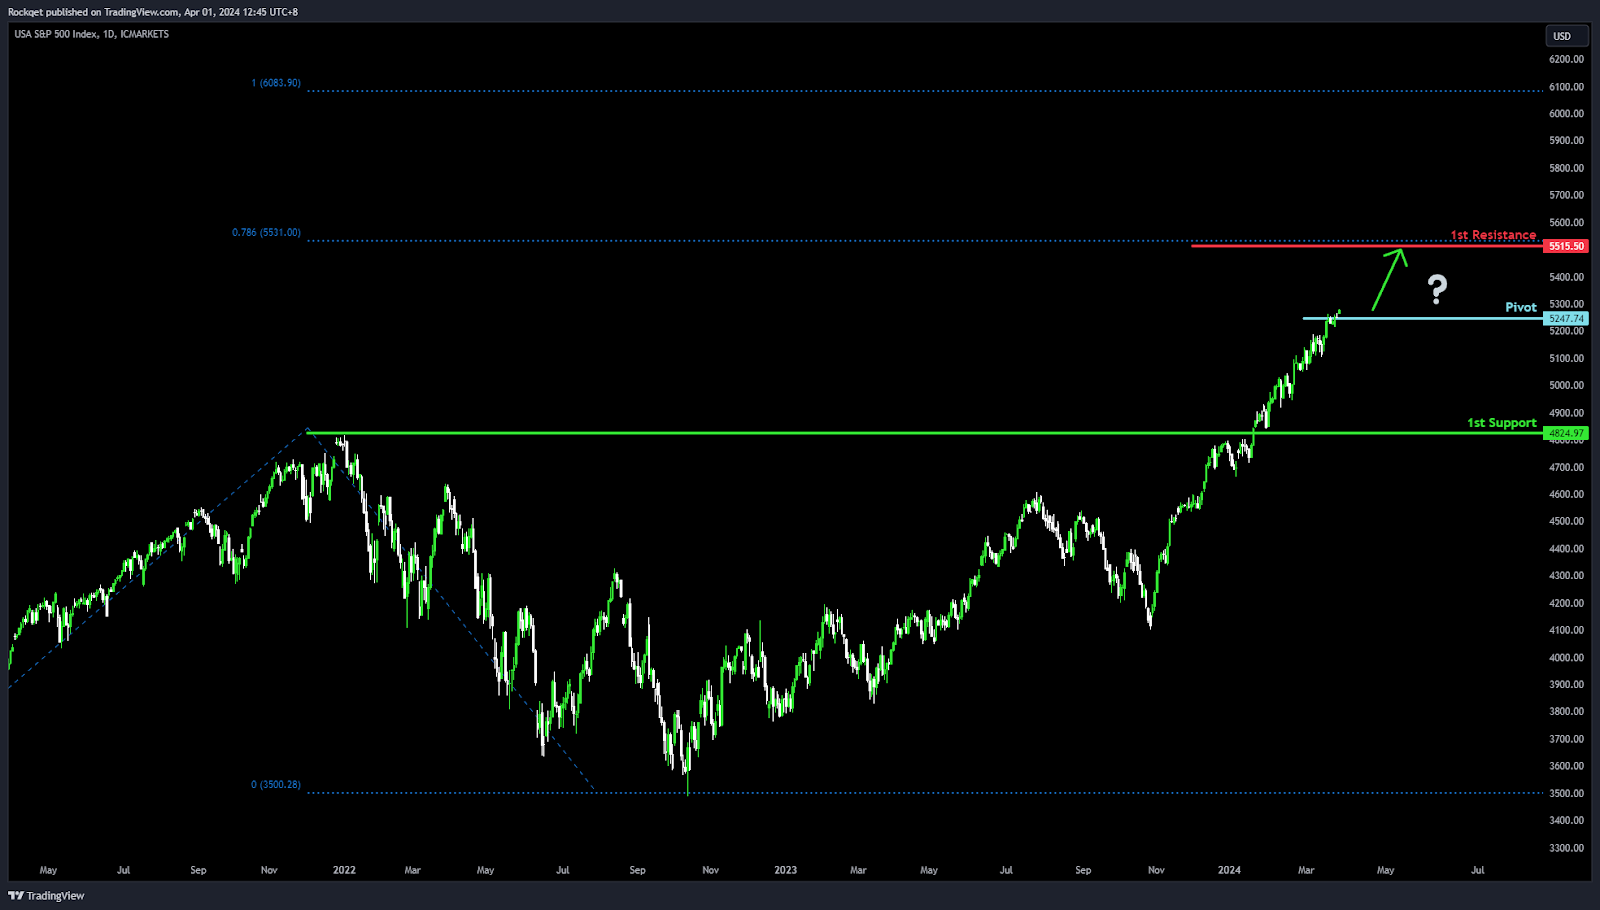
US500:
Potential Direction: Bullish
Overall momentum of the chart: Bullish
Price could potentially make a: Bullish break through of pivot and rise to 1st resistance
Pivot: 5247.74
Supporting reasons: Identified as Swing high resistance, a critical level that, once breached, could signify strong buying pressure and a continuation of the bullish trend.
1st support: 4824.97
Supporting reasons: Acts as an Overlap support, suggesting a significant area where the market has previously found strong buying interest, providing a solid foundation for potential price stabilization or a rebound in the event of a pullback.
1st resistance: 5515.50
Supporting reasons: Marked by a 78.60% Fibonacci Projection, indicating a significant barrier that could cap upward movements.
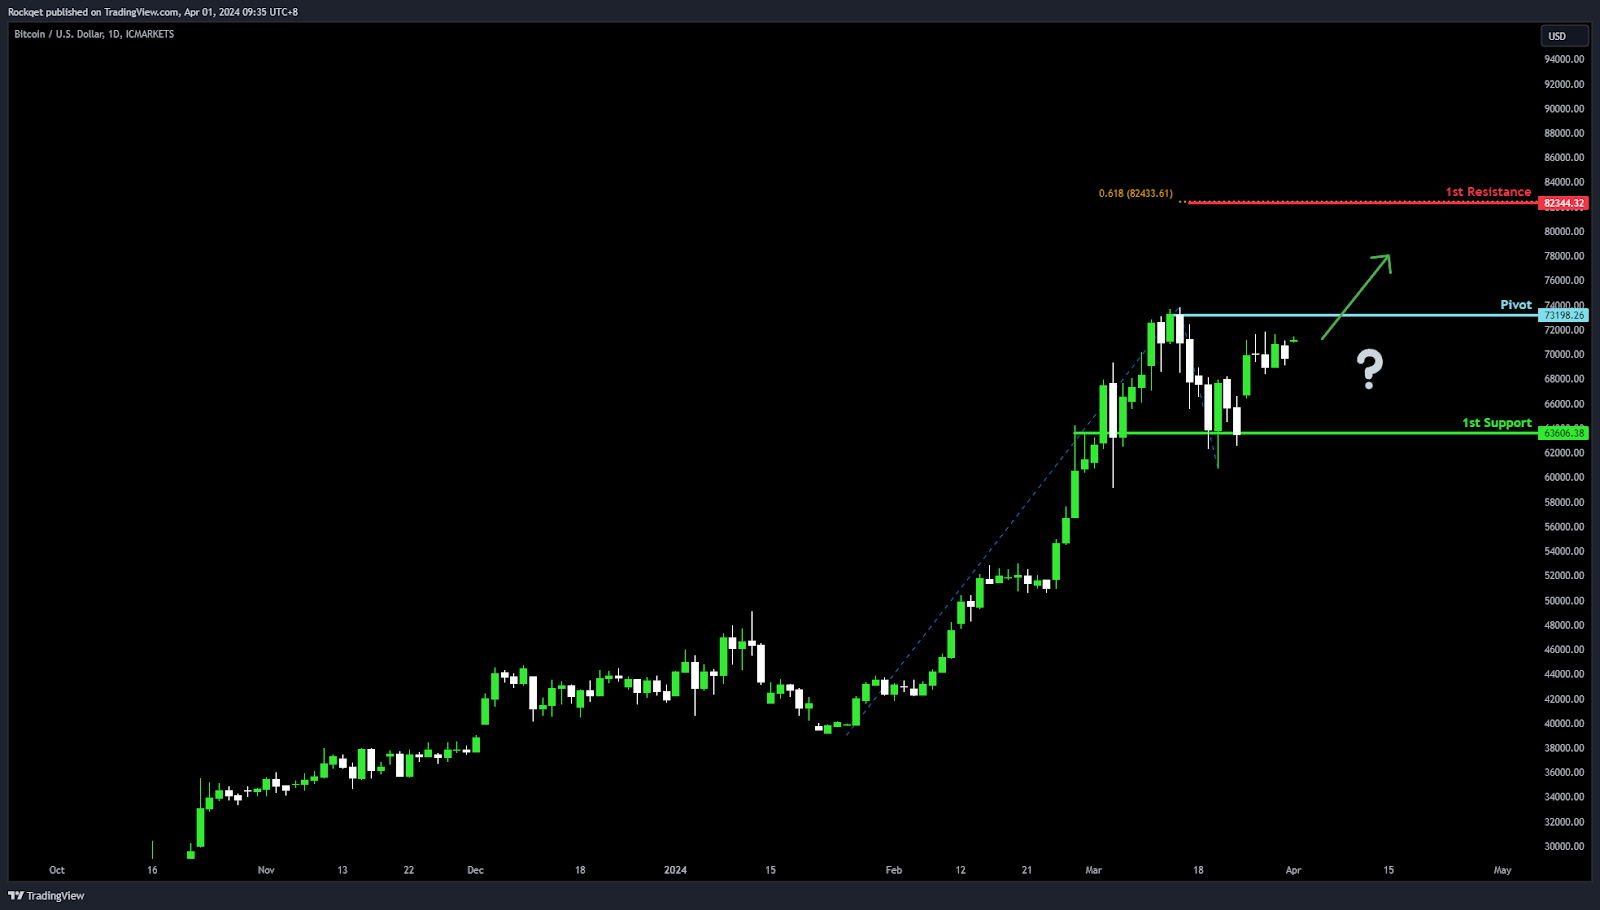
BTC/USD:
Potential Direction: Bullish
Overall momentum of the chart: Bullish
Price could potentially make a: Bullish break through of pivot and rise to 1st resistance
Pivot: 73198.26
Supporting reasons: Identified as Swing high resistance, a critical level that, once breached, could indicate strong buying pressure and a continuation of the bullish trend, suggesting a potential for significant upward movement.
1st support: 63606.38
Supporting reasons: Acts as an Overlap support, suggesting a significant area where the market has previously found strong buying interest, providing a solid foundation for potential price stabilization or a rebound in the event of a pullback, reinforcing the bullish sentiment.
1st resistance: 82344.32
Supporting reasons: Marked by a 61.80% Fibonacci Projection, indicating a significant barrier that could cap upward movements.
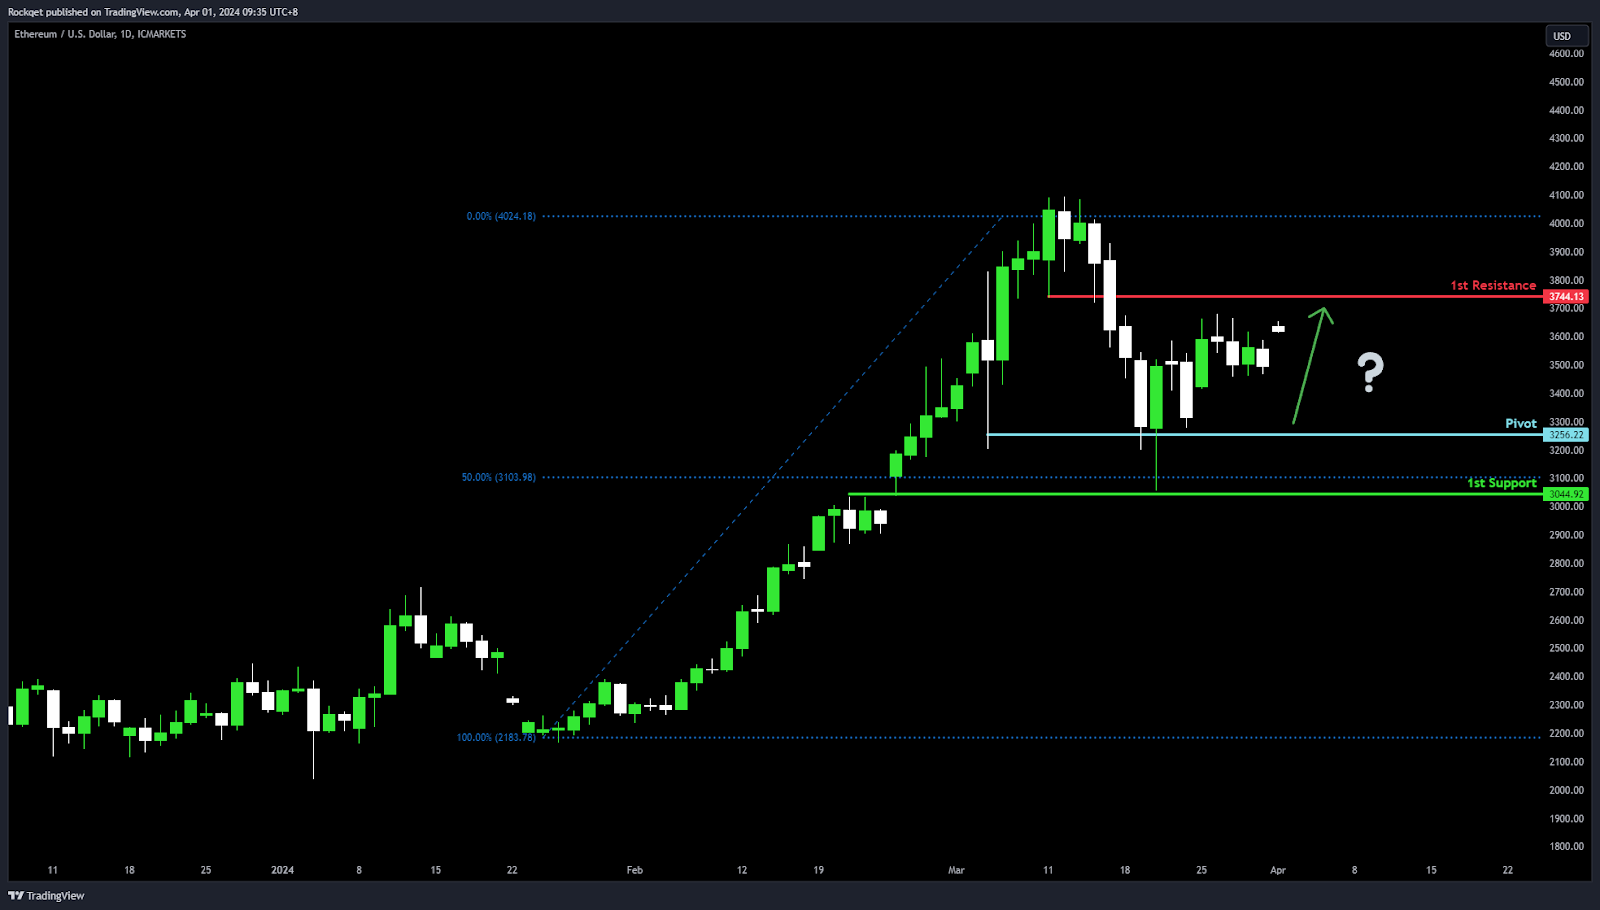
ETH/USD:
Potential Direction: Bullish
Overall momentum of the chart: Bullish
Price could potentially make a: Bullish bounce off pivot and head towards 1st resistance
Pivot: 3256.22
Supporting reasons: Acts as Multi-swing low support, indicating a key level where buying interest has historically been strong, suggesting a solid foundation for a potential upward movement, reinforcing the bullish sentiment.
1st support: 3044.92
Supporting reasons: Known as an Overlap support with a 50% Fibonacci Retracement, suggesting a significant area where the market has previously found support, providing a basis for potential price stabilization or a rebound within the bullish context.
1st resistance: 3744.13
Supporting reasons: Identified as Pullback resistance, marking a significant barrier that has previously capped upward movements.

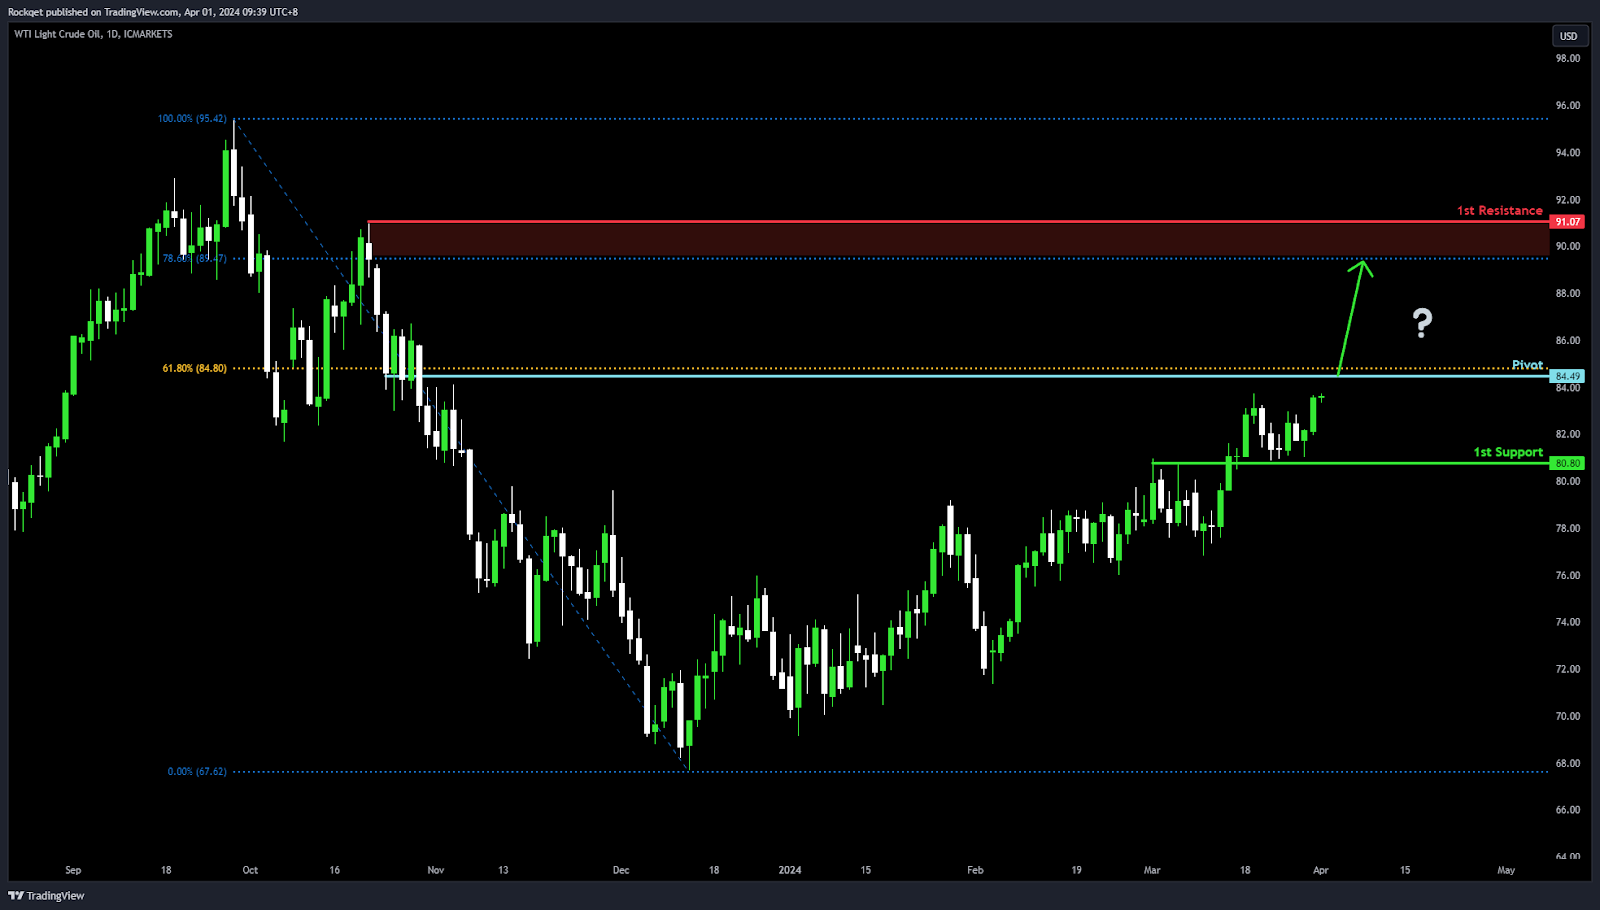
WTI/USD (Oil):
Potential Direction: Bullish
Overall momentum of the chart: Bullish
Price could potentially make a: Bullish break through of pivot and rise to 1st resistance
Pivot: 84.49
Supporting reasons: Marked by a 61.80% Fibonacci Retracement, indicating a significant level where buying pressure might intensify, suggesting a potential turning point for the price to break through and continue its upward trajectory.
1st support: 80.80
Supporting reasons: Known as an Overlap support, suggesting a significant area where the market has previously found strong buying interest, providing a solid foundation for potential price stabilization or a rebound, reinforcing the bullish sentiment.
1st resistance: 91.07
Supporting reasons: Identified as Swing high resistance with a 78.60% Fibonacci Retracement, marking a significant barrier that could cap upward movements.
.
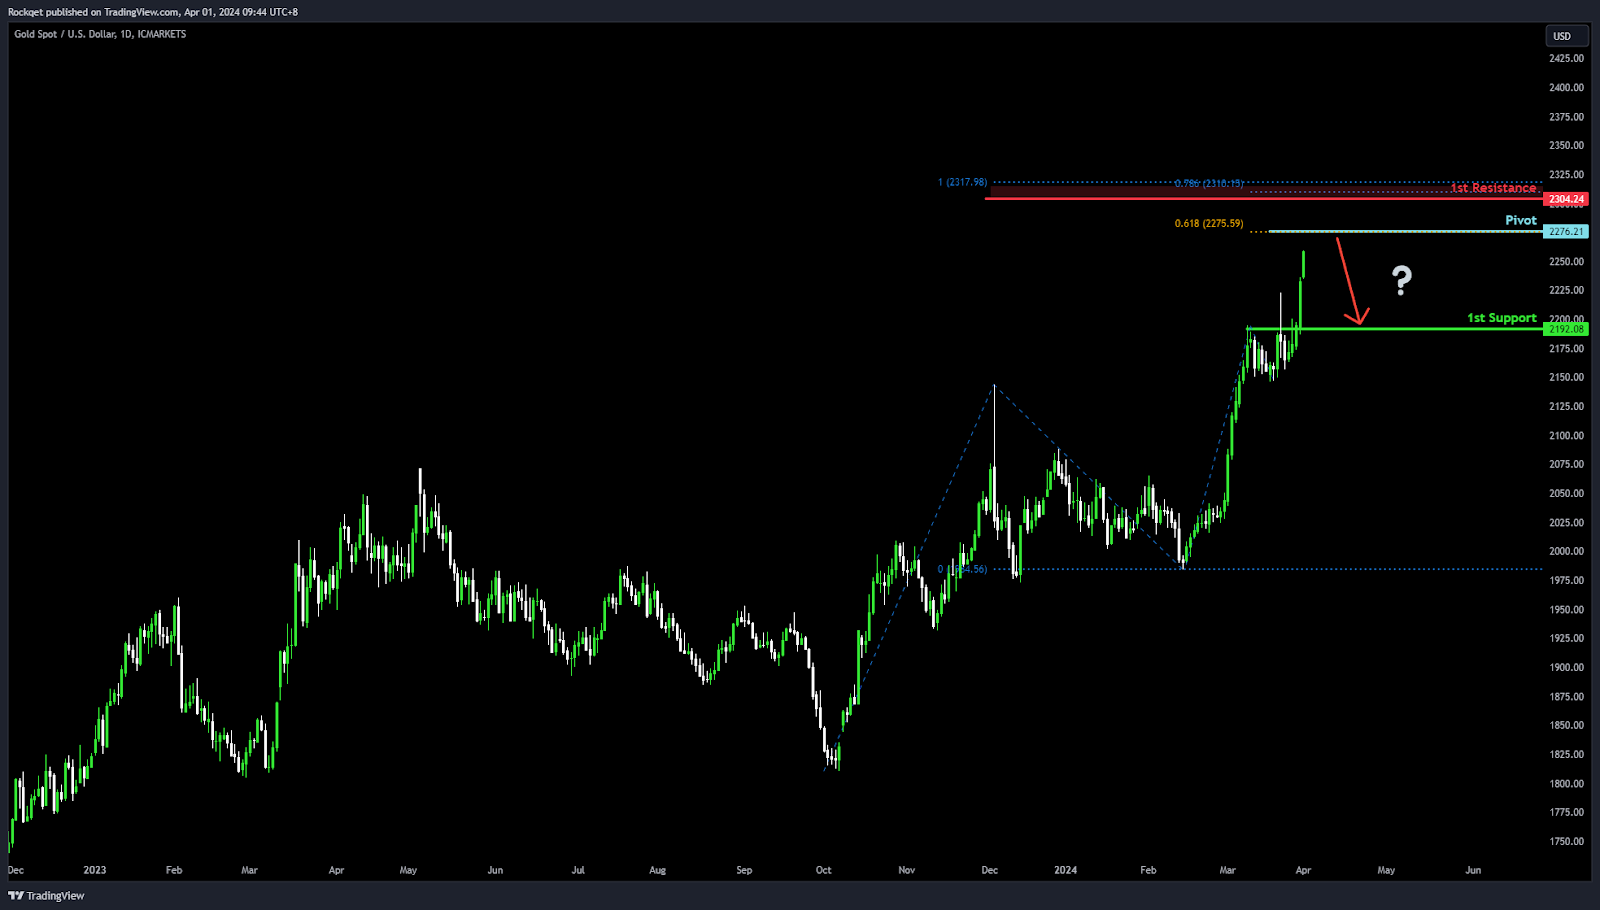
XAU/USD (GOLD):
Potential Direction: Bearish
Overall momentum of the chart: Bullish
Price could potentially make a: Bearish reaction off pivot and drop to 1st support
Pivot: 2276.21
Supporting reasons: Marked by a 61.80% Fibonacci Projection, indicating a significant level where selling pressure could intensify, suggesting a potential turning point for the price to continue its downward movement within the context of an overall bullish trend.
1st support: 2192.08
Supporting reasons: Known as Pullback support, suggesting a significant area where the market has previously found support, providing a foundation for potential price stabilization or a minor rebound within the bearish movement.
1st resistance: 2304.24
Supporting reasons: Characterized by a 78.60% Fibonacci Projection, marking a significant barrier that could cap upward movements, indicating a crucial threshold for monitoring bearish momentum against the backdrop of an overall bullish market.
The accuracy, completeness and timeliness of the information contained on this site cannot be guaranteed. IC Markets does not warranty, guarantee or make any representations, or assume any liability regarding financial results based on the use of the information in the site.
News, views, opinions, recommendations and other information obtained from sources outside of www.icmarkets.com, used in this site are believed to be reliable, but we cannot guarantee their accuracy or completeness. All such information is subject to change at any time without notice. IC Markets assumes no responsibility for the content of any linked site.
The fact that such links may exist does not indicate approval or endorsement of any material contained on any linked site. IC Markets is not liable for any harm caused by the transmission, through accessing the services or information on this site, of a computer virus, or other computer code or programming device that might be used to access, delete, damage, disable, disrupt or otherwise impede in any manner, the operation of the site or of any user’s software, hardware, data or property.


