
EUR/USD:
Weekly gain/loss: -0.14%
Weekly closing price: 1.2287
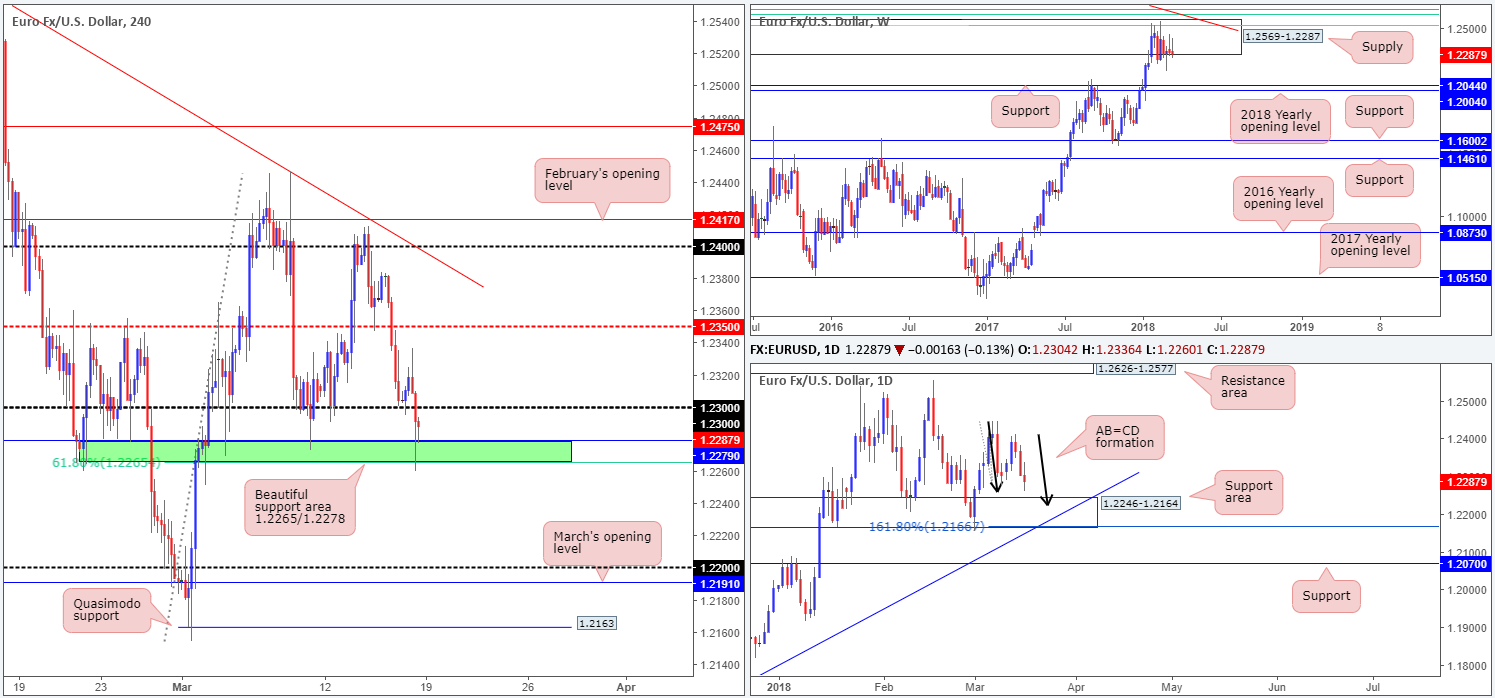
Over the last week, the single currency penciled in its second consecutive weekly selling tail within the lower limits of a major-league weekly supply coming in at 1.2569-1.2287. This means that the unit could press lower this week and potentially shake hands with the weekly support at 1.2044, followed closely by the 2018 yearly opening level at 1.2004.
After topping at 1.2412 on Wednesday, the daily candles spent the remainder of the week inching lower and eventually concluded trade just north of a daily support area marked at 1.2246-1.2164. Also in sight is a possible AB=CD 161.8% daily Fib ext. point at 1.2166. It’s important to note that this level converges with the lower edge of the aforementioned daily support area and a long-term daily trendline support extended from the low 1.0569.
A quick recap of Friday’s movement on the H4 timeframe shows that the euro lost ground amid US trade, due to a stronger dollar across the board. The USD strengthened after upbeat industrial production data, which jumped 1.1% (expected 0.3%), the strongest gain since October. The USD also caught a second wind after the University of Michigan sentiment rose to its highest level in 14 years. Following a strong downside break of 1.23, the major ended the session crossing swords with a nice-looking area of H4 support (marked in green) at 1.2265/1.2278, comprised of a 61.8% H4 Fib support at 1.2265 and a H4 support level drawn from 1.2278.
Potential trading zones:
Let’s just run through what we have here:
- Weekly flow suggesting lower prices.
- Daily action also pointing to a move lower but limited by the nearby daily support zone.
- H4 price sandwiched between a H4 support area and 1.23.
On the H4 timeframe, a breach of 1.23 has the H4 mid-level resistance at 1.2350 to target, whereas a break of the current H4 support area could see the piece challenge 1.22.
- Selling beyond 1.2265/1.2278 is chancy due to the possibility of buying from the noted daily support area.
- Buying above 1.23 is equally as chancy given the two weekly selling wicks printed within a major weekly supply.
As you can see neither a long nor short seems attractive according to structure, particularly for traders wanting to initiate medium/long-term positions. As a result, it may be best to remain on the sidelines today and reevaluate the situation on Tuesday.
Data points to consider: FOMC member Bostic speaks at 1.40pm GMT.
Areas worthy of attention:
Supports: 1.2265/1.2278; 1.22; 1.2246-1.2164; daily trendline support; 1.2166; 1.2004/1.2044.
Resistances: 1.23; 1.2350; 1.2569-1.2287.
GBP/USD:
Weekly gain/loss: +0.67%
Weekly closing price: 1.3944
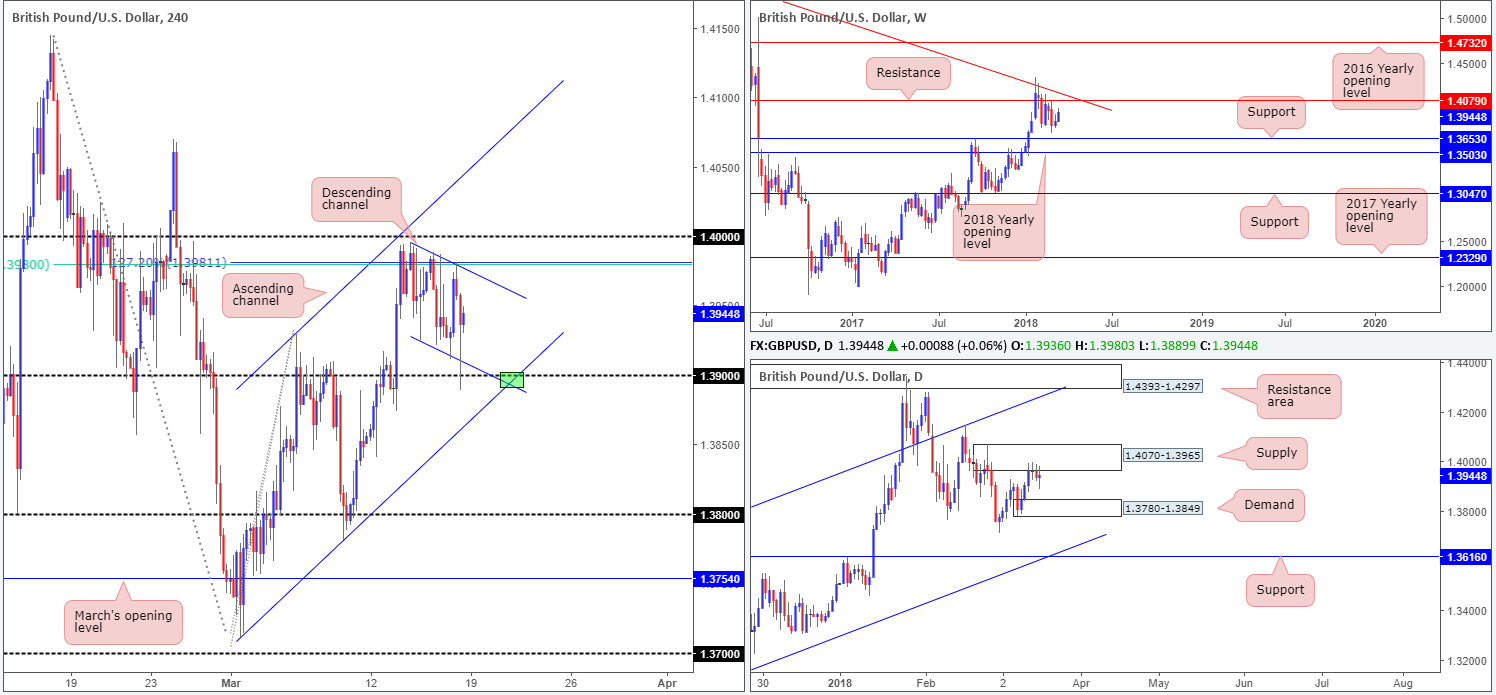
Leaving the weekly support level at 1.3635 unchallenged, weekly price currently appears to be headed in the direction of a weekly resistance level at 1.4079, which happens to unite closely with a weekly trendline resistance taken from the high 1.5930.
Since Tuesday, the British pound found a ceiling around the underside of a daily supply zone coming in at 1.4070-1.3965. The next port of call beneath here can be seen in the form of a daily demand area at 1.3780-1.3849. Beyond here, we have a daily support level in view at 1.3616 that fuses with a long-term daily channel support extended from the low 1.2108.
The 1.40/1.3980 zone on the H4 timeframe (61.8% H4 Fib resistance/127.2% Fib ext. point), once again, held the unit lower on Friday, which saw H4 price tap the 1.39 handle. Also in view on the H4 scale is a local H4 descending channel formation (1.3995/1.3925) and H4 trendline support from the low 1.3711.
Potential trading zones:
1.39 is a level that stands out on the H4 timeframe this morning, due to a convergence of the aforementioned H4 trendline support and the H4 channel support (green zone). As you can probably see, though, this buy zone holds no higher-timeframe support. Therefore, the most we’d expect from here is a bounce up to the neighboring H4 channel resistance.
Data points to consider: FOMC member Bostic speaks at 1.40pm GMT.
Areas worthy of attention:
Supports: 1.39; H4 channel support; H4 trendline support; 1.3780-1.3849; 1.3616; daily channel support.
Resistances: 1.4008/1.3980; 1.4070-1.3965; 1.4079.
AUD/USD:
Weekly gain/loss: -1.75%
Weekly closing price: 0.7708
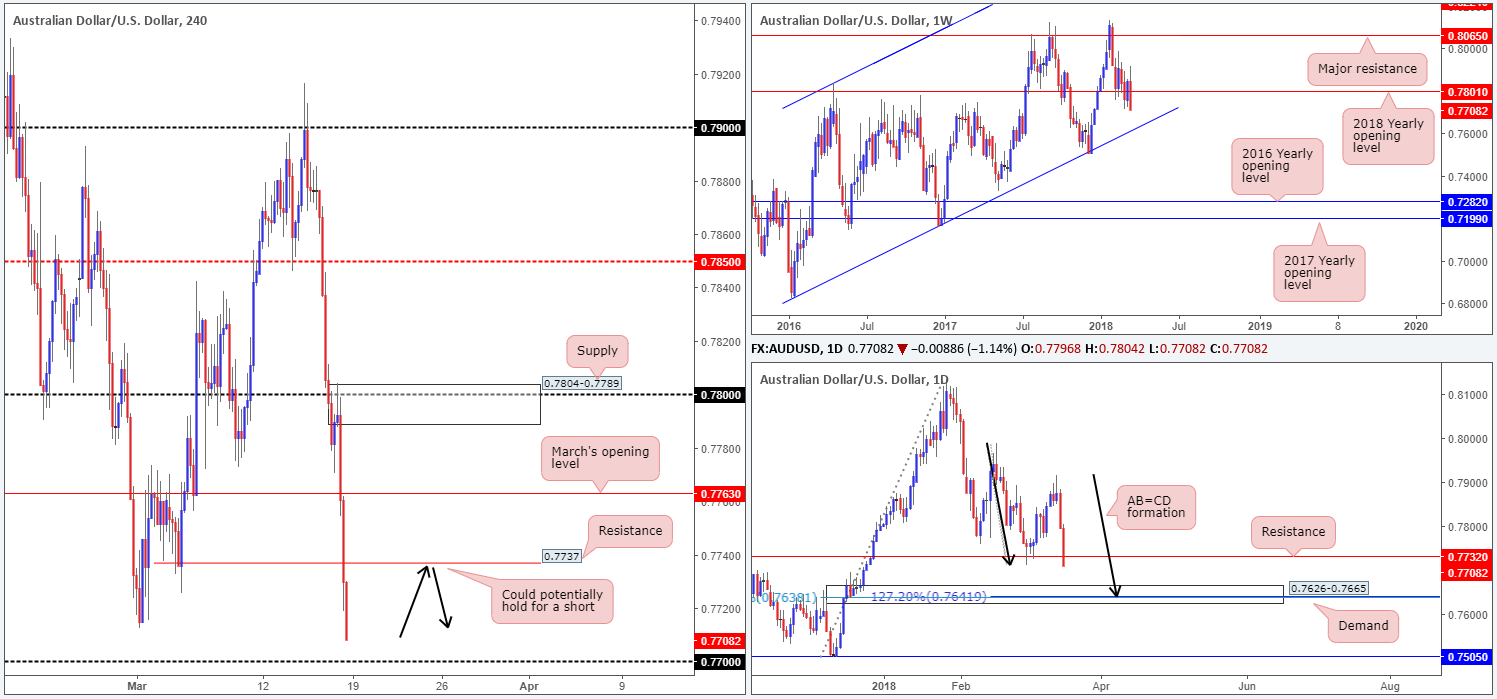
The Australian dollar experienced a substantial decline in value during the course of last week’s trading. Not only did weekly price close below the 2018 yearly opening level at 0.7801, it did so in the shape of a weekly bearish engulfing candle that closed on its lows! The move, as you can see, has firmly placed the long-term weekly channel support (0.6827) in the firing range.
Clearly visible from the daily timeframe, the pair began turning lower on Thursday. In the shape of two near-full-bodied daily bearish candles, the commodity currency engulfed daily support at 0.7732 and possibly set the stage for a continuation move down to daily demand at 0.7626-0.7665 this week. Traders may have also noticed that this daily area of demand houses a 78.6% daily Fib retracement value at 0.7638 and a daily AB=CD (see black arrows) 127.2% Fib ext. point at 0.7641. Though this area is plotted just north of the aforesaid weekly channel support, a bounce from this angle is expected.
Following a successful retest of 0.78, the H4 candles pushed south in dominant fashion as we transitioned into London’s time zone on Friday. March’s opening level at 0.7763 and the H4 support at 0.7737 were both wiped out, with the pair wrapping up the day closing just north of the 0.77 handle. In view of the higher timeframes suggesting further selling could be on the cards, however, traders might also want to note down the H4 support level drawn from 0.7654 (not seen on the screen).
Potential trading zones:
Given a possible breach of 0.77, according to higher-timeframe structure, the team has noted the H4 resistance level at 0.7737 as a possible reversal zone. Seeing as 0.7737 merges closely with daily resistance at 0.7732, a short from here will likely target the top edge of the current daily demand at 0.7665.
Data points to consider: FOMC member Bostic speaks at 1.40pm GMT.
Areas worthy of attention:
Supports: 0.77; 0.7654; 0.7626-0.7665; weekly channel support.
Resistances: 0.7737; 0.7732; 0.7801.
USD/JPY:
Weekly gain/loss: -0.74%
Weekly closing price: 105.95
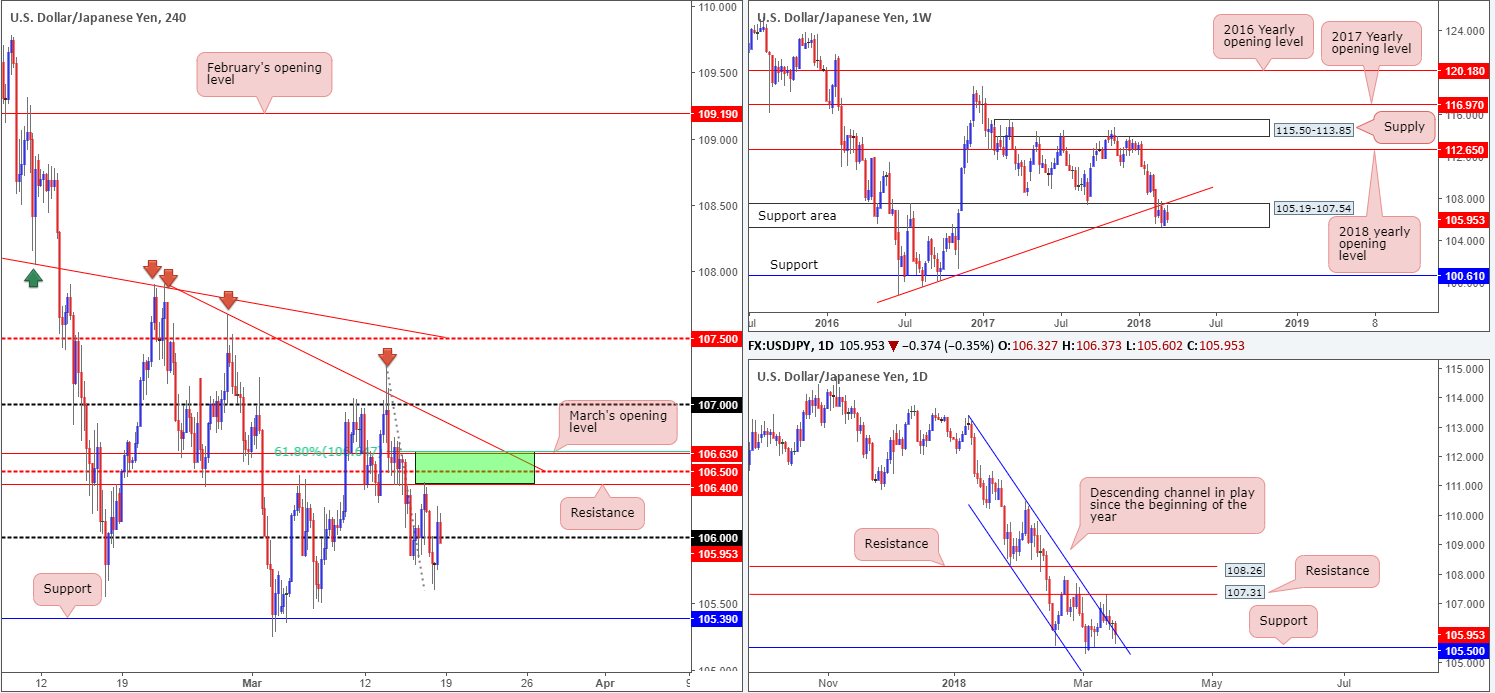
Since mid-February the weekly candles have been consolidating between a weekly support area pegged at 105.19-107.54, and a nearby weekly trendline support-turned resistance (etched from the low 98.78).
The story on the daily timeframe, however, reveals that the unit spent last week grinding alongside a daily channel resistance line taken from the high 113.38. The week ended marginally closing beneath the barrier, now eyeing the daily support level penciled in at 105.50.
Branching across to the H4 timeframe, we can see that after the pair put in a bottom at 105.60, price attempted to trim losses amid higher yields and strong US economic data. Following a pop to highs of 106.23, the unit failed to sustain gains and reversed course, marginally closing back beneath 106 to cap off the day.
Potential trading zones:
106.64/106.40 marked in green on the H4 timeframe is an interesting area of resistance (comprised of a 61.8% H4 Fib resistance at 106.64, March’s opening level at 106.63, a H4 mid-level resistance at 106.50 and a H4 resistance at 106.40). Despite its surrounding confluence, nonetheless, traders should note that the area houses no higher-timeframe resistance, and therefore may only produce an intraday bounce at best.
Downside targets for those considering shorts beyond the 106 handle fall in at the daily support level mentioned above at 105.50, followed closely by H4 support noted at 105.39.
Data points to consider: FOMC member Bostic speaks at 1.40pm GMT.
Areas worthy of attention:
Supports: 105.19-107.54; 105.50; 105.39.
Resistances: 106.64/106.40; 106; daily channel resistance; weekly trendline resistance.
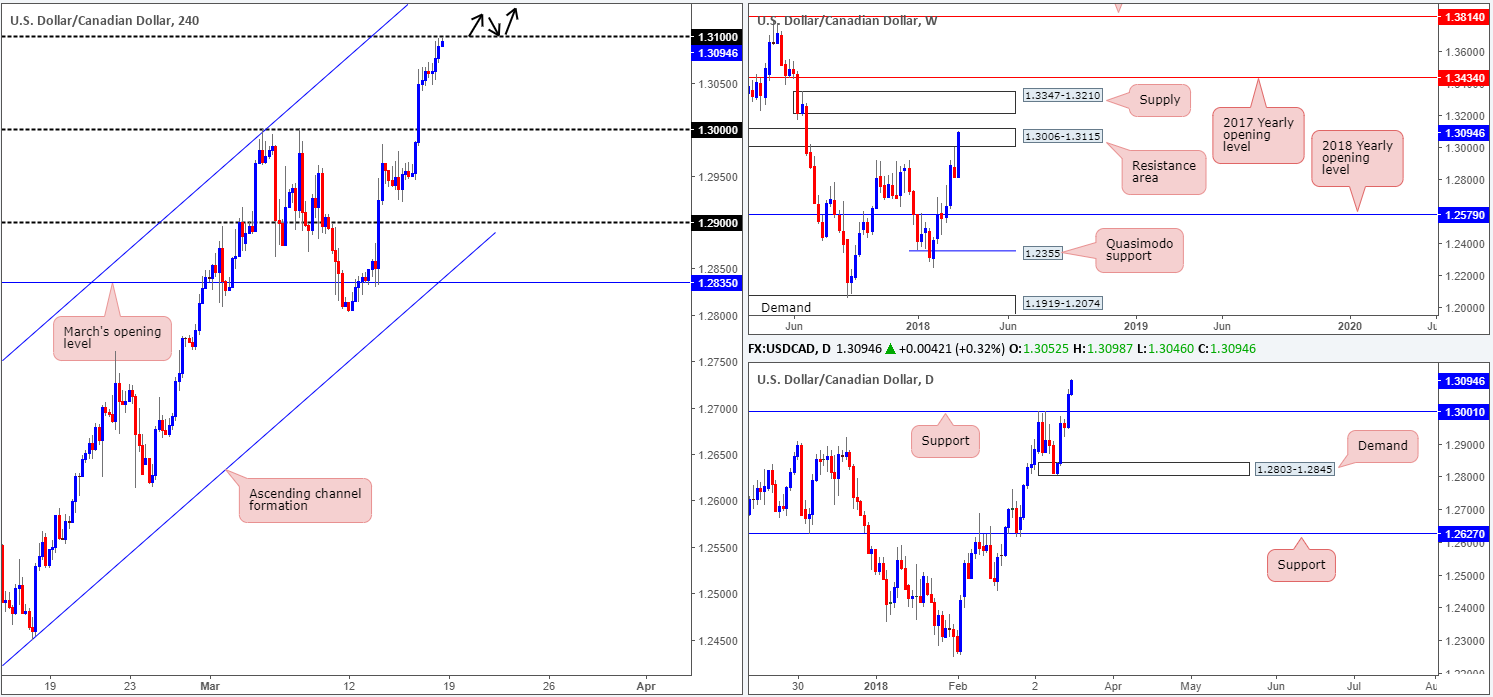
USD/CAD:
Weekly gain/loss: +2.22%
Weekly closing price: 1.3094
It’s amazing what a new week of trade can bring. This time last week we were presented with a strong-looking weekly selling wick formed just short of a weekly resistance area at 1.3006-1.3115. Lower prices, we thought, were likely on the cards. As you can see, though, this was just not the case! The USD/CAD chalked up a near-full-bodied weekly bullish candle that brought the unit up to within the upper boundary of the said weekly resistance zone. Further buying from here could eventually see the unit test weekly supply drawn from 1.3347-1.3210.
Turning the focus to the daily timeframe, it’s clear that daily resistance at 1.3001 (now acting support) was aggressively taken out on Thursday. With Friday’s action extending this move, this has potentially placed a daily resistance level at 1.3207 on the hit list this week (positioned just ahead of the weekly supply area mentioned above at 1.3347-1.3210).
On the back of upbeat US industrial production data and contracting Canadian manufacturing sales, the H4 candles came within a few pips of shaking hands with the key 1.31 milestone going into Friday’s close. Assuming 1.31 is consumed, the pair could attempt an approach to 1.3165: a H4 resistance level that merges closely with a H4 channel resistance taken from the high 1.2688 (not seen on the screen).
Potential trading zones:
Traders are likely eyeing a break of 1.31 for a retest play, targeting the aforementioned H4 resistance level (see black arrows). As long as a solid retest of 1.31 is seen, this, in our opinion, is a high-probability move, as a clearance of 1.31 will likely place weekly price ABOVE the current weekly resistance area. And as we already know, the next port of call beyond here, apart from the noted H4 resistance level, is the daily resistance level plotted at 1.3207.
Data points to consider: FOMC member Bostic speaks at 1.40pm GMT.
Areas worthy of attention:
Supports: 1.30; 1.3001.
Resistances: 1.31; 1.3165; 1.3006-1.3115; 1.3207.
USD/CHF:
Weekly gain/loss: +0.09%
Weekly closing price: 1.3094
Over the course of last week’s trading, the pair registered its fourth consecutive weekly gain. Given the minor topside breach of a major weekly resistance area at 0.9443-0.9515, traders may want to pencil in the 2018 yearly opening level at 0.9744 as the next upside objective.
In recent movement, we also saw daily price firmly retest daily support at 0.9444 and clock a fresh high of 0.9547. The break of the 08/03 high at 0.9534 likely triggered a large portion of stop-loss orders and, therefore, has possibly set the stage for a move up to daily supply pegged at 0.9666-0.9589. Also notable from a technical perspective is the AB=CD (see black arrows and green zone) 127.2% daily Fib ext. point which coincides with the lower edge of the aforesaid daily supply.
Following Thursday’s heavy-handed push to the upside, H4 price pulled back on Friday and aggressively retested the 0.95 handle as support. Blending nicely with a 38.2% H4 Fib support, the 0.95 handle is likely going to be brought into the fray once again today.
Potential trading zones:
With the above notes in mind, here is what we have so far:
- Daily price shows room to push up to 0.9589 and complete its AB=CD formation.
- Weekly price remains trading around the topside of a weekly resistance area.
- H4 price likely to challenge 0.95. However, we are a little concerned buyers have been weakened from Friday’s retest, so a test of the H4 channel support taken from the low 0.9187 could be in store.
For those wishing to trade long from 0.95, waiting for additional candle confirmation in the form of a full or near-full-bodied H4 bull candle may be an alternative to simply placing a pending order and hoping for the best. Should the trade come to fruition, look for the unit to test 0.9550, and then 0.9589 as a final take-profit target.
Data points to consider: FOMC member Bostic speaks at 1.40pm GMT.

Areas worthy of attention:
Supports: 0.95; H4 channel support; 0.9444.
Resistances: 0.9550; 0.9666-0.9589; 0.9744.
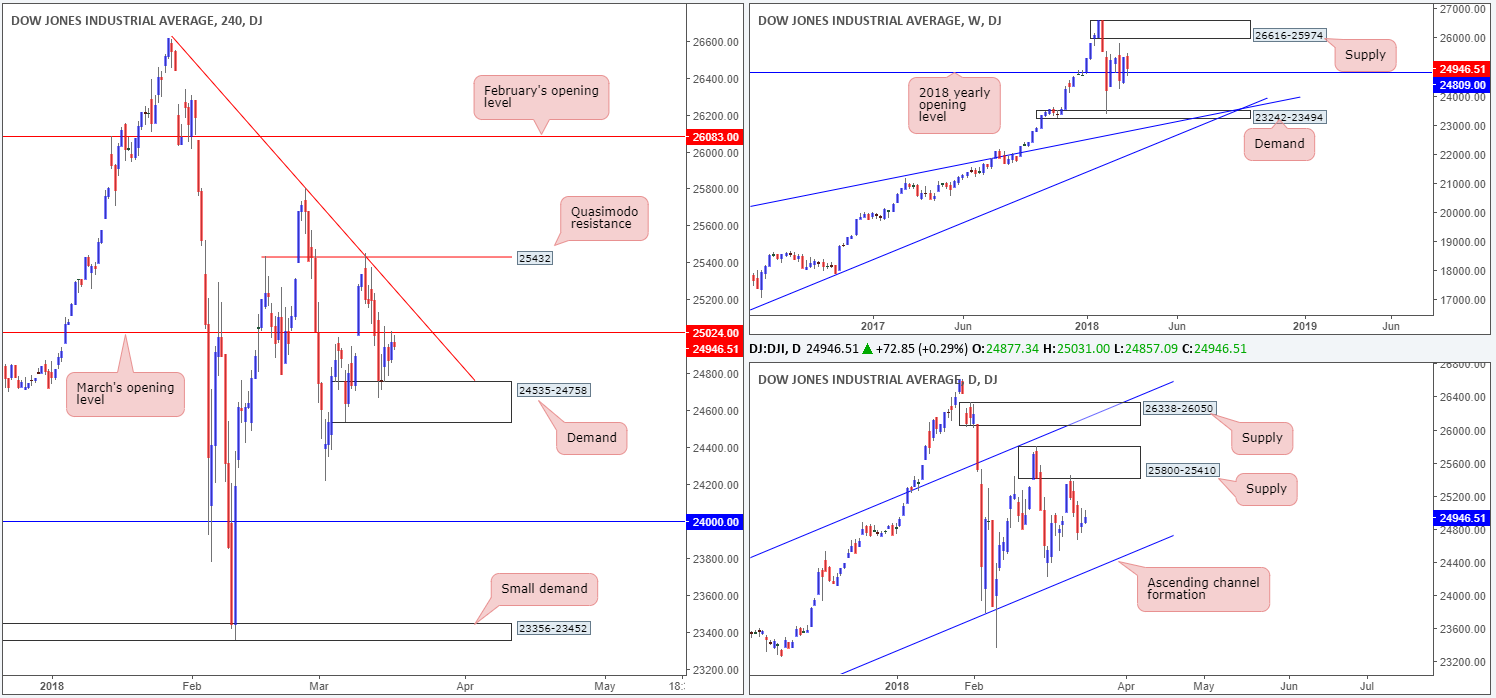
DOW 30:
Weekly gain/loss: -1.54%
Weekly closing price: 24946
Recent activity brought price marginally back above the 2018 yearly opening level seen on the weekly timeframe at 24809. Should bids remain defensive, the next upside hurdle in view is a weekly supply zone coming in at 26616-25974.
According to the daily timeframe, though, further selling could very well be on the cards. After responding beautifully to daily supply at 25800-25410 on Monday last week, the index still shows room to press as far south as the daily channel support extended from the low 17883.
Turning over a page, the later stages of last week saw H4 price establish support from the top edge of a H4 demand base coming in at 24535-24758. Upside, however, has so far been limited by March’s opening level at 25024. The next area of interest beyond here is seen nearby in the form of a H4 trendline resistance (taken from the high 25800).
Potential trading zones:
Initial thoughts were to look for shorts beyond the current H4 demand area as this could trigger further selling down to the 24K mark on the H4 timeframe. Caution is warranted here, though, since there’s only a few points space beyond the H4 demand before we reach the noted daily channel support, so you could potentially be selling into a strong layer of daily buyers!
Data points to consider: FOMC member Bostic speaks at 1.40pm GMT.
Areas worthy of attention:
Supports: 24535-24758; 24000; 24809; daily channel support.
Resistances: 25800-25410; 25024; H4 trendline resistance; 26616-25974.
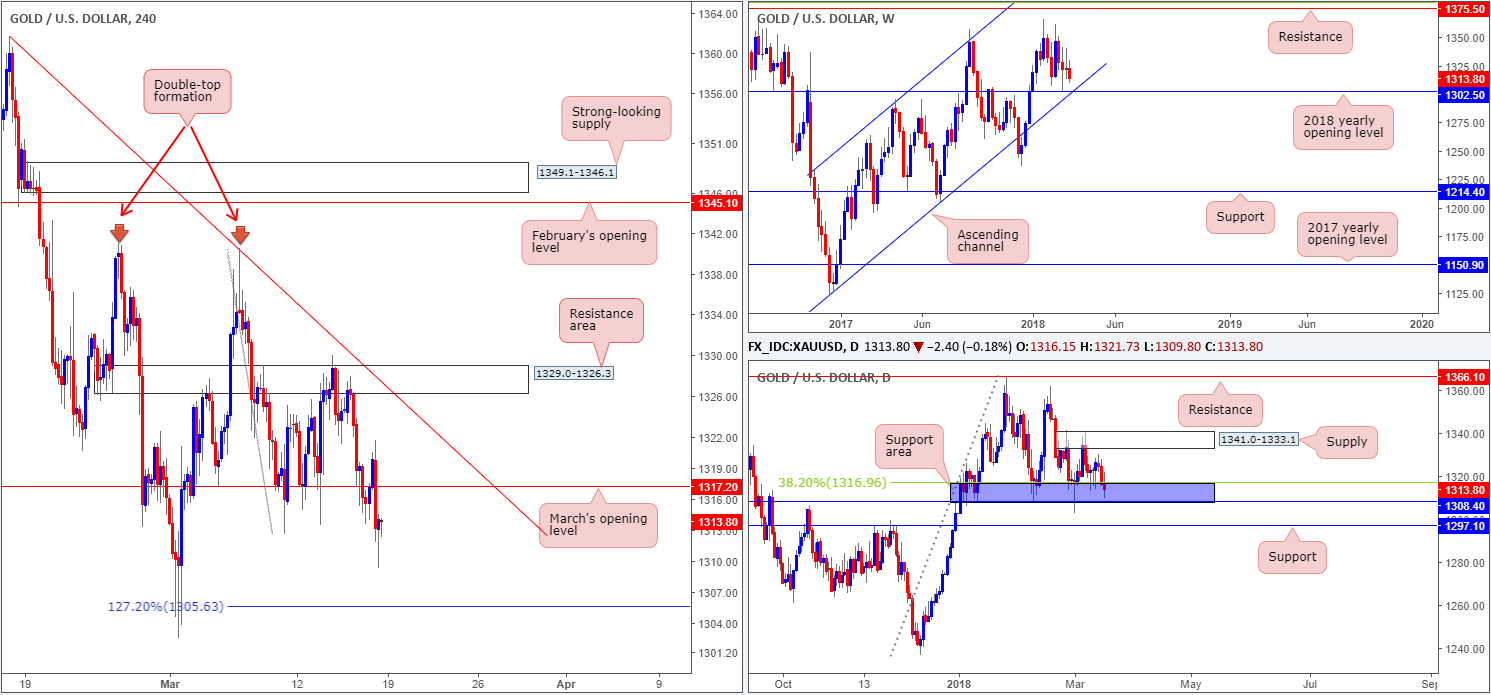
GOLD:
Weekly gain/loss: -0.73
Weekly closing price: 1313.8
With the US dollar index seen reclaiming the 90.00 mark, gold wrapped up the week in losses. Consequent to this, weekly price is seen trading within striking distance of the 2018 yearly opening level at 1302.5, which unites beautifully with a long-term weekly channel support etched from the low 1122.8.
Looking over the daily timeframe, nevertheless, you’ll see that daily price remains fluctuating between a daily supply area at 1341.0-1333.1 and a daily support area marked in blue at 1308.4/1316.9, and has been since late February. In order for weekly action to test the noted 2018 yearly opening band, the current daily support area will have to be engulfed.
Influenced by an advancing dollar, the H4 candles sliced through March’s opening level at 1317.2 on Friday and exposed a 127.2% H4 Fib ext. point at 1305.6.
Potential trading zones:
From a short-term perspective, trading a retest of the underside of 1317.2 could be an option, targeting 1305.6, followed by 1302.5. Although this would entail selling into the current daily support area, let’s not forget that weekly price indicates it may want to shake hands with 1302.5.
To be on the safe side, we would strongly recommend only trading a retest of 1317.2 on the back of a full or near-full-bodied H4 bearish candle. Though this will not guarantee a winning trade, it will show seller intent (entry on the close of the candle with stops positioned above the wick).
Areas worthy of attention:
Supports: 1305.6; 1308.4/1316.9; 1302.5; weekly channel support.
Resistances: 1341.0-1333.1; 1317.2.
This site has been designed for informational and educational purposes only and does not constitute an offer to sell nor a solicitation of an offer to buy any products which may be referenced upon the site. The services and information provided through this site are for personal, non-commercial, educational use and display. IC Markets does not provide personal trading advice through this site and does not represent that the products or services discussed are suitable for any trader. Traders are advised not to rely on any information contained in the site in the process of making a fully informed decision.
This site may include market analysis. All ideas, opinions, and/or forecasts, expressed or implied herein, information, charts or examples contained in the lessons, are for informational and educational purposes only and should not be construed as a recommendation to invest, trade, and/or speculate in the markets. Any trades, and/or speculations made in light of the ideas, opinions, and/or forecasts, expressed or implied herein, are committed at your own risk, financial or otherwise.
The use of the site is agreement that the site is for informational and educational purposes only and does not constitute advice in any form in the furtherance of any trade or trading decisions.
The accuracy, completeness and timeliness of the information contained on this site cannot be guaranteed. IC Markets does not warranty, guarantee or make any representations, or assume any liability with regard to financial results based on the use of the information in the site.
News, views, opinions, recommendations and other information obtained from sources outside of www.icmarkets.com.au, used in this site are believed to be reliable, but we cannot guarantee their accuracy or completeness. All such information is subject to change at any time without notice. IC Markets assumes no responsibility for the content of any linked site. The fact that such links may exist does not indicate approval or endorsement of any material contained on any linked site.
IC Markets is not liable for any harm caused by the transmission, through accessing the services or information on this site, of a computer virus, or other computer code or programming device that might be used to access, delete, damage, disable, disrupt or otherwise impede in any manner, the operation of the site or of any user’s software, hardware, data or property.


