
Waiting for lower timeframe confirmation is our main tool to confirm strength within higher timeframe zones, and has really been the key to our trading success. It takes a little time to understand the subtle nuances, however, as each trade is never the same, but once you master the rhythm so to speak, you will be saved from countless unnecessary losing trades. The following is a list of what we look for:
- A break/retest of supply or demand dependent on which way you’re trading.
- A trendline break/retest.
- Buying/selling tails/wicks – essentially we look for a cluster of very obvious spikes off of lower timeframe support and resistance levels within the higher timeframe zone.
- Candlestick patterns. We tend to stick with pin bars and engulfing bars as these have proven to be the most effective.
We typically search for lower-timeframe confirmation between the M15 and H1 timeframes, since most of our higher-timeframe areas begin with the H4. Stops are usually placed 1-3 pips beyond confirming structures.
EUR/USD:
Weekly gain/loss: 0
Weekly closing price: 1.1195
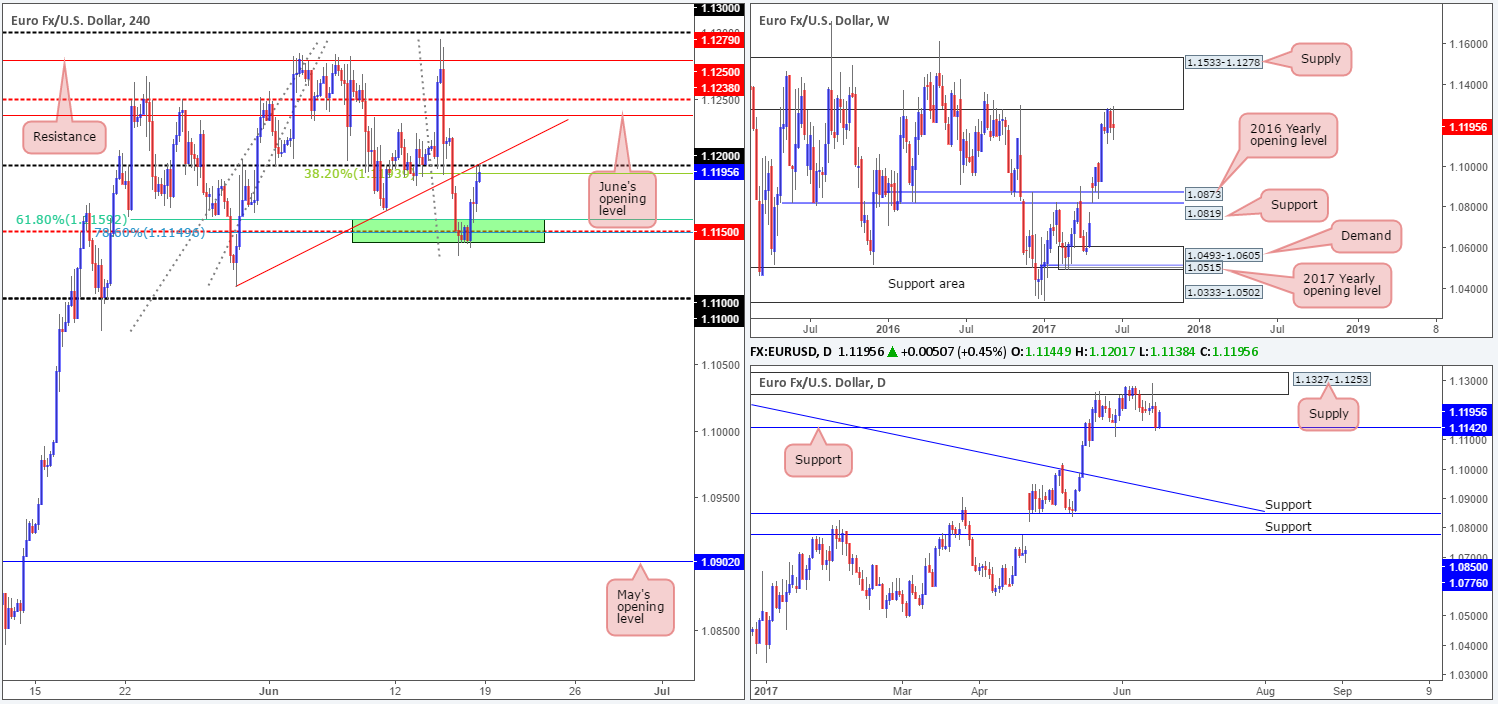
Despite the single currency ranging over 160 pips last week, there was absolutely no change registered at the close. What we did see form, however, was a clear-cut indecision weekly candle that tested the lower boundary of a major weekly supply coming in at 1.1533-1.1278.
Since the 22nd May, the daily candles have been consolidating between supply logged at 1.1327-1.1253 (glued to the underside of the said weekly supply zone) and a support level penciled in at 1.1142. A decisive close below this support could potentially place the trendline support etched from the high 1.1616 in the firing range, followed closely by support at 1.0850. To the upside, a break through the current supply may see price attempt to attack 1.1382: a daily Quasimodo resistance level.
For those who read Friday’s report you may recall that we showed interest in buying from the 1.1150 neighborhood should a reasonably sized H4 bull candle (preferably a full-bodied candle) take shape. This was due to the following converging structures (a H4 trendline support taken from the low 1.1075 was initially included but is now considered invalid on the H4 chart):
- A H4 61.8% Fib support at 1.1159 drawn from the low 1.1074.
- A H4 78.6% retracement level pegged at 1.1149 penciled in from the low 1.1109.
- A daily support level seen at 1.1142.
As you can see, H4 action rallied from the green buy zone on Friday, which saw price wrap up the week shaking hands with the 1.12 handle (intersects nicely with a H4 trendline resistance extended from the low 1.1109 and a H4 38.2% Fib resistance at 1.1193 taken from the high 1.1295).
Our suggestions: In short, here’s what we’re looking at right now.
- Weekly price indicates shorts may take the lead this week.
- Daily price on the other hand, recently recovered from support at 1.1142 and could pull the major back up to the aforementioned supply.
- H4 price is seen trading around a particularly confluent sell zone.
Given the above points, we feel the sellers may have the upper hand here at the moment. However, before we look to short from 1.12, our team would require additional H4 price confirmation in the form of a bearish candle (preferably a full-bodied candle). This will by no means guarantee that the sellers will continue to push lower, but what it will do is show seller intent around a high-probability sell zone that boasts weekly confluence.
Data points to consider: German Buba President Weidmann speaks at 4pm. FOMC Member Dudley speaks at 1pm GMT+1.
Levels to watch/live orders:
- Buys: Flat (stop loss: N/A).
- Sells: 1.12 region ([waiting for a reasonably sized H4 bear candle – preferably a full-bodied candle – to form before pulling the trigger is advised] stop loss: ideally beyond the candle’s wick).
GBP/USD:
Weekly gain/loss: + 35 pips
Weekly closing price: 1.2775
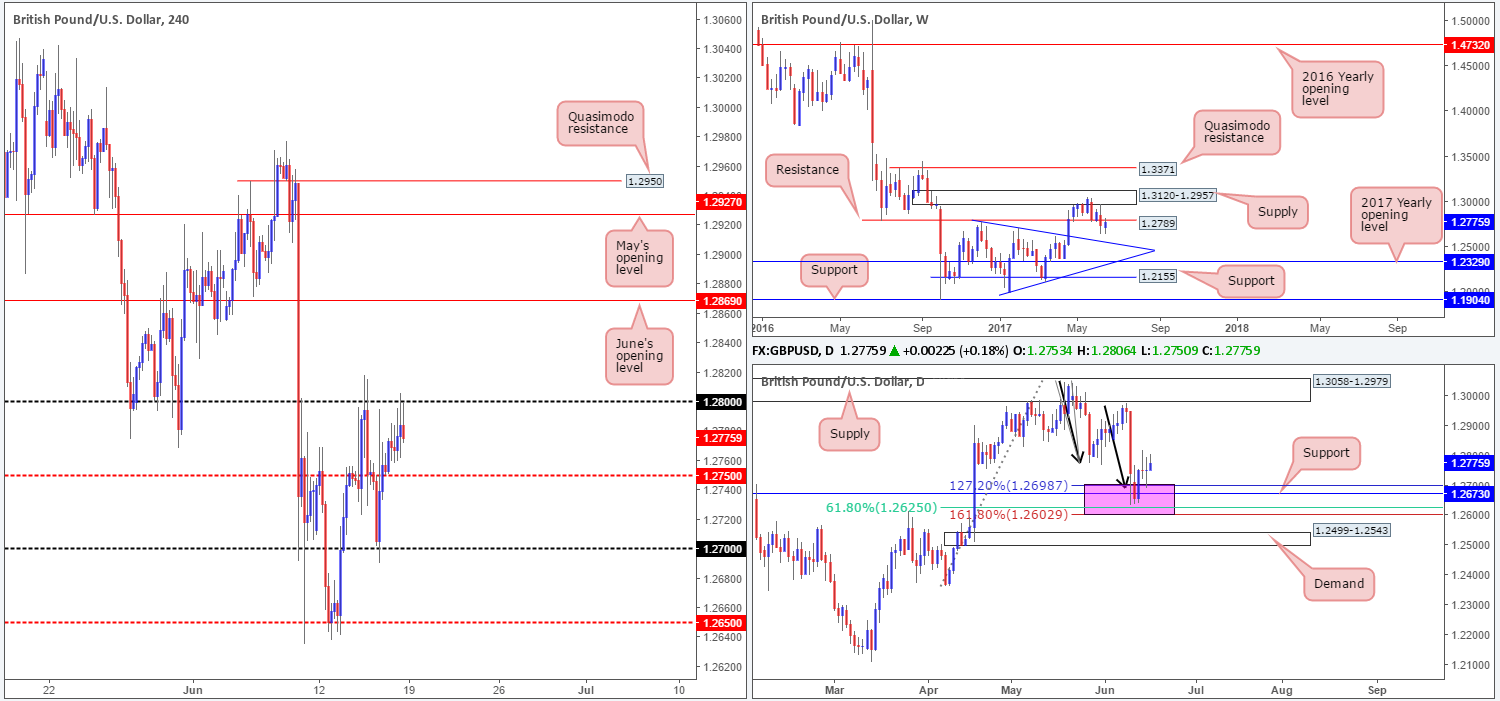
Following the close below weekly support at 1.2789 two weeks back, weekly price ended last week’s segment retesting the underside of this line as resistance. The question is, will it hold? Assuming that it does, we could witness price selloff down to a trendline support taken from the high 1.2774.
The story on the daily timeframe, nonetheless, shows the candles recovering from 1.2602/1.2698 (an area marked in pink). This zone is comprised of a support level coming in at 1.2673, a 61.8% Fib support at 1.2625 (taken from the low 1.2365) and an AB=CD (black arrows) 127.2/161.8% ext. completion point seen at 1.2602/1.2698 (drawn from the high 1.3047).
A quick recap of Friday’s movement on the H4 chart reveals that the 1.28 handle held firm as resistance going into the closing bell. This should not really come as much of a surprise considering that 1.28 sits only 20 or so pips above the said weekly resistance level. Consequent to this, 1.28 will likely play a key role today/this week.
Our suggestions: A decisive H4 close above 1.28 would likely place June’s opening level at 1.2869 in the spotlight, and confirm buyer strength from the aforementioned daily zone marked in pink. On the other hand, further rejection from 1.28 may lead to the daily zone being taken out and price challenging the daily demand seen below it at 1.2499-1.2543, which happens to converge nicely with the aforementioned weekly trendline support.
Nevertheless, no matter which direction you pick to take this week, you’ll be trading against higher-timeframe flow! With that being the case, our team has decided to remain on the sidelines for the time being until we have more of a defined direction in this market.
Data points to consider: FOMC Member Dudley speaks at 1pm GMT+1.
Levels to watch/live orders:
- Buys: Flat (stop loss: N/A).
- Sells: Flat (stop loss: N/A).
AUD/USD:
Weekly gain/loss: + 88 pips
Weekly closing price: 0.7616
Over the last week we saw the bulls continue to lift price higher, marginally closing above weekly supply at 0.7610-0.7543. However, it may be worth waiting for this week’s candle to close before presuming that the said weekly supply is consumed, since it could just as well be a fakeout.
Zooming in and looking at the daily timeframe, we can see that the unit ended the week closing just ahead of a supply zone pegged at 0.7679-0.7640. This further confirms the need to wait for the this week’s candle to close, as the current daily supply may hold and bring the commodity currency back down to the support area penciled in at 0.7556-0.7523.
H4 action, as you can see, remains consolidating between April’s opening level at 0.7632 and the support area coming in at 0.7571-0.7557. Of particular interest here is April’s opening level is sited just 8 pips below the lower edge of the daily supply mentioned above at 0.7679-0.7640.
Our suggestions: Although weekly price printed a minor close above supply, both the H4 and daily charts indicate that the bears have a fighting chance here! To our way of seeing things, an ideal scenario would be for H4 price to chalk up a bearish selling wick that whipsaws through 0.7632, connects with the daily supply and then closes back below 0.7632. This would, in our humble opinion, be enough evidence to validate a sell, with an initial target objective set at the said H4 support area.
Data points to consider: RBA Gov. Lowe speaks at 12.30am. FOMC Member Dudley speaks at 1pm GMT+1.

Levels to watch/live orders:
- Buys: Flat (stop loss: N/A).
- Sells: Look for H4 price to chalk up a bearish selling wick that whipsaws through 0.7632 and connects with the daily supply (stop loss: ideally beyond the candle’s wick).
USD/JPY:
Weekly gain/loss: + 55 pips
Weekly closing price: 110.86
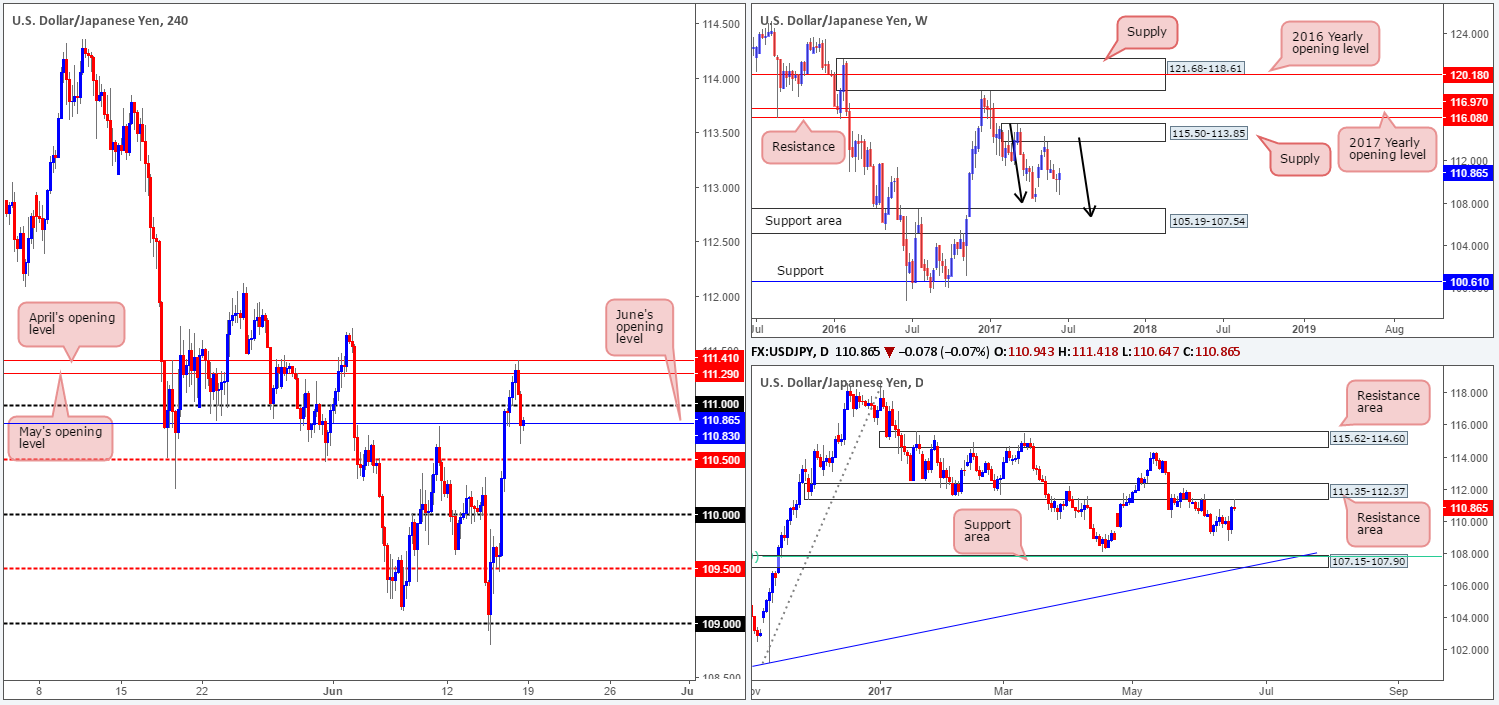
In spite of last week’s trade printing a gain, weekly bears remain in a relatively strong position after pushing aggressively lower from supply registered at 115.50-113.85. We know there’s a lot of ground to cover here, but this move could possibly result in further downside taking shape in the form of a weekly AB=CD correction (see black arrows) that terminates within a weekly support area marked at 105.19-107.54 (stretches all the way back to early 2014).
Down on the daily chart, price recently made contact with a resistance area drawn from 111.35-112.37. Considering that this base has been in play since the end of November 2016, and the weekly candles also show bearish intentions, we expect the sellers to remain in a dominant position. The next downside target from here can be seen at 107.15-107.90: a support zone that’s glued to the top edge of the said weekly support area.
For those who managed to catch Friday’s report you may recall that we highlighted April/May’s opening levels seen at 111.41/111.29 as a potential sell zone. We also said that due to the zone between these two levels being relatively small, we’d advise waiting for lower-timeframe confirmation (see the top of this report) before pulling the trigger. Unfortunately, we were unable to pin down a lower-timeframe setup from here, but what we did see was a H4 bearish candle, shaped in the form of a full-bodied candle, print from this zone. If we were not long the DOW 30, this would have been an attractive trade. Well done to any of our readers who managed to jump aboard here.
Our suggestions: As we write, H4 price established minor support around June’s opening base line at 110.83 into the week’s end. Personally, with what we’ve noted on the bigger picture, we do not see H4 price breaching the nearby 111 handle today. Regrettably however, trading short from below 110.86 is difficult given how near the H4 mid-level support at 110.50 is seen.
Therefore, if you’re currently short, we would look to hold the position for lower prices. If you missed the train from 111.41/111.29, nevertheless, we do not much else to hang our hat on at this time.
Data points to consider: FOMC Member Dudley speaks at 1pm GMT+1.
Levels to watch/live orders:
- Buys: Flat (stop loss: N/A).
- Sells: Flat (stop loss: N/A).
USD/CAD:
Weekly gain/loss: – 250 pips
Weekly closing price: 1.3212
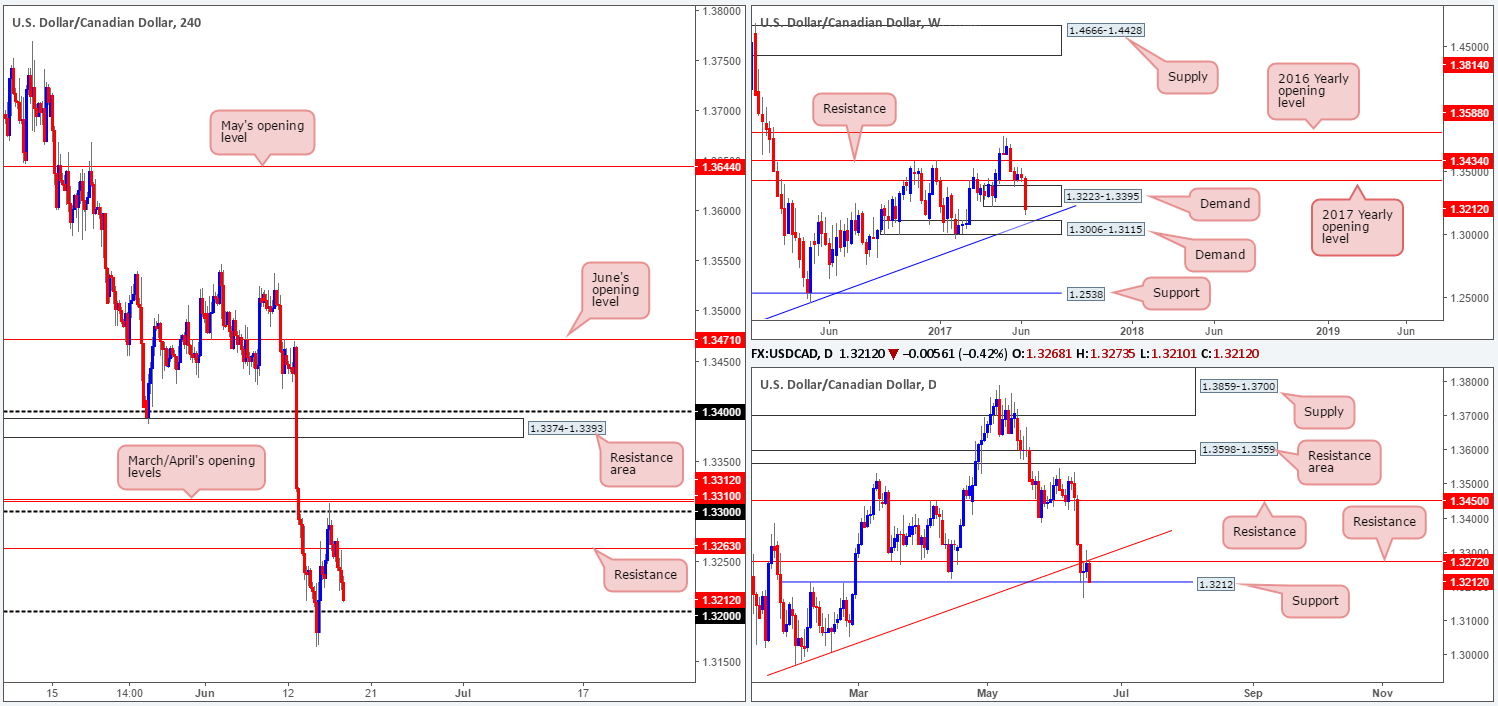
During the course of last week’s trading the USD/CAD plummeted lower, marginally closing beyond weekly demand at 1.3223-1.3395. While this recent break could imply that a move down to weekly demand at 1.3006-1.3115 (converges with a weekly trendline support taken from high 1.1278) may take place, there’s also a chance that this could simply be fakeout.
Down on the daily chart, things have recently been a tad cramped as price has been sandwiched between support at 1.3212 and resistance at 1.3272, which happens to meet with a trendline resistance extended from the low 1.2968. As can be seen from the chart, the pair ended the week closing around the said support, so there is a chance that we may see bids come into this market today.
A closer look at price action on the H4 chart shows that the support at 1.3263 did eventually give way, with the pair ending the day closing just ahead of the 1.32 handle. With daily support positioned just above this psychological band, weekly bears may struggle to continue pushing lower this week. With that, we will not be committing to any shorts at current price.
Our suggestions: In regards to longs, 1.32 could be an option today. A break below the daily support level at 1.3212 would likely trigger stops positioned beneath this barrier, thus providing liquidity to buy into. Furthermore, let’s also bear in mind that beneath the weekly demand, stops have also likely been triggered thus providing additional liquidity.
Ultimately, what we’re looking for is a full-bodied (or very near) H4 bull candle to form from 1.32. This would be a solid cue to enter long and target the H4 resistance pegged at 1.3263 as an initial take-profit zone.
Data points to consider: FOMC Member Dudley speaks at 1pm GMT+1.
Levels to watch/live orders:
- Buys: 1.32 region ([waiting for a reasonably sized H4 bull candle – preferably a full-bodied candle – to form before pulling the trigger is advised] stop loss: ideally beyond the candle’s tail).
- Sells: Flat (Stop loss: N/A).
USD/CHF:
Weekly gain/loss: + 49 pips
Weekly closing price: 0.9737
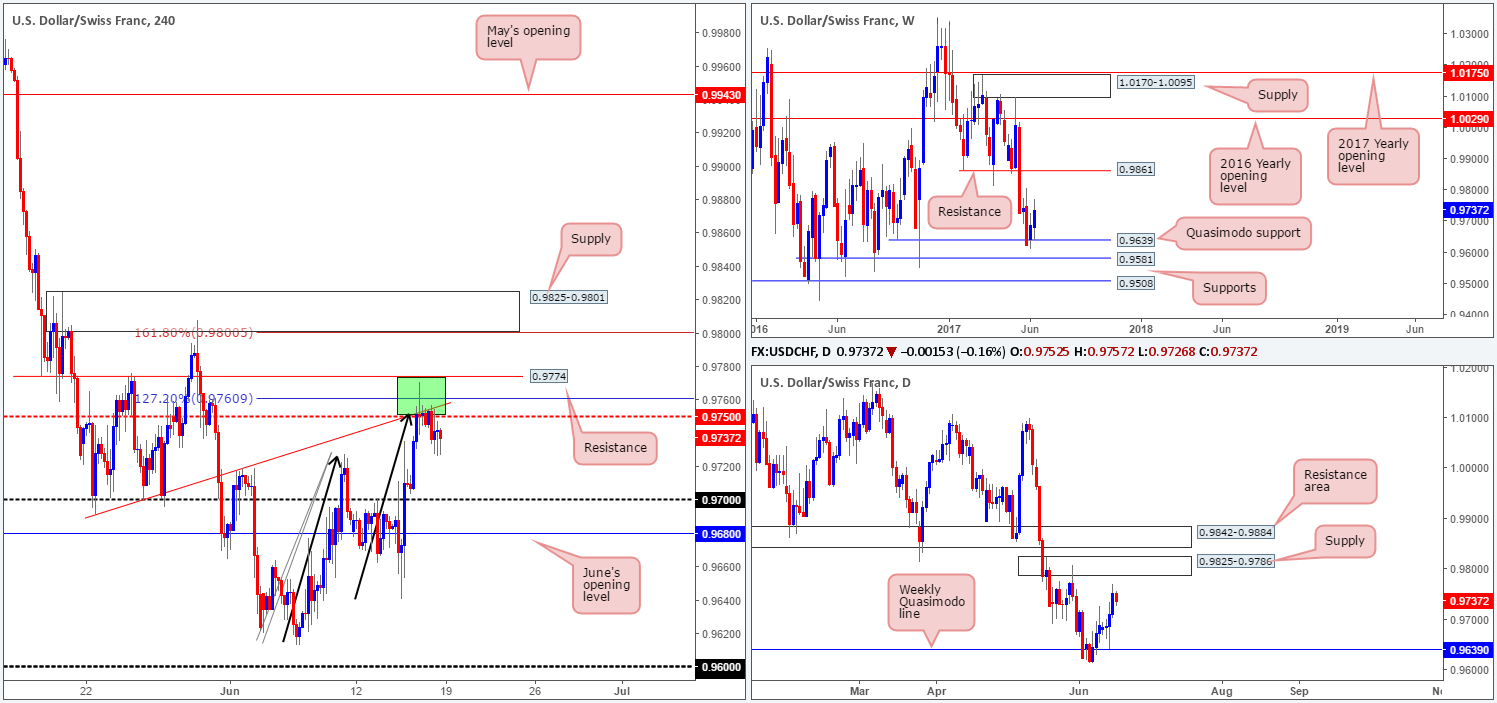
Recent action shows that the USD/CHF extended its bounce from the weekly Quasimodo support at 0.9639. In the event that the bulls continue to press forward, the next barrier in view is a resistance level coming in at 0.9861.
Down on the daily timeframe, nonetheless, we have price trading nearby a supply zone formed at 0.9825-0.9786. This zone, as you can probably see, is sited 35 or so pips below the said weekly resistance level, which happens to be encased within a daily resistance area at 0.9842-0.9884.
Looking over to the H4 candles, you can see that the green area at 0.9774/0.9750 managed to hold prices lower on Friday. 0.9774/0.9750 is comprised of a H4 resistance level at 0.9774, a H4 AB=CD 127.2% ext. at 0.9760 taken from the low 0.9613, a H4 trendline resistance etched from the low 0.9691 and a H4 mid-level resistance drawn from 0.9750. The H4 supply at 0.9825-0.9801 seen above, however, houses a H4 AB=CD 161.8% ext. at 0.98 taken from the low 0.9613 and the round number 0.98.
The interesting thing here, as we mentioned in Friday’s report, is that the lower (green) H4 area has no higher-timeframe convergence, whereas the H4 supply positioned above is located around the upper edge of daily supply marked at 0.9825-0.9786.
Our suggestions: Even though the H4 candles remain capped by the said H4 green zone on Friday, our desk has decided to hold fire and wait and see if H4 price can extend up to supply seen at 0.9825-0.9801, simply due to the higher-timeframe confluence seen here. Should price strike this area today/this week, we would, dependent on the time of day, look to sell from here at market, with stops sited at 0.9827, targeting 0.9750 as an initial take-profit zone.
Data points to consider: FOMC Member Dudley speaks at 1pm GMT+1.
Levels to watch/live orders:
- Buys: Flat (stop loss: N/A).
- Sells: 0.98 (stop loss: 0.9827).
DOW 30:
Weekly gain/loss: 99 points
Weekly closing price: 21353
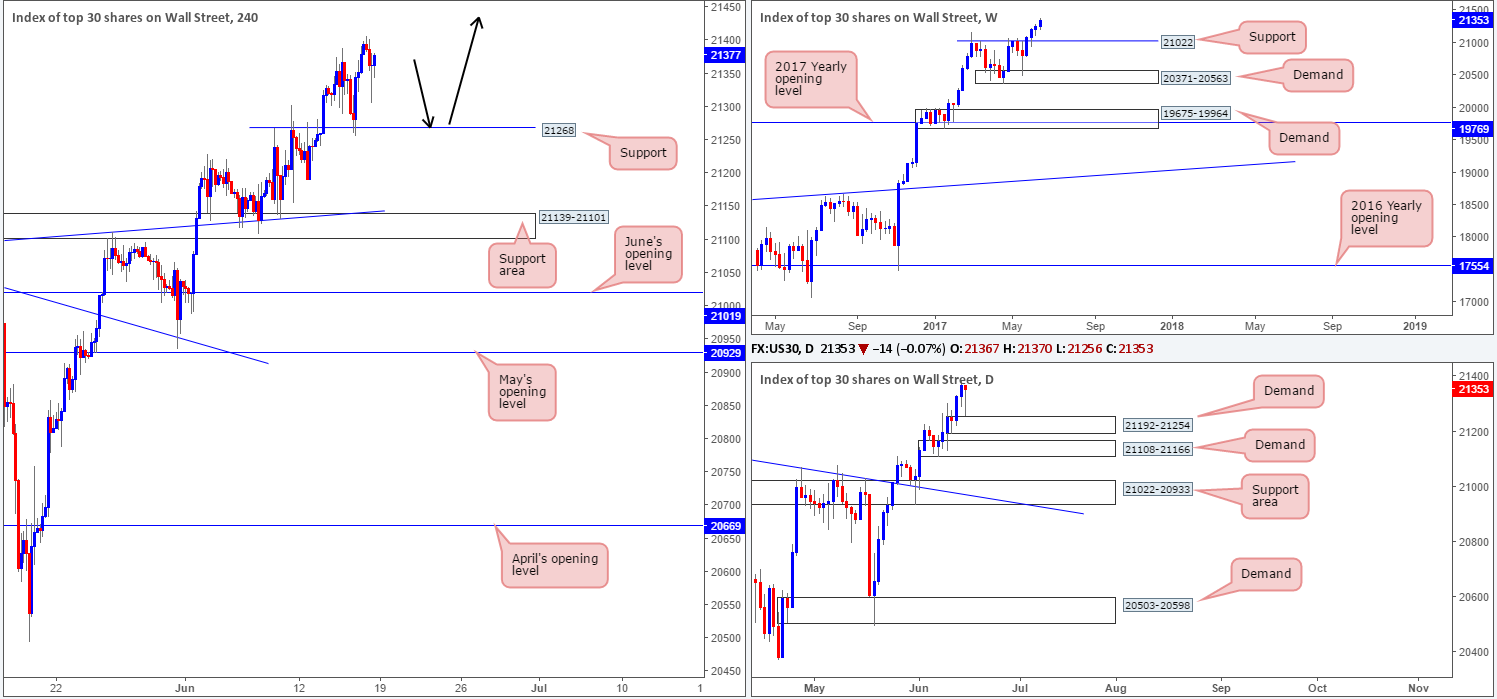
US equities climbed higher for a fourth consecutive week, managing to record a fresh record high of 21388. If the unit was to pullback, the weekly support level drawn from 21022 would likely be where you’ll find price stabilize and potentially bounce.
Turning our attention to the daily timeframe, Friday’s candle printed a rather nice-looking buying tail off the top edge of a minor demand at 21192-21254. This – coupled with there being absolutely no higher-timeframe resistance seen ahead, likely implies that further buying could be seen this week.
For those who have been following our reports over the past few days you may recall that our desk recently took a small long position at 21164 and initially placed stops below the H4 support area (21139-21101) at 21097. The position is still active, but we have liquidated 50% of the trade around the 21234 neighborhood.
Fortunately, the index has continued to push higher, as we are now trailing this market with the remainder of our position. The stop-loss order has been moved to 21247, a few points below the current H4 support at 21268, putting our overall gain into respectable numbers.
Our suggestions: Personally, we are looking for price to continue rallying, as we intend on trailing this trend long term. Should a second retest of 21268 be seen this week, bolstered by a full or near-full-bodied bullish candle, we may look to add to our current position (as per the black arrows) and trail accordingly.
Data points to consider: FOMC Member Dudley speaks at 1pm GMT+1.
Levels to watch/live orders:
- Buys: 21164 ([live] stop loss: 21247). 21268 region ([waiting for a reasonably sized H4 bull candle – preferably a full-bodied candle – to form before pulling the trigger is advised] stop loss: ideally beyond the candle’s tail).
- Sells: Flat (stop loss: N/A).
GOLD:
Weekly gain/loss: – $13.4
Weekly closing price: 1253.7
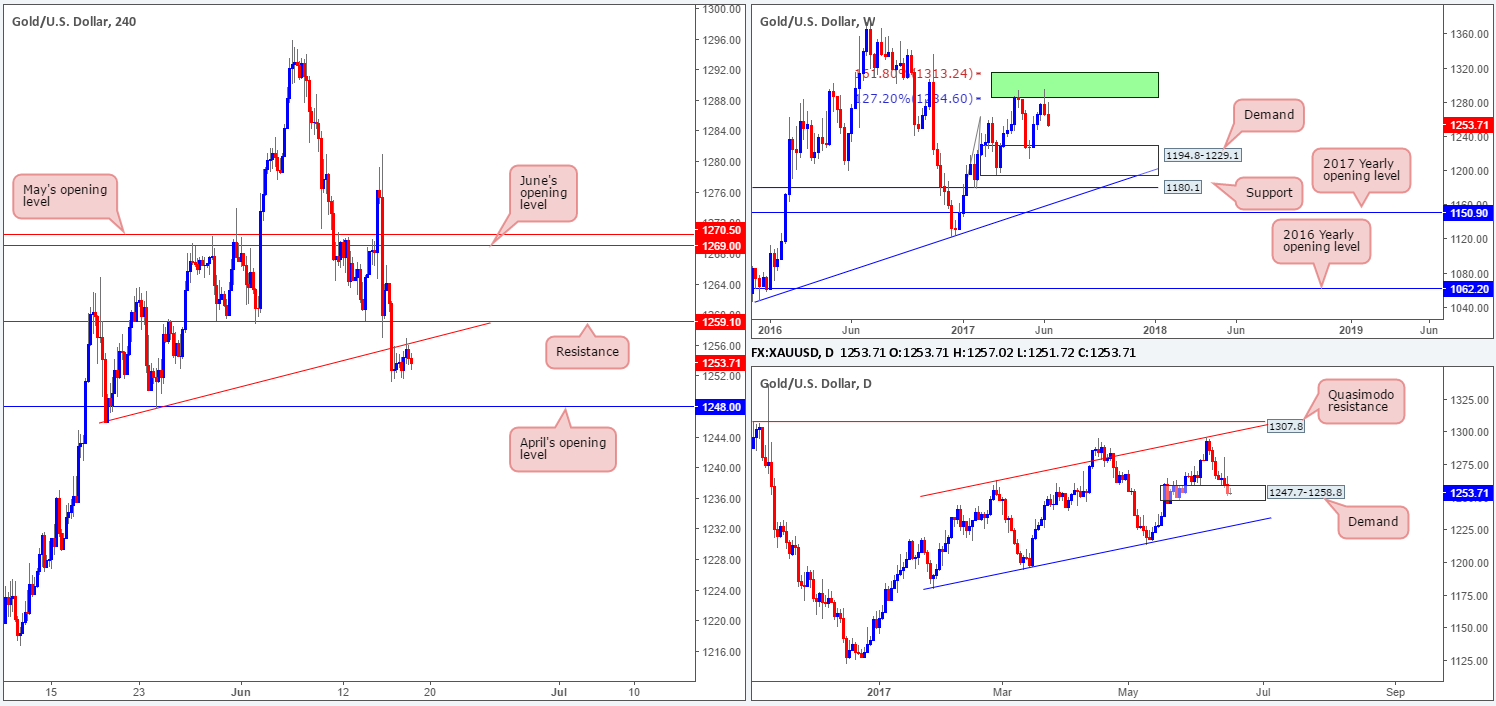
The yellow metal sustained further losses last week, following the prior week’s rejection from an area comprised of two weekly Fibonacci extensions 161.8/127.2% at 1313.7/1285.2 taken from the low 1188.1 (green zone). From the weekly scale, there’s room for the precious metal to continue pumping lower until we reach the demand base coming in at 1194.8-1229.1.
Daily price is still seen teasing the demand base coming in at 1247.7-1258.8, but remains vulnerable. Pressure from weekly sellers could see this area consumed, which in turn would likely bring the candles down to the channel support taken from the low 1180.4 (intersects with the above said weekly demand base).
A brief look at recent dealings on the H4 chart shows bullion retested the underside of the recently broken trendline support taken from the low 1249.3 for a second time, and held firm. The next level of interest below is April’s opening line at 1248.0.
Our suggestions: Buying from within the current daily demand is not something we’d feel comfortable with given the position of both weekly and H4 price at the moment.
With daily price showing signs of weakness within the current daily demand, and H4 action indicating space to move down to at least April’s opening level at 1248.0, as well as weekly price also reflecting a strong bearish stance, we believe the bears may take the lead this week. Therefore, should H4 price retest the said H4 trendline resistance for a third time and form a reasonably sized H4 bear candle, shorts are an option, with 1248.0 being the initial take-profit target. A decisive H4 close beyond here would likely attract further selling down to the top edge of the weekly demand at 1229.1.
Levels to watch/live orders:
- Buys: Flat (stop loss: N/A).
- Sells: Watching for H4 price to retest the current H4 trendline resistance and form a reasonably sized H4 bear candle (stop loss: ideally beyond the candle’s wick).


