
A note on lower timeframe confirming price action…
Waiting for lower timeframe confirmation is our main tool to confirm strength within higher timeframe zones, and has really been the key to our trading success. It takes a little time to understand the subtle nuances, however, as each trade is never the same, but once you master the rhythm so to speak, you will be saved from countless unnecessary losing trades. The following is a list of what we look for:
- A break/retest of supply or demand dependent on which way you’re trading.
- A trendline break/retest.
- Buying/selling tails/wicks – essentially we look for a cluster of very obvious spikes off of lower timeframe support and resistance levels within the higher timeframe zone.
- Candlestick patterns. We tend to stick with pin bars and engulfing bars as these have proven to be the most effective.
We search for lower timeframe confirmation between the M15 and H1 timeframes, since most of our higher-timeframe areas begin with the H4. Stops are usually placed 3-5 pips beyond confirming structures.
EUR/USD:
Weekly gain/loss: – 103 pips
Weekly closing price: 1.0451
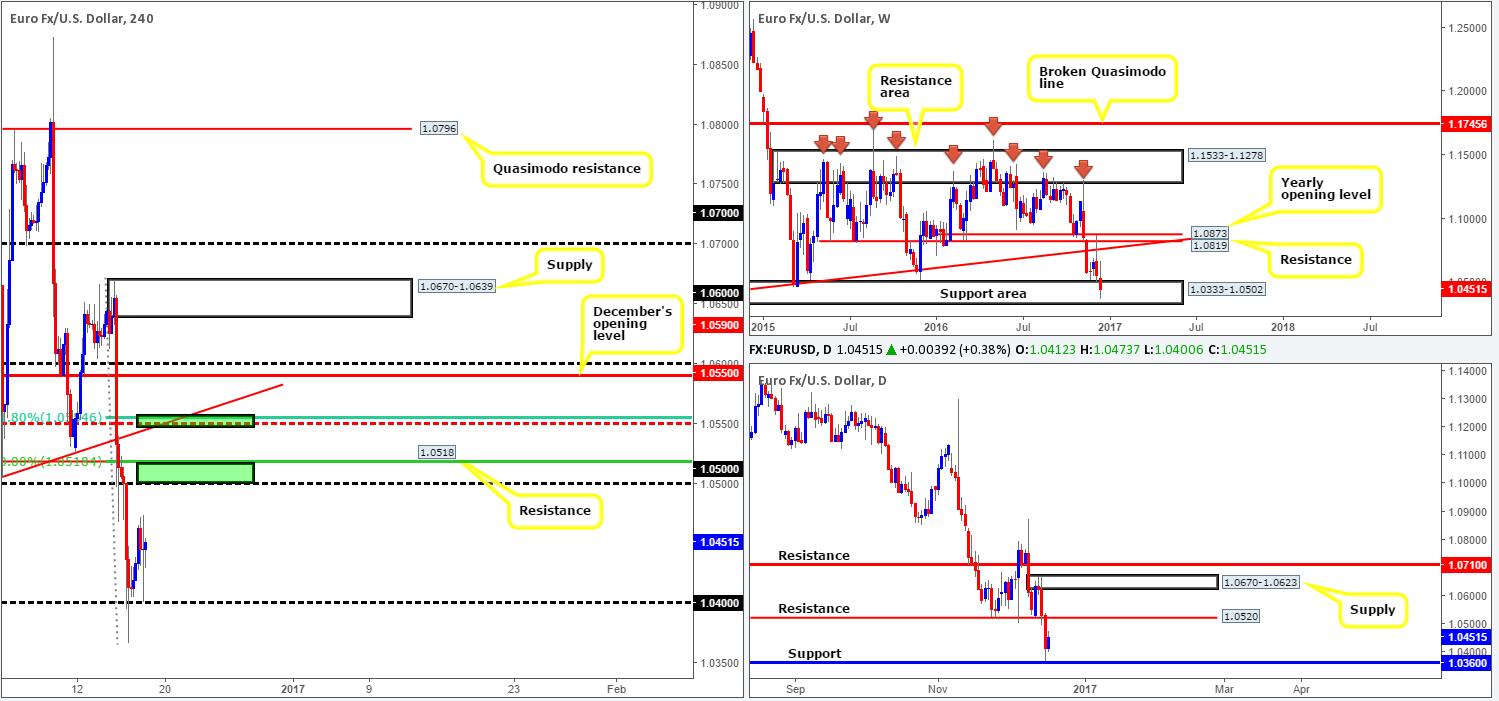
Weekly view: Motivated by the Fed’s decision to increase the benchmark interest rate 25 bps on Wednesday, the shared currency sustained further losses last week. This, as you can see, drove the pair deeper into a major support area chiseled in at 1.0333-1.0502, which can be seen stretching as far back as 1997. Despite the small end-of-week correction seen from last week’s candle, traders still need to be prepared for the possibility of further selling in the weeks ahead, given the dollar’s current position both technically and fundamentally. In the event of a breakdown through the current area, the next barrier in the spotlight falls in at 1.0138, a support level that also claims an impressive history.
Daily view: In conjunction with the weekly candles, the pair managed to catch a bid from just ahead of support coming in at 1.0360 going into the later hours of Thursday’s segment. On the grounds that this level is seen fixed within the aforementioned weekly support area, price could potentially rally from here to connect with resistance seen at 1.0520 sometime this week. Conversely, a sustained move below the current daily support could portend further selling down towards a demand area penciled in at 1.0205-1.0273, which happens to be located just below the weekly support zone.
H4 view: A quick recap of Friday’s trade on the H4 chart shows that following Thursday’s whipsaw through the 1.04 handle, the major managed to find a ledge to pull itself up to highs of 1.0473. Seen close by are two upside objectives (green rectangles). The first comes in at 1.0518/1.05, formed by a 50.0% Fib resistance level and a psychological boundary, as well as a resistance which lines up beautifully with the Fib line. Of particular interest here is also the fact that daily resistance at 1.0520 is located just 2 pips above this area! The second zone can be seen a little higher up around the mid-way resistance point at 1.0550. It boasts both a 61.8% Fib resistance line at 1.0554 and a trendline resistance extended from the low 1.0504.
Direction for the week: Although the dollar is in a relatively strong position at present, we feel the EUR may pullback this week, given the higher-timeframe structure in play. With that being said, our team believes that the market will struggle to sustain gains beyond the nearby daily resistance level at 1.0520, despite weekly price currently being surrounded by a weekly support area.
Direction for today: In view of the support established around the 1.04 region on Friday, additional upside could be on the cards today at least until the 1.05 base.
Our suggestions: Shorting from either of the two mentioned H4 areas highlighted above in bold is valid, in our book. Nevertheless, one still needs to tread carefully here! We would not recommend selling here without the help of a lower-timeframe confirming sell signal. This could either be a break below demand followed by a retest, a trendline break/retest or simply a collection of well-defined selling wicks around the said zones. We search for lower-timeframe confirmation between the M15 and H1 timeframes, since most of our higher-timeframe areas begin with the H4. Stops are usually placed 3-5 pips beyond confirming structures.
Data points to consider: German ifo business climate report at 9am GMT.
Levels to watch/live orders:
- Buys: Flat (stop loss: N/A).
- Sells: 1.0518/1.05 ([lower-timeframe confirmation required prior to pulling the trigger] stop loss: dependent on where one confirms the area). 1.0550 region ([lower-timeframe confirmation required prior to pulling the trigger] stop loss: dependent on where one confirms the area).
GBP/USD:
Weekly gain/loss: – 89 pips
Weekly closing price: 1.2482
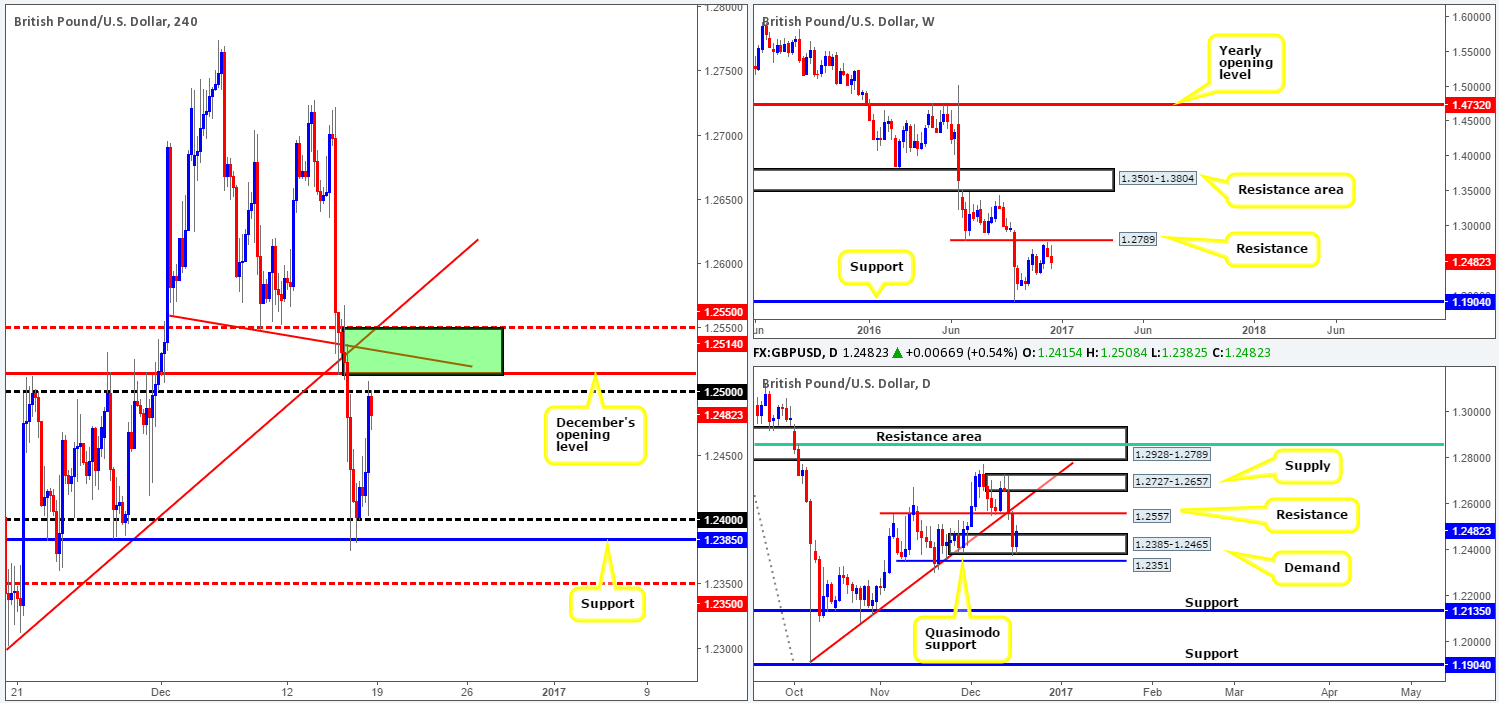
Weekly view: Following the selloff from just ahead of resistance seen at 1.2789 two weeks back, the pair, bolstered by the Fed’s decision to hike rates, continued to slide lower last week. Since July 2014, this market has been entrenched within a downward trajectory. Providing that the current resistance line maintains a defense, fresh lows beyond support at 1.1904 could be on the hit list in the near future.
Daily view: Demand at 1.2385-1.2465, as you can see, managed to cap downside going into Thursday’s close which followed through with an upside rotation on Friday. Trimming around 50% of Thursday’s losses, Friday’s move could spark a further round of buying from this base today/this week up to resistance seen at 1.2557. A break above here, however, will likely see price shake hands with supply marked at 1.2727-1.2657. In the event that the bulls are unable to sustain Friday’s momentum, nonetheless, a drop below the demand area to a nearby Quasimodo support level at 1.2351 may come into view.
H4 view: During the early hours of Friday’s US session, the H4 candles shifted northbound and ended the week bumping heads with the psychological resistance level 1.25. Although this boundary held going into the week’s closing bell, there’s a far more appealing area seen just above (green rectangle) between the mid-way resistance 1.2550 and December’s opening level at 1.2514, which houses two trendline resistances taken from the lows 1.2559/1.2113.
Direction for the week: With buying currently being seen from daily demand and further selling over on the weekly chart, our team has stamped medium-term direction as restricted for the time being.
Direction for today: While the bears established minor resistance around 1.25 late Friday, we feel price will break above this hurdle today and attack offers seen within our aforementioned H4 sell zone (see above in bold).
Our suggestions: Selling from the above noted H4 sell zone is, of course, an option today. We’re confident that a bounce will be seen from this region given the direction of the weekly candles at the moment. Be that as it may, there is a risk of daily buyers forcing price beyond this zone seeing as how the daily resistance level is positioned just 7 pips above it! As a result, the H4 area will only be considered a valid base to sell from if, and only if, a reasonably sized H4 bearish close is seen from here.
Data points to consider: There are no high-impacting news events on the docket today relating to these two markets.
Levels to watch/live orders:
- Buys: Flat (stop loss: N/A).
- Sells: 1.2550/1.2514 ([reasonably sized H4 bearish close required prior to pulling the trigger] stop loss: ideally beyond the trigger candle).
AUD/USD:
Weekly gain/loss: – 148 pips
Weekly closing price: 0.7298
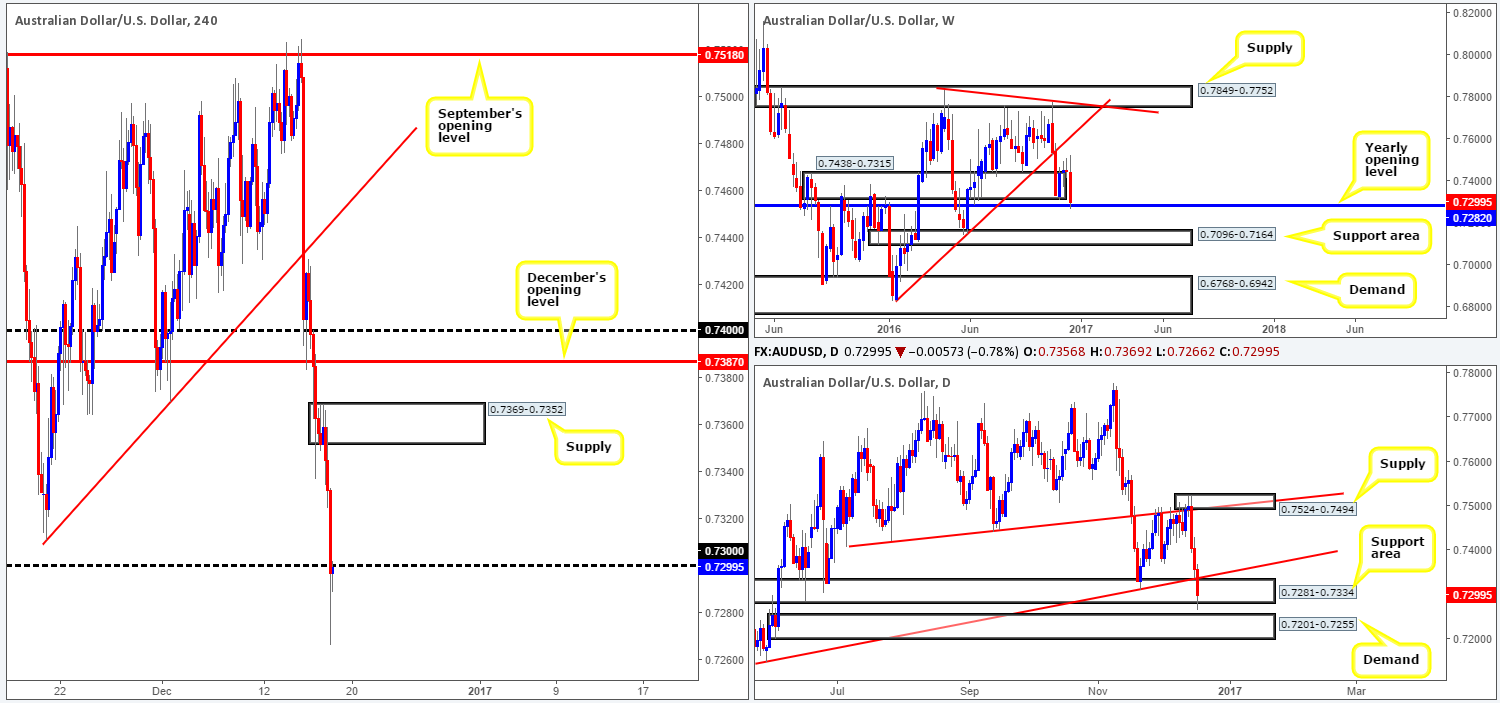
Weekly view: Although the weekly candles established a base around the support area coming in at 0.7438-0.7315 in recent weeks, the bid-side of this market came under significant pressure last week. As can be seen from the chart, the strength behind the downside move was enough to force the pair beyond the support zone and into the 2016 yearly opening level at 0.7282. Should the buyers fail to defend this region this week, we may see price head down to the support area at 0.7096-0.7164.
Daily view: The story on the day chart shows that price entered into a steep three-day bearish descent last week, sparked by the Fed hiking interest rates. The move, as we hope is demonstrated clearly on the chart, closed the week by whipsawing through the lower edge of a support area given at 0.7281-0.7334. While there is a possibility that a pockets of stops were taken from beneath this zone, thus weakening the buyers, price will not likely drop far since there’s a strong-looking demand base lurking just below at 0.7201-0.7255.
H4 view: Mid-way through Friday’s London session, the commodity currency resumed its decline against the US dollar, ending the day breaking below and retesting the 0.73 handle as resistance. Looking at this market solely through the H4 window, we would expect further selling to be seen down to a fresh demand coming in at 0.7218-0.7231. That is, of course, assuming that offers remain strong around 0.73!
Direction for the week: With the 2016 yearly opening level now in play, bolstered by a nearby fresh daily demand at 0.7201-0.7255, the buyers could possibly make an appearance this week and recoup some of last week’s losses.
Direction for today: The psychological band 0.73 is key today. A bearish resumption from this number will likely send the unit down to the daily demand area mentioned above at 0.7201-0.7255, and maybe even the H4 demand seen within it at 0.7218-0.7231. Conversely, a break back up 0.73 could prompt an advance towards H4 supply seen at 0.7369-0.7352.
Our suggestions: The H4 demand at 0.7218-0.7231 is considered, at least by our desk, to be a high-probability buy zone. Not only is it positioned within a fresh daily demand area, but it is also located nearby the yearly opening level. Well, close enough to help facilitate a fakeout through the yearly level, that is! We would, dependent on the time of day, look to buy from the H4 demand base at market with stops set a few pips below the zone. Conservative traders, however, may opt to place stops below the daily demand as this would avoid any fakeout that may take place through the H4 area.
Should 0.73 establish a support on the other hand, one could also look to buy from here, targeting the above said H4 supply. Still, we would recommend waiting for both a retest and at least a H4 bull candle to form as confirmation, before looking to press the buy button.
Data points to consider: There are no high-impacting news events on the docket today relating to these two markets.
Levels to watch/live orders:
- Buys: Watch for a close back above 0.73 and look to trade any retest seen thereafter ([H4 bull candle required following the retest before pulling the trigger] stop loss: ideally beyond the trigger candle). 0.7218-0.7231 ([an area, dependent on the time of day, fit for a market/pending order] stop loss: aggressive – 0.7216 conservative – 0.7298).
- Sells: Flat (stop loss: N/A).
USD/JPY:
Weekly gain/loss: +275 pips
Weekly closing price: 117.90
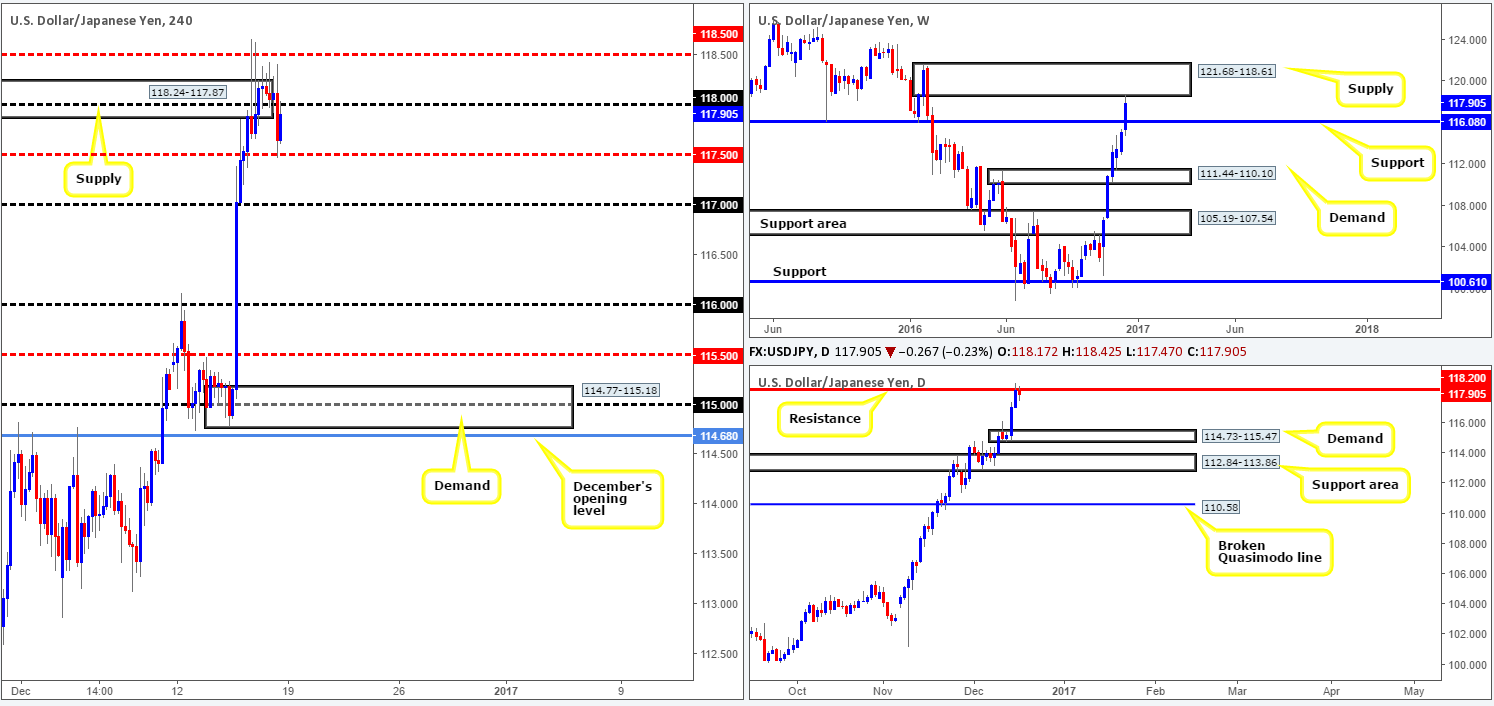
Weekly view: Last week’s rally, strengthened by the Fed raising interest rates, marked the sixth consecutive bullish week for the pair, resulting in price engulfing resistance seen at 116.80 (now acting support). In addition to this, we can also see that price struck the underside of a robust-looking supply zone coming in at 121.68-118.61. Could this area be enough to halt buying this week?
Daily view: Alongside weekly action, daily flow also checked in with a resistance level at 118.20 that boasts reasonably attractive history. So far this level has managed to hold firm, and could help facilitate a downside move this week towards demand logged in at 114.73-115.47. On the assumption that the resistance level gives way, nevertheless, the river north appears ripple free to supply seen at 121.68-120.96, which effectively denotes the top edge of the aforementioned weekly supply zone.
H4 view: Based on Friday’s trading action, the H4 candles spent the majority of the day chalking up bearish selling wicks that pierced through the top edge of a supply area coming in at 118.24-117.87. It was only once London closed its doors for the week did we see the pair descend lower, consequently closing below and retesting the 118 handle as resistance into the NY close.
Direction for the week: Technically speaking, the pair is registering overbought conditions right now, and could pressure the USD/JPY to pullback this week to weekly support at 116.08. However, the dollar is fundamentally very strong! So a close above daily resistance is certainly not out of the question.
Direction for today: In that the H4 candles closed the week respecting the underside of 118, a selloff could be seen today back down to the H4 mid-way support at 117.50 today, and quite possibly the 117 barrier.
Our suggestions: Wait for a lower timeframe sell signal to form off the 118 level (see the top of this report). Should this come to realization, we’d look to take 50% of our position off at 117.50 and reduce risk to breakeven, leaving the remaining 50% to run down to either 117 or back up to our breakeven stop.
Data points to consider today: There are no high-impacting news events on the docket today relating to these two markets.
Levels to watch/live orders:
- Buys: Flat (stop loss: N/A).
- Sells: 118 region ([lower-timeframe confirmation required prior to pulling the trigger] stop loss: dependent on where one confirms the area).
USD/CAD:
Weekly gain/loss: + 165 pips
Weekly closing price: 1.3334
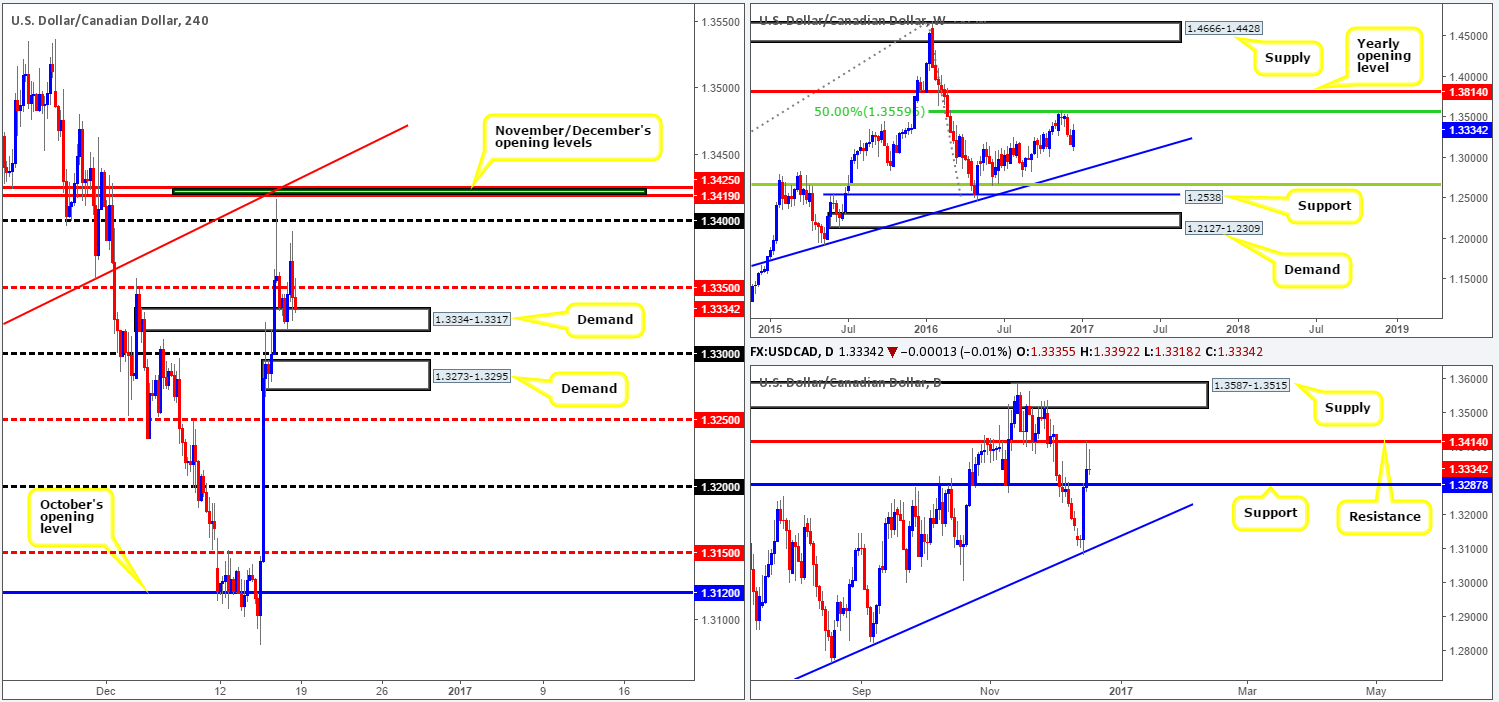
Weekly view: Over the last week the tables clearly turned in favor of the bulls, concluding the week reclaiming the prior week’s losses and forming a beautiful-looking bullish engulfing candle. However, to our way of seeing things right now, price could essentially move in either direction this week. To the upside we have the 50.0% Fib resistance at 1.3559 in sight, and below is a trendline support seen taken from the high 1.1278.
Daily view: Driven by the Fed’s decision to hike rates on Wednesday, the unit rebounded from a trendline support extended from the low 1.2460. The move from this angle, as is evident from the chart, took out resistance at 1.3287 (now acting support) and went on to connect with resistance fixed at 1.3414. At the time of writing, both the above said support and resistance levels are of equal weighting, in our view, and therefore will both take center stage in our watchlist this week.
H4 view: A brief look at recent dealings on the H4 chart reveals that demand drawn from 1.3334-1.3317 held beautifully, despite pressure coming in from rising oil prices. On the whole, however, this market is somewhat cramped. Although not as evident on the weekly timeframe, both the daily and H4 charts show limited space to move.
Direction for the week: The weekly bullish engulfing candle may excite traders to begin buying this market, but we’d expect price to struggle around the daily resistance level at 1.3414.
Direction for today: To the downside, even below the current H4 demand, there is little room for price to stretch its legs. Nearby we can see the psychological support 1.33, followed closely by H4 demand at 1.3273-1.3295 and then just beneath that, we have the H4 mid-way support level at 1.3250!
A H4 close back above the mid-way resistance point 1.3350 on the other hand could be of interest to some traders, since this move would likely clear the trail north back up to 1.34 and quite possibly November/December’s opening levels at 1.3425/1.3419.
Our suggestions: For those who are interested in buying this market beyond 1.3350, we would advise waiting to see if price retests this boundary as support before entering long. Should a rejection candle print off this barrier, one could then consider entering long, targeting the 1.34 region. But, do remain vigilant to the fact that in between November/December’s opening barrier and 1.34 sits the daily resistance at 1.3410. Therefore, reducing risk to breakeven and taking some profit off the table at this point is a MUST, in our opinion.
Data points to consider today: There are no high-impacting news events on the docket today relating to these two markets.
Levels to watch/live orders:
- Buys: Watch for a close back above 1.3350 and look to trade any retest (rejection candle) seen thereafter (stop loss: ideally beyond the trigger candle).
- Sells: Flat (stop loss: N/A).
USD/CHF:
Weekly gain/loss: + 97 pips
Weekly closing price: 1.0263
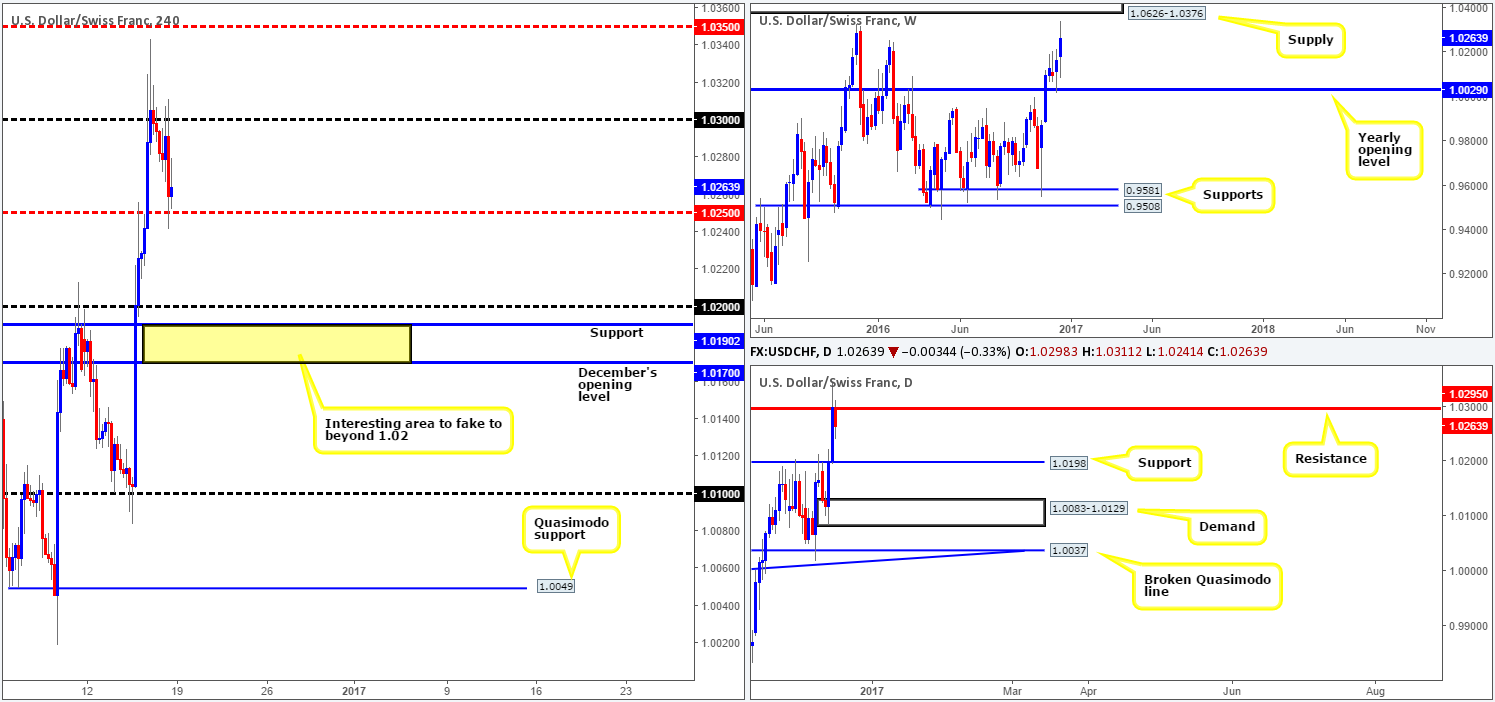
Weekly view: The bullish pulse continued to beat in the USD/CHF market last week. Reinforced by the strong sentiment surrounding the US dollar following Wednesday’s FOMC decision to hike rates, and noted expectation of future increases, the pair managed to clock fresh highs of 1.0343, slightly breaking above a major (23rd Nov 2015) high at 1.0328. Aside from the end-of-week correction, price looks poised to extend north from here to connect with supply derived at 1.0626-1.0376, an area formed back in 2010.
Daily view: The correction seen on the weekly chart is likely the work of a daily resistance level penciled in at 1.0295. As a result, offers here will need to be consumed before a push on up to the aforementioned weekly supply is seen. Yet, on the other side of the field, a follow-through bearish move from the current daily line might see price drop as far down as support sitting at 1.0198.
H4 view: A look at recent H4 action shows that 1.03 held firm during the course of Friday’s trading, and even managed to force the unit to connect with the mid-way support level registered at 1.0250. The response seen from 1.0250, in our view, has so far registered little bullish intention. For that reason, traders need to be prepared for the possibility of further downside to the 1.02 region, as suggested by the daily picture should daily resistance at 1.0295 hold ground.
Direction for the week: Although the Swissy did slightly surpass a major high last week, the correction seen from the daily resistance level is likely to force prices down to at least daily support at 1.0198. As such, a pullback is expected, but overall our team is biased to the upside this week until we connect with the aforementioned weekly supply.
Direction for today: The response seen from the H4 mid-way support at 1.0250 has given rise to the possibility of further selling today down to the 1.02 region.
Our suggestions: Through our analysis, looking for shorts below 1.0250 could something to consider, targeting 1.02. Nevertheless, we would advise waiting for a retest to the underside of this number followed by a lower-timeframe sell signal (see the top of this report for information on this) before pressing the sell button. This can help sidestep an unnecessary loss and also help avoid the dreaded fakeout which is common viewing around psychological barriers!
In addition to the above, once/if price reaches 1.02, be prepared for a fakeout through this level into a nice-looking area (yellow rectangle) of support, composed of December’s opening level at 1.0170 and H4 support at 1.0190. This could, given 1.02 is associated with daily support at 1.0198, be a place to consider buying from this week.
Data points to consider today: There are no high-impacting news events on the docket today relating to these two markets.
Levels to watch/live orders:
- Buys: 1.0170/1.0190 is somewhere traders may want to note as this area could help facilitate a fakeout through the 1.02 boundary.
- Sells: Watch for a H4 close beyond 1.0250 and then look to trade any retest seen thereafter ([a lower-timeframe signal is required following the retest to confirm the sell] stop loss: dependent on where one confirms this area).
DOW 30:
Weekly gain/loss: + 82 points
Weekly closing price: 19848
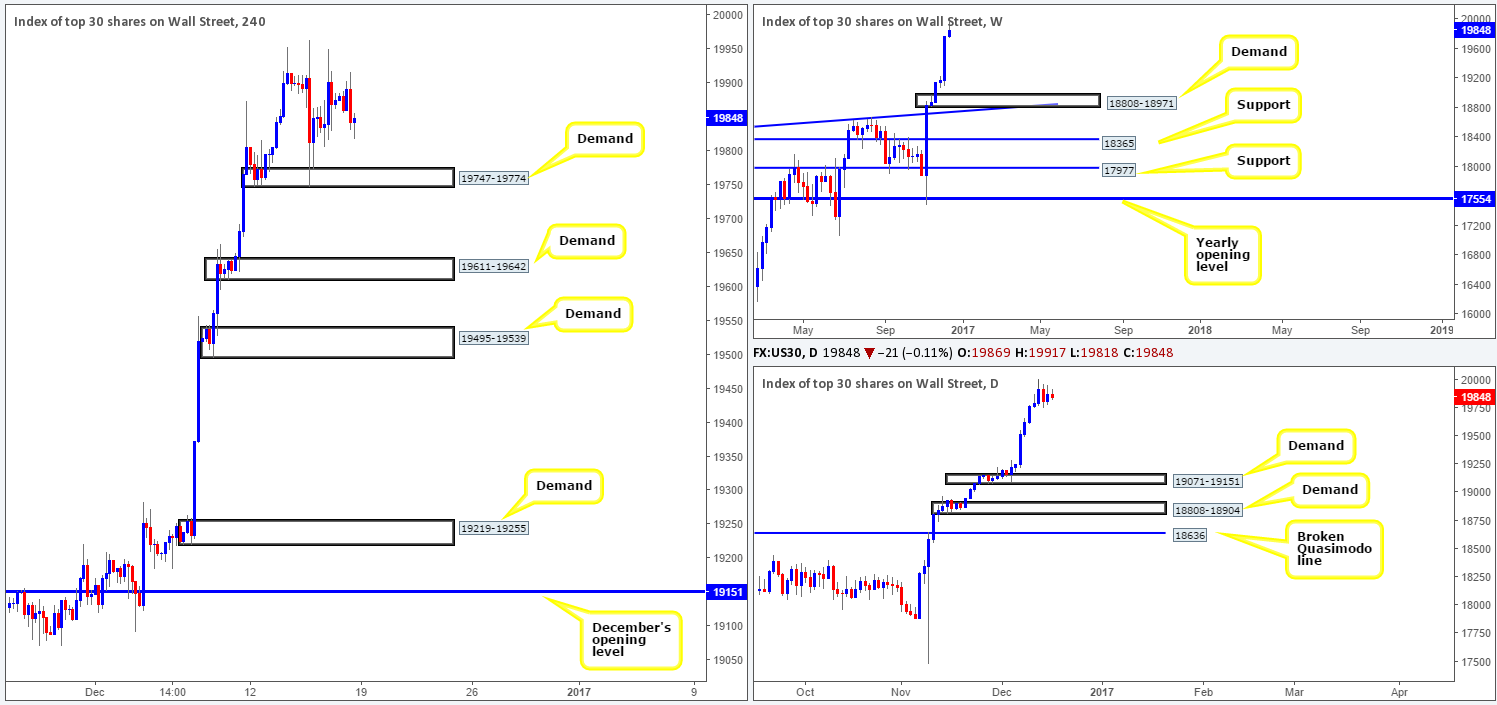
Weekly view: Although the equity market recorded its sixth consecutive weekly gain last week, upside momentum diminished as the week progressed. The reason for last week’s lackluster performance, in our opinion, was simply due to Wednesday’s hike in US rates and also the hawkish response seen from Fed members concerning future interest-rate hikes. Falling only 36 points short of striking the 20000 landmark, we feel there is a good chance that this target will very likely be achieved in the coming week.
Daily view: Looking down to the daily picture, one can see price entered into a small consolidation using Tuesday’s opening and closing points (19795/19916) as the range limits. In the event that the market retraces this week, the next downside target can be seen at a demand drawn from 19071-19151.
H4 view: From this angle, we can see that the H4 candles remain loitering above demand coming in at 19747-19774, and show very little (obvious) resistance ahead.
Direction for the week: Despite last week’s slowdown we believe the 20000 region will be hit next week!
Direction for today: H4 demand at 19747-19774 is likely to be retested today and could, should it hold firm, be a place where active buyers step in to push the market up to 20000.
Our suggestions: Seeing as how the current H4 demand base has already proven itself as somewhere investors would buy from, we will continue to keep an eyeball on this zone today for a second retest. Nevertheless, given the fact that price drove deep into this area on its first test, likely clearing out a truckload of bids in the process, waiting for the lower timeframes to confirm buying interest would, in our book, be the more logical route to take if you plan on entering long from here. Confirming action is considered, by our desk at least, to be either a break above supply followed by a retest, a trendline break/retest or simply a collection of well-defined buying tails around the H4 demand. We search for lower-timeframe confirmation between the M15 and H1 timeframes, since most of our higher-timeframe areas begin with the H4. Stops are usually placed 3-5 pips beyond confirming structures.
Data points to consider today: There are no high-impacting news events on the docket today that will likely cause any considerable moves in this market.
Levels to watch/live orders:
- Buys: 19747-19774 ([lower-timeframe confirmation required prior to pulling the trigger] stop loss: dependent on where one confirms the area).
- Sells: Flat (stop loss: N/A).
GOLD:
Weekly gain/loss: – $26.3
Weekly closing price: 1133.5
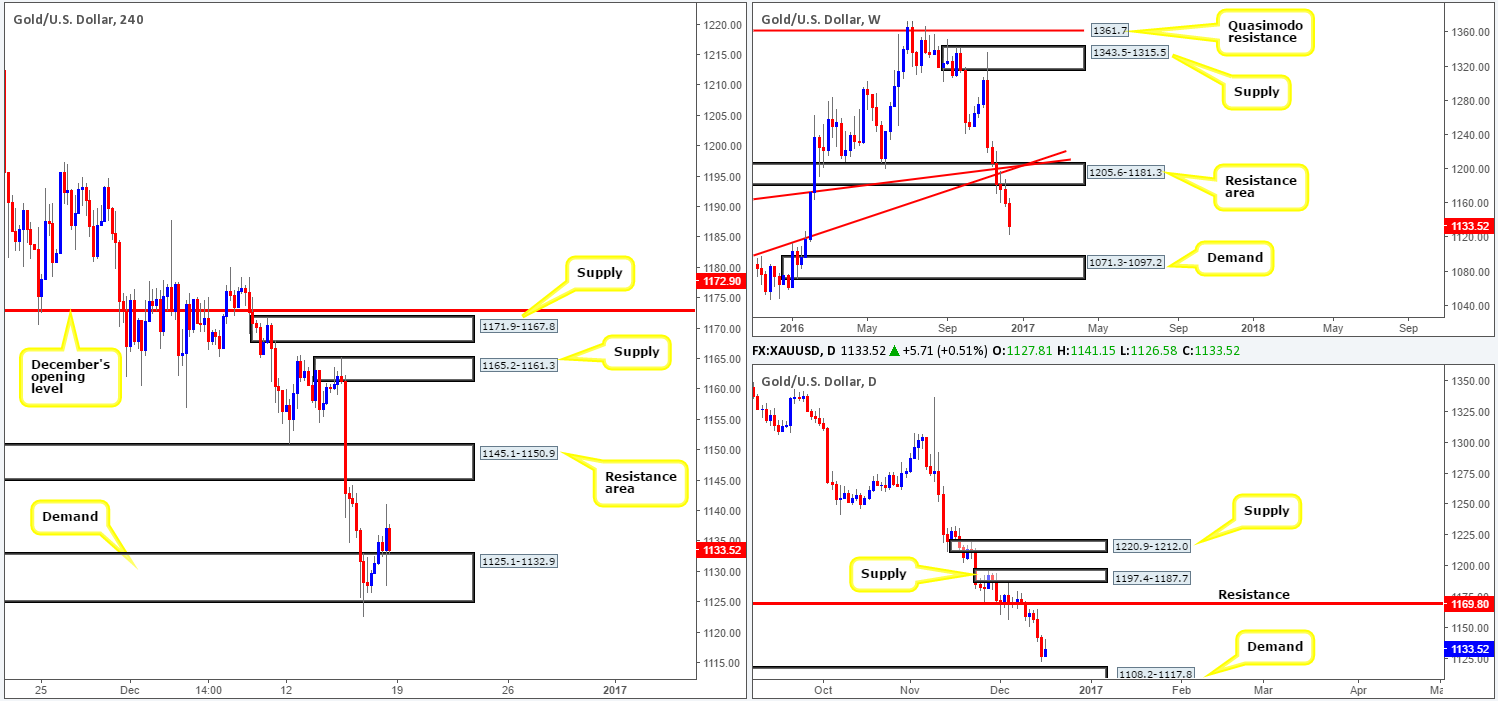
Weekly view: Chalking up its sixth consecutive losing week, gold is at mercy of the dollar! Should dollar strength persist, the yellow metal could shake hands with demand seen at 1071.3-1097.2 sometime this week. In light of this area’s strong momentum from its base, a reaction, at the very least, is expected to be seen from here.
Daily view: Besides weekly action signifying further selling may be on the cards, down here on the daily candles price is seen lurking just ahead of a demand area drawn from 1108.2-1117.8. This zone, similar to the weekly area mentioned above, also boasts strong momentum from its base. For that reason, a bounce from this neighborhood is expected should price interact with this barrier this week.
H4 view: Thursday’s whipsaw through the lower edge of demand at 1125.1-1132.9, as you can see, prompted further buying on Friday reaching highs of 1141.1 on the day. While we’re not discounting the possibility of further buying, we feel that Friday’s ascent was likely a round of short covering going into the week’s end. Should our thinking be correct, the next downside objective seen beyond the current H4 demand is 1110.0: a support level housed within the aforementioned daily demand area.
Direction for the week: Until prices make contact with the above noted daily demand zone, our team remains biased to the downside this week.
Direction for today: With the majority of stops likely consumed from below the current H4 demand, thus weakening bids around this zone, further downside may on the cards today.
Our suggestions: Our desk has reported no interest in buying from the current H4 demand due to buyers likely weakened around this area, and the fact that both weekly and daily price look set to extend lower (see above). Right now, according to the higher-timeframe picture, selling is the better option. However, with the current H4 demand still in play and the top edge of the daily demand area seen nearby at 1117.8, we would be just as cautious selling at the moment.
Levels to watch/live orders:
- Buys: Flat (stop loss: N/A).
- Sells: Flat (stop loss: N/A).


