
EUR/USD:
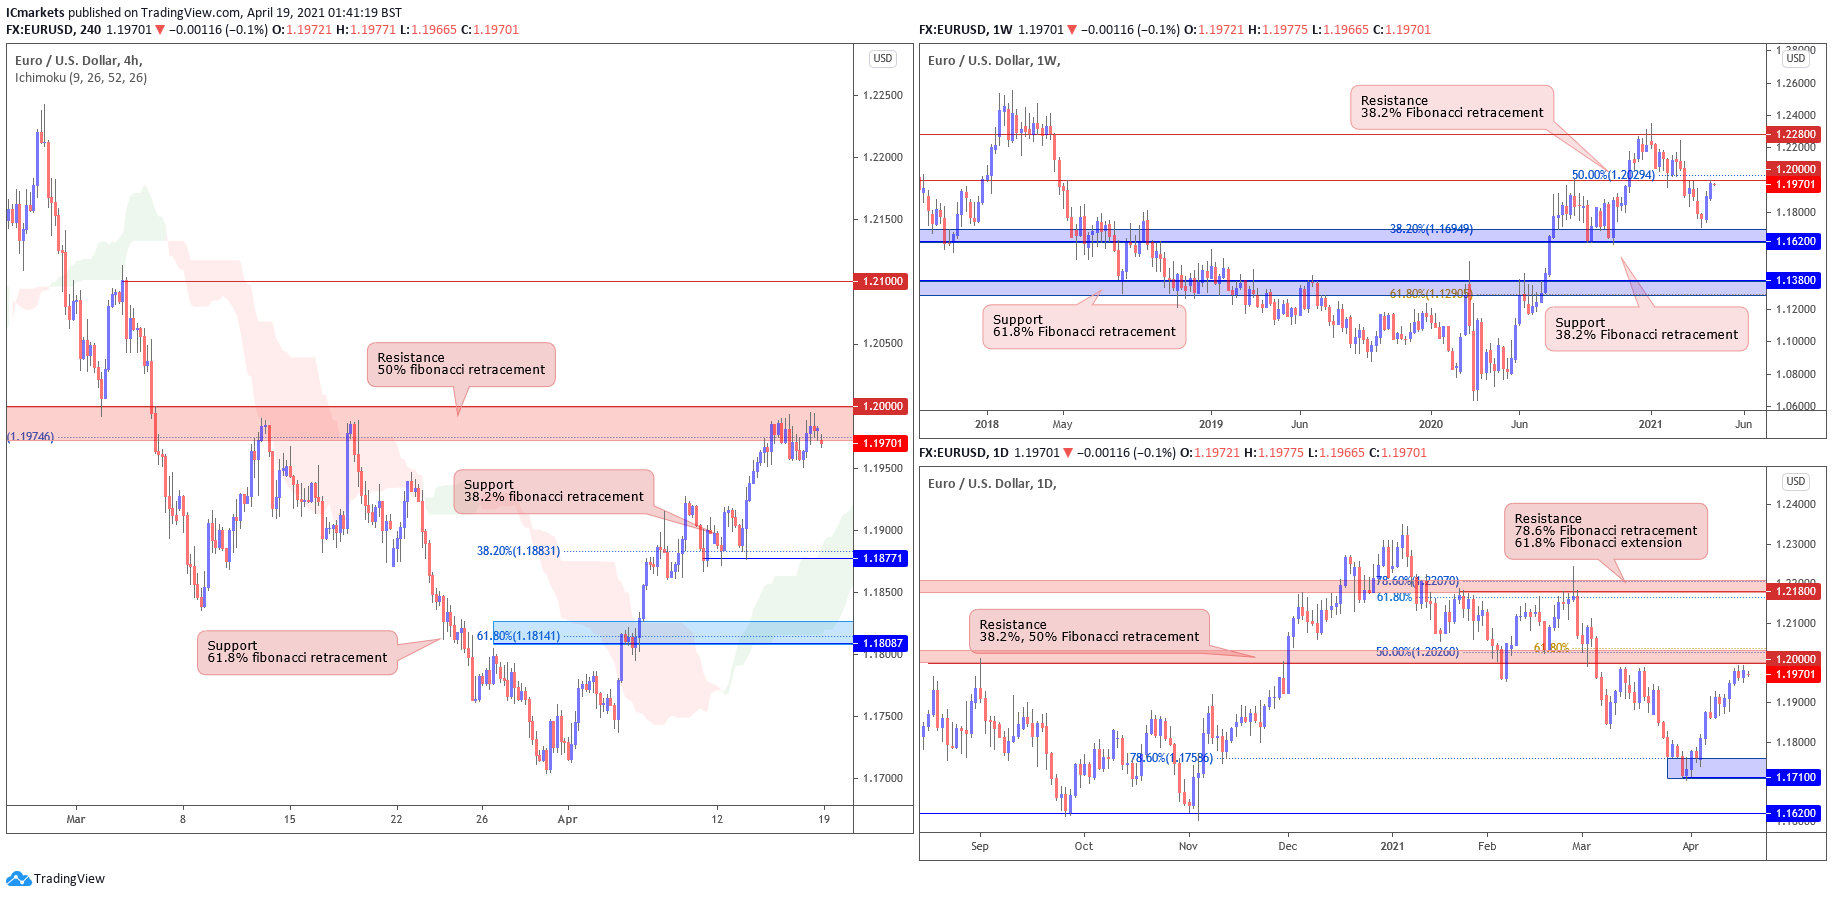
Looking at the weekly chart, we can see that prices are facing bearish pressure from our resistance at 1.2000, in line with our graphical resistance level and 50% fibonacci retracement, where we could see a further drop below this level. On the daily time frame, it echoes the same bearish view as well where we could see a further drop before prices reach its support at 1.17100.
On the H4 timeframe, prices are approaching our resistance at 1.2000 where we could see a reversal below this level to our next support target at 1.18771.
Areas of consideration:
- 20000 resistance area found on H4 time frame
- 18771 support area found on H4 time frame
GBP/USD:
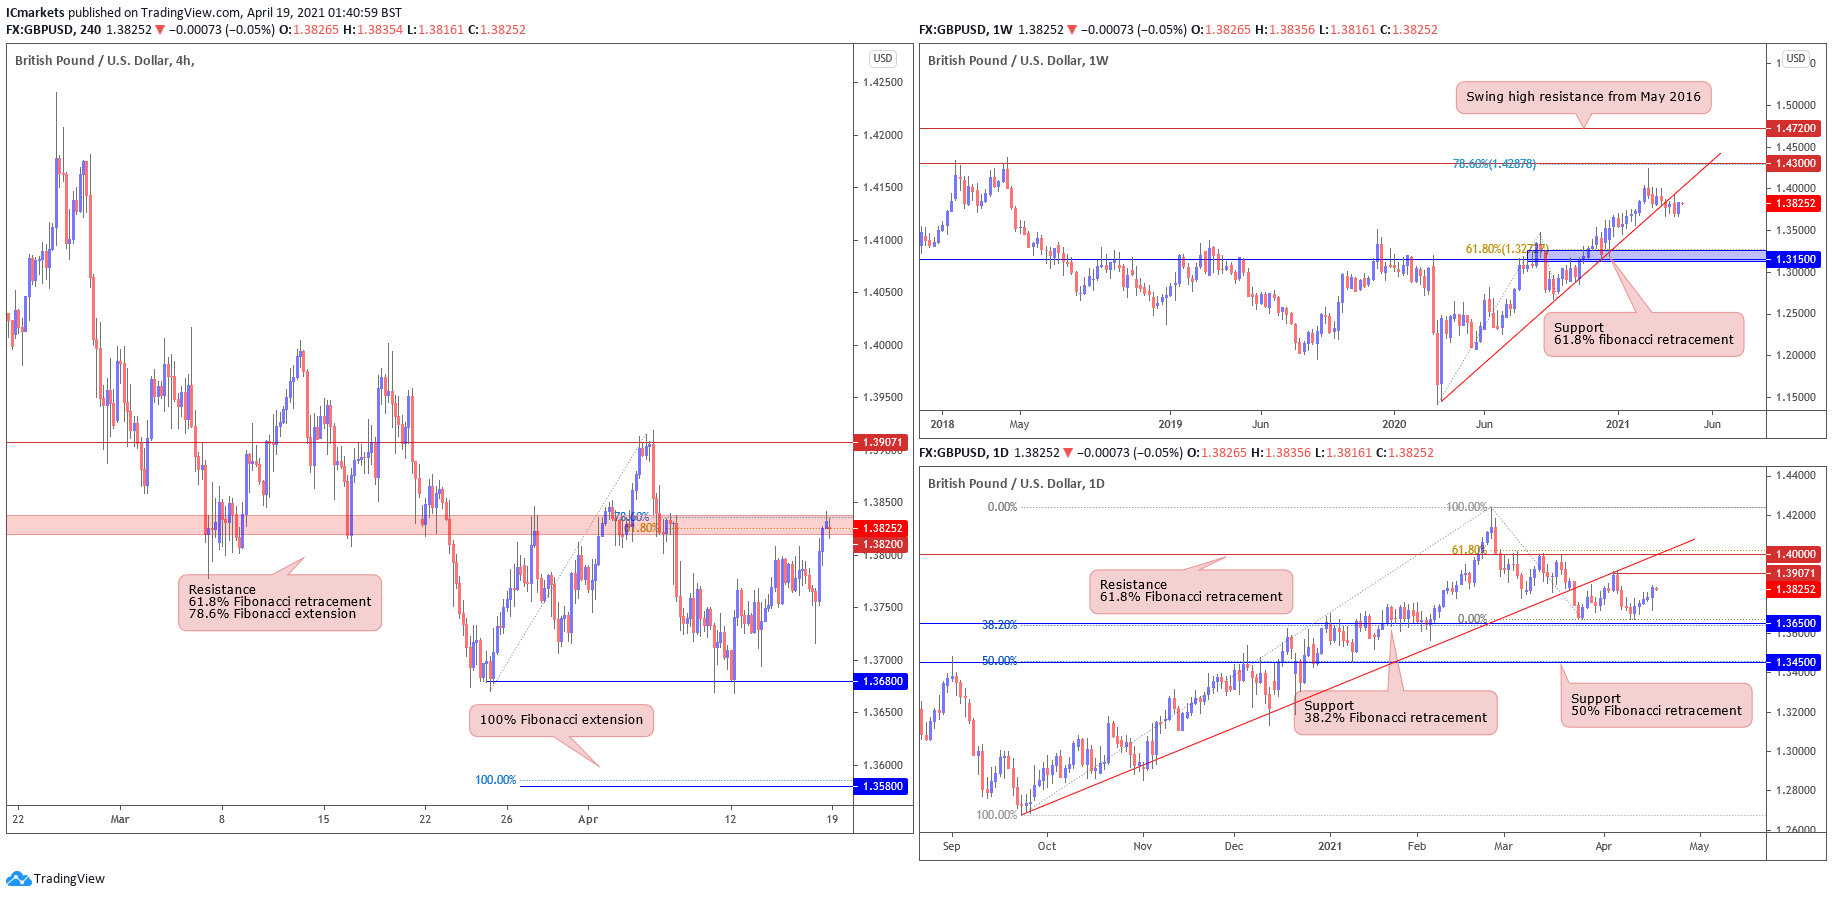
Looking at the weekly chart, we can see that prices broke the ascending support line and are facing bearish pressure from our resistance at 1.43000 and could see a further downside before it reaches our support area at 1.31500. On the daily time frame, prices are approaching our resistance level at 1.39071, in line with our graphical swing high resistance, where we could see a reversal below this level.
On the H4 timeframe, prices are facing bearish pressure from our resistance level at 1.38200 where we could see a reversal below this level to our support target at 1.36800.
Areas of consideration:
- 38200 resistance area found on H4 time frame
- 36800 support area found on H4 timeframe
AUD/USD:
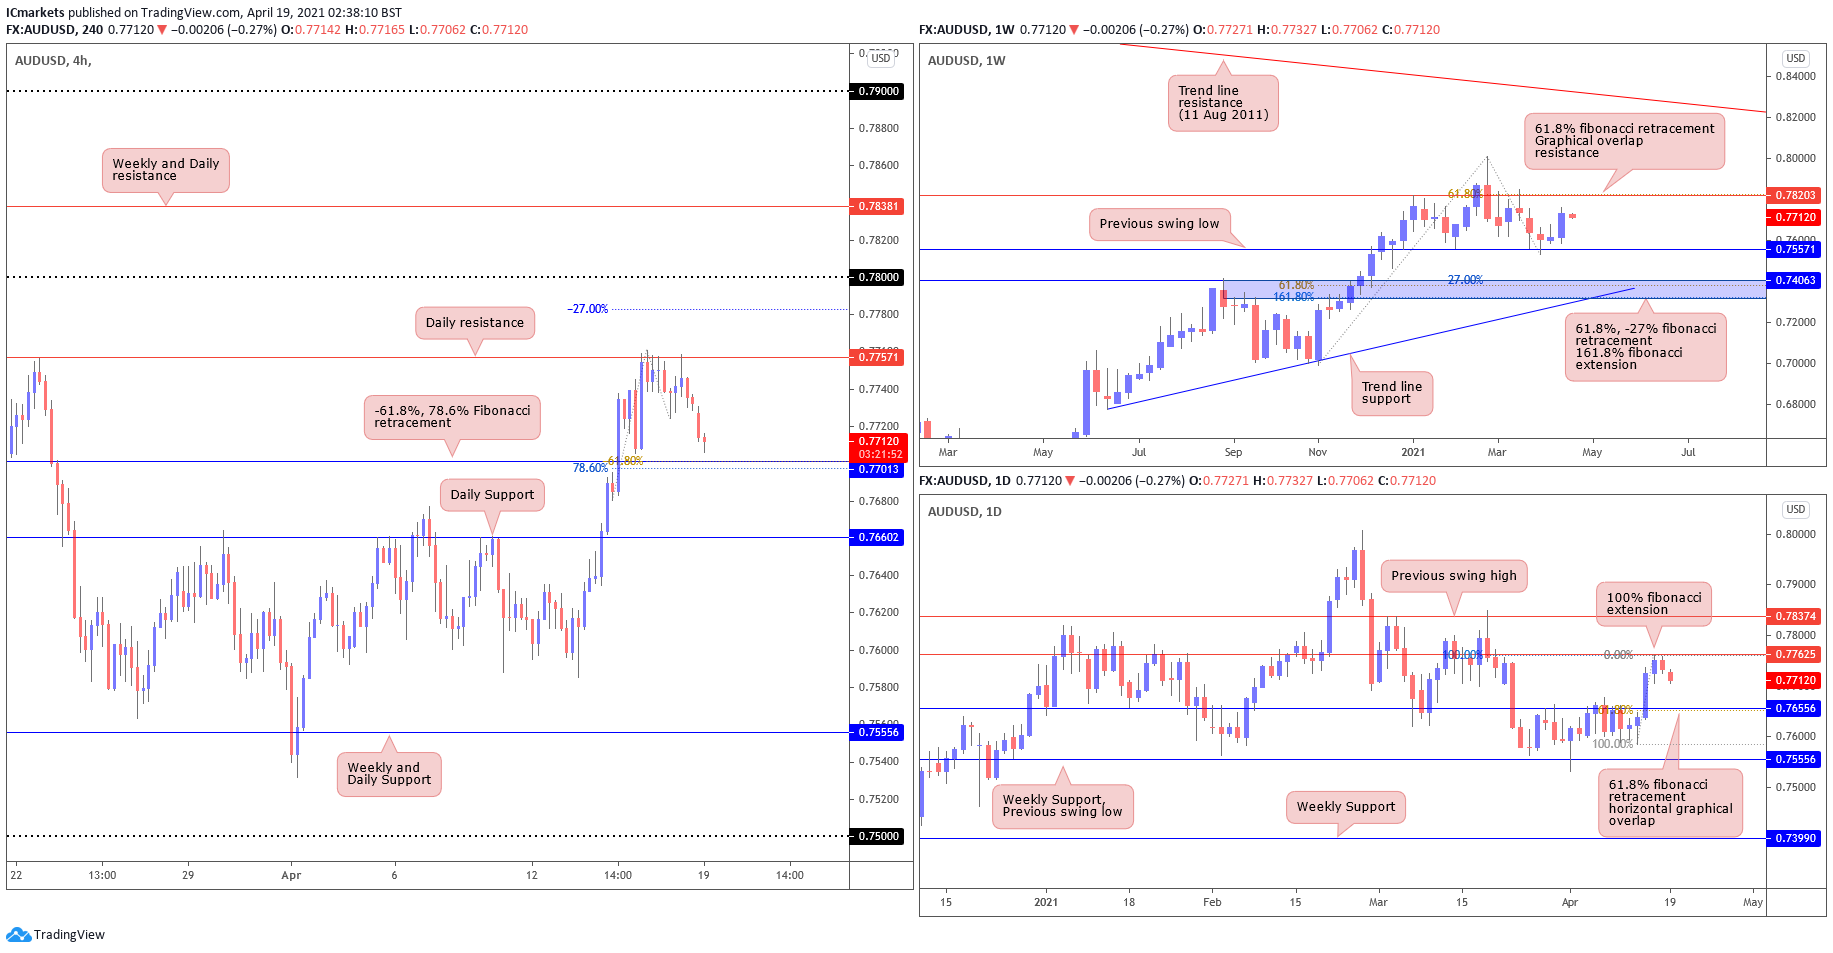
From the Weekly timeframe, prices are holding nicely above the previous swing low of 0.75571 and are pushing upwards towards the 61.8% fibonacci retracement level at 0.78203. Prices are taking support from 0.75571 which is a horizontal pullback support and beneath it is the next support level of 0.74063 in line with -27%, 61.8% Fibonacci retracement and 161.8% Fibonacci extension.
On the daily time frame, price has reversed at 0.77625, in line with 100% Fibonacci extension and horizontal graphical overlap. From here we may see a reaction pushing down to 0.76556, in line with the 61.8% fibonacci retracement level. On the H4, price is approaching the support level of 0.77013, in line with -61.8%, 78.6% Fibonacci retracement where we may potentially see a bounce towards the previous resistance level at 0.77571.
Areas of consideration:
- H4 showing pull back towards fibonacci confluence before pushing higher.
- Daily time frame showing that prices reversed from fibonacci level
- Weekly time frame show bullish momentum.
USD/JPY
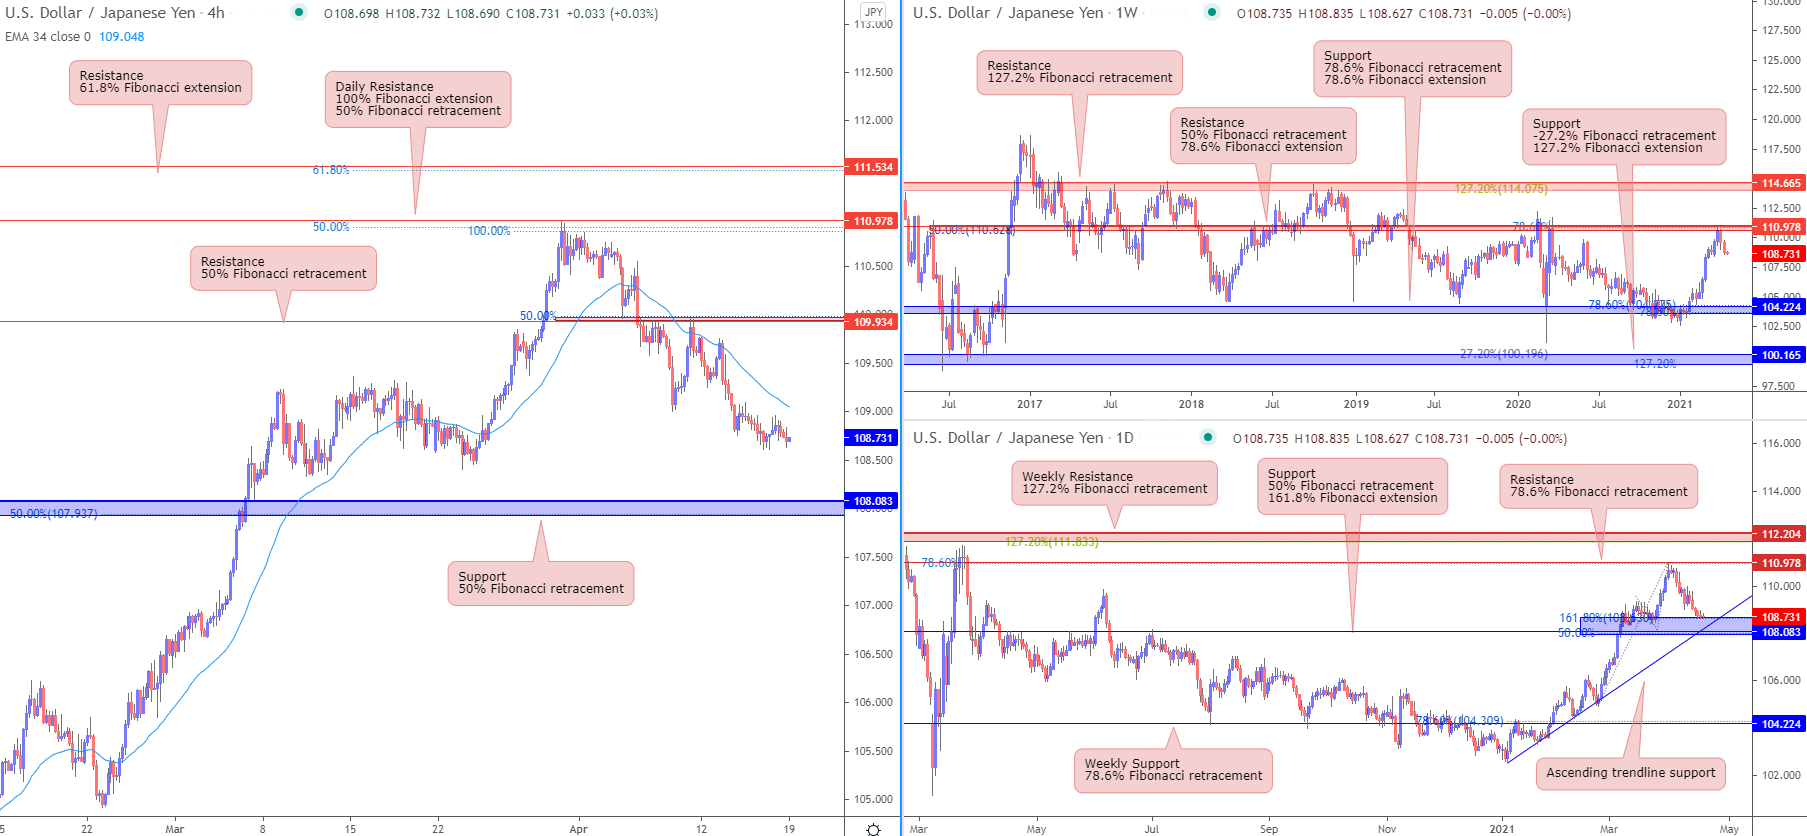
From the weekly timeframe, prices are facing resistance from horizontal swing high resistance which coincides with 50% Fibonacci retracement and 78.6% Fibonacci extension, taking support from 104.224 level which is in line with 78.6% FIbonacci retracement and 78.6% FIbonacci extension. On the daily time frame, prices are facing resistance from both the horizontal swing high resistance which coincides with 78.6% FIbonacci retracement as well as the 112.204 level. Prices are pushing down to take support on ascending trendline support and horizontal pullback support in line with 50% Fibonacci retracement.
On the H4, prices are facing resistance from horizontal swing high resistance which is in line with 50% Fibonacci retracement. Prices might push down further to support which is in line with ascending trend line support on the daily time frame and in line with 50% Fibonacci retracement. EMA is also above prices, showing a bearish pressure for prices.
Areas of consideration:
- On the H4, prices might push down to daily support level of 108.083
- Price facing resistance from 110.978 on weekly
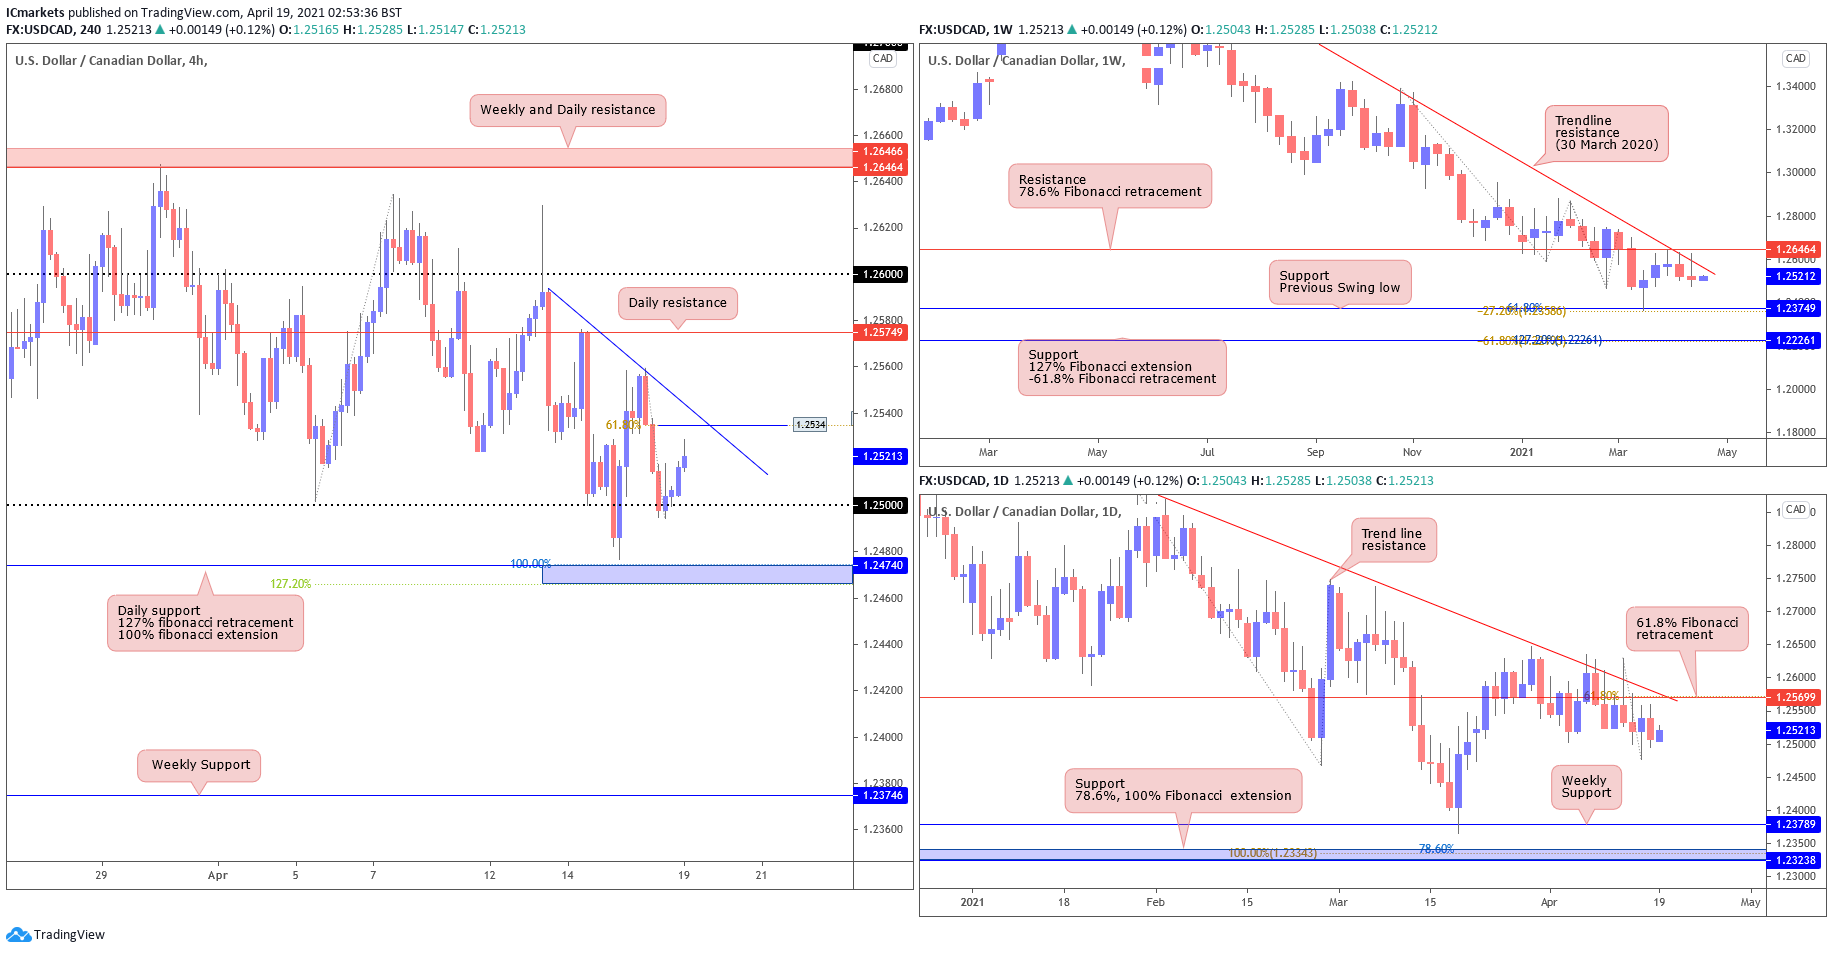
USD/CAD:
The weekly chart shows bearish momentum and may push towards the previous swing low support at 1.23749, in line with -27% fibonacci retracement and 61.8% fibonacci extension. On the daily chart, we see price reversing from 1.25699 level in line with 61.8% fibonacci retracement level where we may see a continuation of this bearish move.
On the H4, as expected, price pulled back to the 1.2555 level in line with 78.6% fibonacci retracement before reversing and approaching the previous Support level. Currently price looks to be making a pull back towards the 1.2534 level in line with the descending trendline and 61.8% fibonacci retracement level where we may see a further push down towards 1.2474.
Areas of consideration:
- The weekly and daily time frame shows bearish momentum
- On H4, price may reversed from 61.8% fibonacci retracement and push down towards 1.2474 major level.
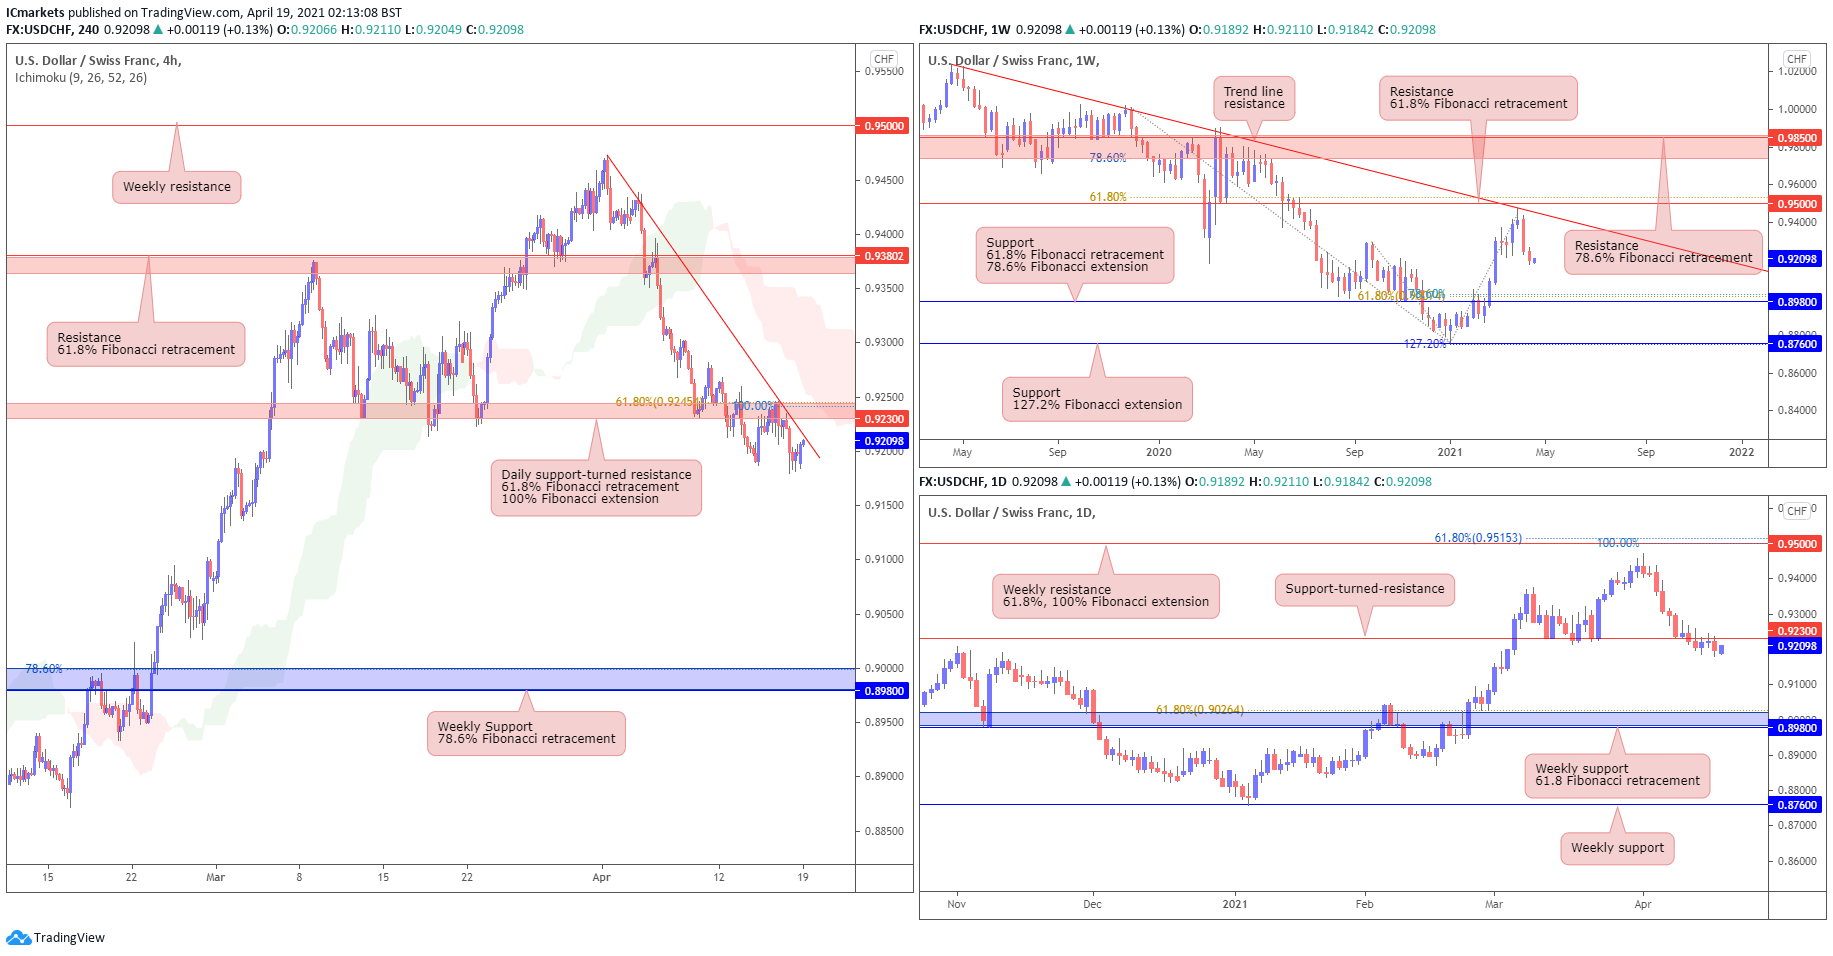
USD/CHF:
USD/CHF has seen a reversal at the descending trendline resistance and is now holding below the weekly 0.95000 resistance level which is in line with our 61.8% Fibonacci retracement. The daily chart shows that price has broken below the key daily 0.92300 support-turned-resistance, re-tested and is now pushing lower. We could potentially see further downside from here towards the next daily 0.89800 support level.
On the H4 chart, we can see that price is pulled back to retest the daily 0.92300 support-turned-resistance, in line with 61.8% Fibonacci retracement and 100% Fibonacci extension. We note that price is also holding below the Ichimoku cloud and descending trendline resistance, showing bearish pressure in line with our bearish bias. We could potentially see it reverse and swing further towards weekly 0.89800 support level, in line with 78.6% Fibonacci retracement. Otherwise, price could also pull back to the re-test descending trendline resistance and 0.92300 support-turned-resistance before pushing lower.
Areas of consideration:
- Price broke below the daily 0.92300 support-turned-resistance level, pulled back to retest it and is now pushing lower.
- We could potentially see price swing towards the next 0.89800 weekly support.
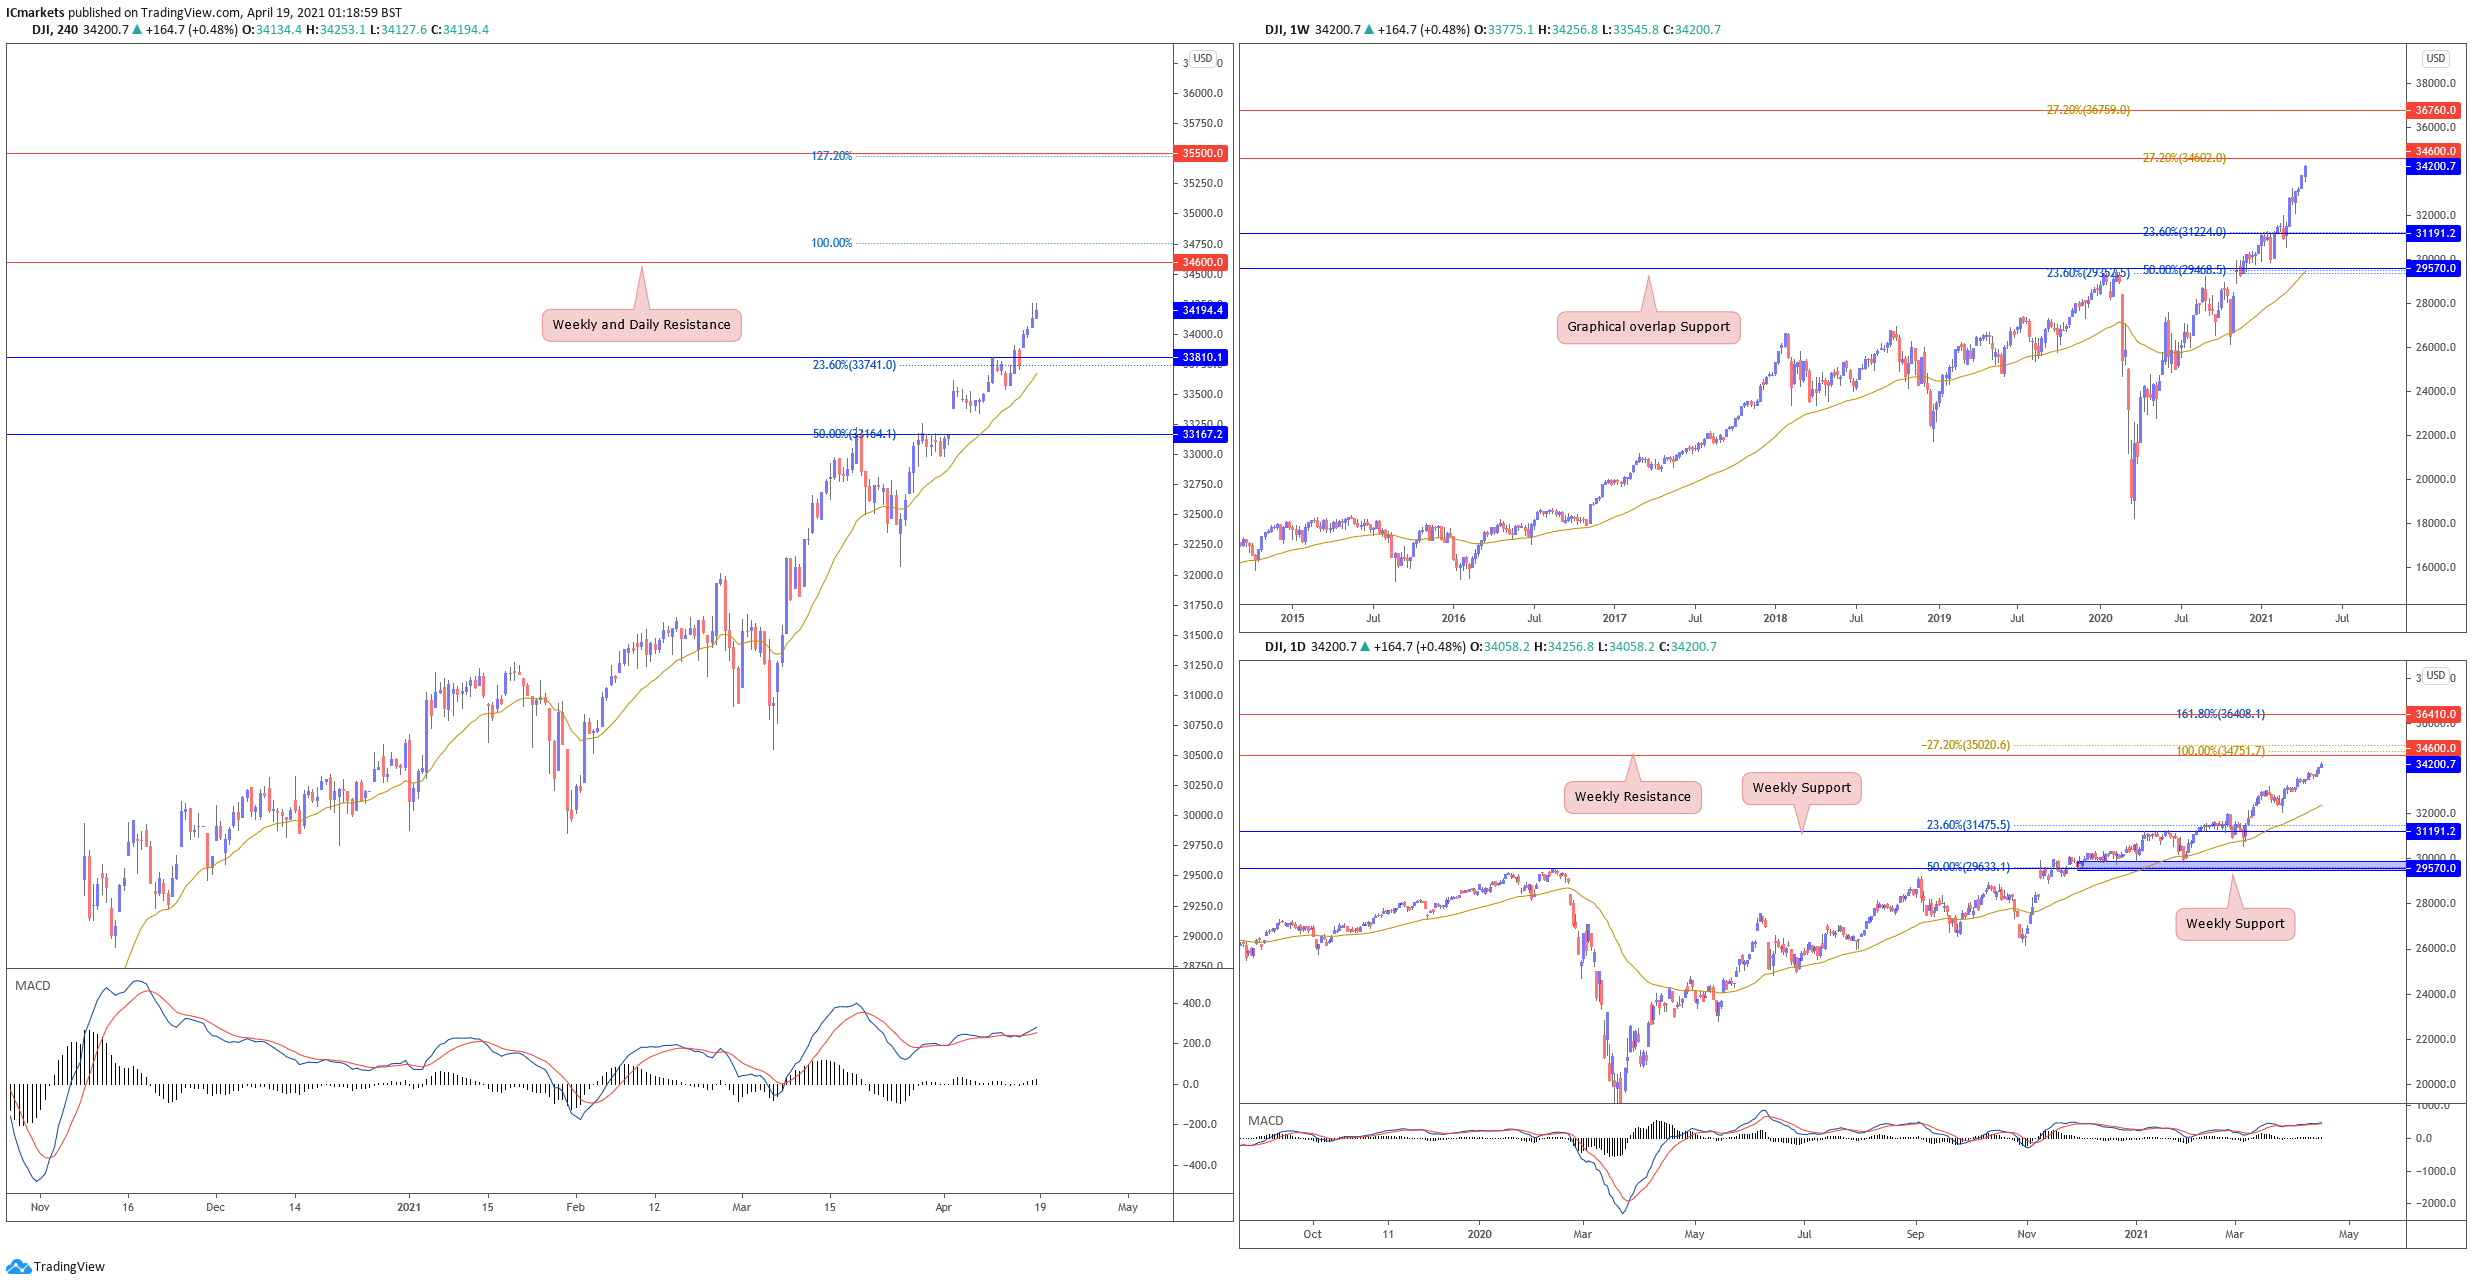
Dow Jones Industrial Average:
On the weekly chart, price made a new all time high, coming close to key 34600 resistance. A weekly close below 34600 resistance could see a short term pullback. Otherwise, a break and a close above 34600 could see price push higher. On the Daily, we see price drifting higher, with technical indicators continue to show room for further bullish upside. Buyers could possibly look to add to their longs on any price pullbacks with possible target at 34600 weekly resistance. However this upside towards our weekly resistance seems limited.
On the H4, price pushed higher, achieving a new all time high. With technical indicators still showing room for further bullish momentum, we expect a medium probability scenario where a limited upside towards 34600 weekly resistance could be a possible scenario, allowing traders to add to their longs on any short term pullbacks. Otherwise, failure to push higher could see price drop towards 32345 instead.
Areas of consideration:
- Long and short term technical indicators calling for further bullish upside
- Watch key long term resistance at 34600.
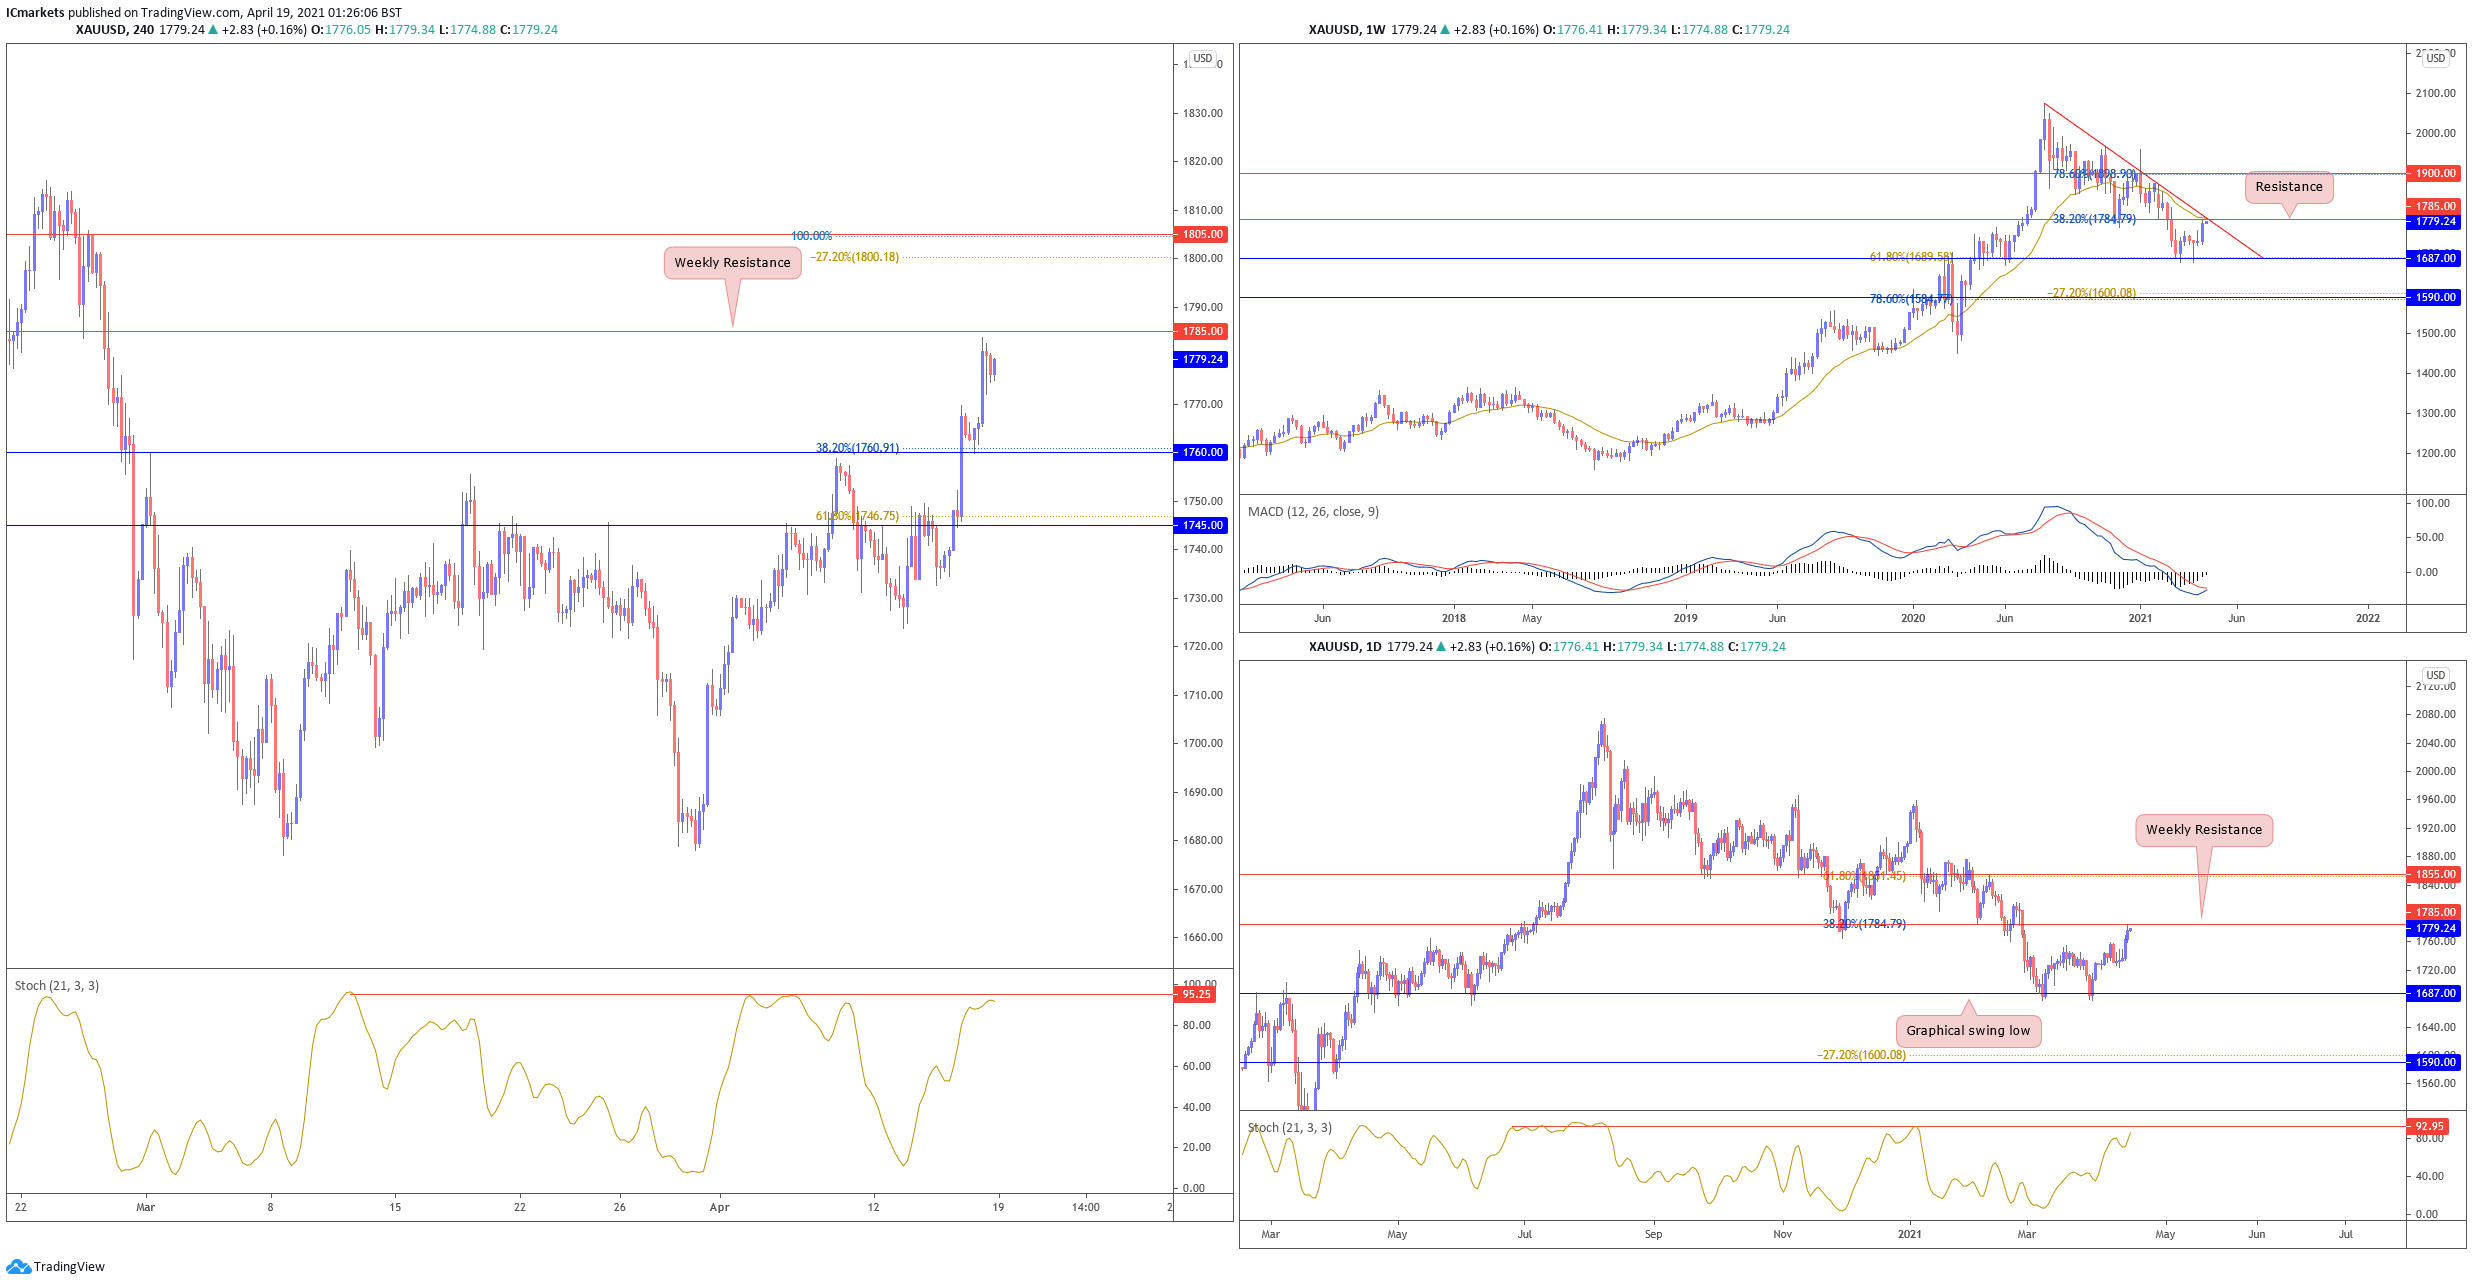
XAU/USD (GOLD):
On the weekly timeframe, gold pushed higher testing descending trendline resistance and long term moving average resistance at 1785. A weekly close below this resistance could see price pull back lower towards 1687 support. On the Daily timeframe, price is also coming close to weekly resistance and graphical over lap resistance at 1785. A short term drop towards graphical swing low at 1687 could be likely. Otherwise, failure to hold below 1785 resistance could see price swing higher towards 1855 resistance next.
On the H4, price is capped below weekly resistance at 1785. With stochastic testing resistance where price reacted in the past, a short term drop towards 1760 support could be possible for short sellers to play the intraday. Otherwise, failure to hold below 1785 resistance could see price push towards next resistance at 1805.
Areas of consideration:
- 1785 resistance key level to watch out for
- Short term stochastics indicator calling for a drop
The accuracy, completeness and timeliness of the information contained on this site cannot be guaranteed. IC Markets does not warranty, guarantee or make any representations, or assume any liability regarding financial results based on the use of the information in the site.
News, views, opinions, recommendations and other information obtained from sources outside of www.icmarkets.com.au, used in this site are believed to be reliable, but we cannot guarantee their accuracy or completeness. All such information is subject to change at any time without notice. IC Markets assumes no responsibility for the content of any linked site.
The fact that such links may exist does not indicate approval or endorsement of any material contained on any linked site. IC Markets is not liable for any harm caused by the transmission, through accessing the services or information on this site, of a computer virus, or other computer code or programming device that might be used to access, delete, damage, disable, disrupt or otherwise impede in any manner, the operation of the site or of any user’s software, hardware, data or property.


