
EUR/USD:
Weekly gain/loss: +0.82%
Weekly close: 1.1324
Weekly perspective:
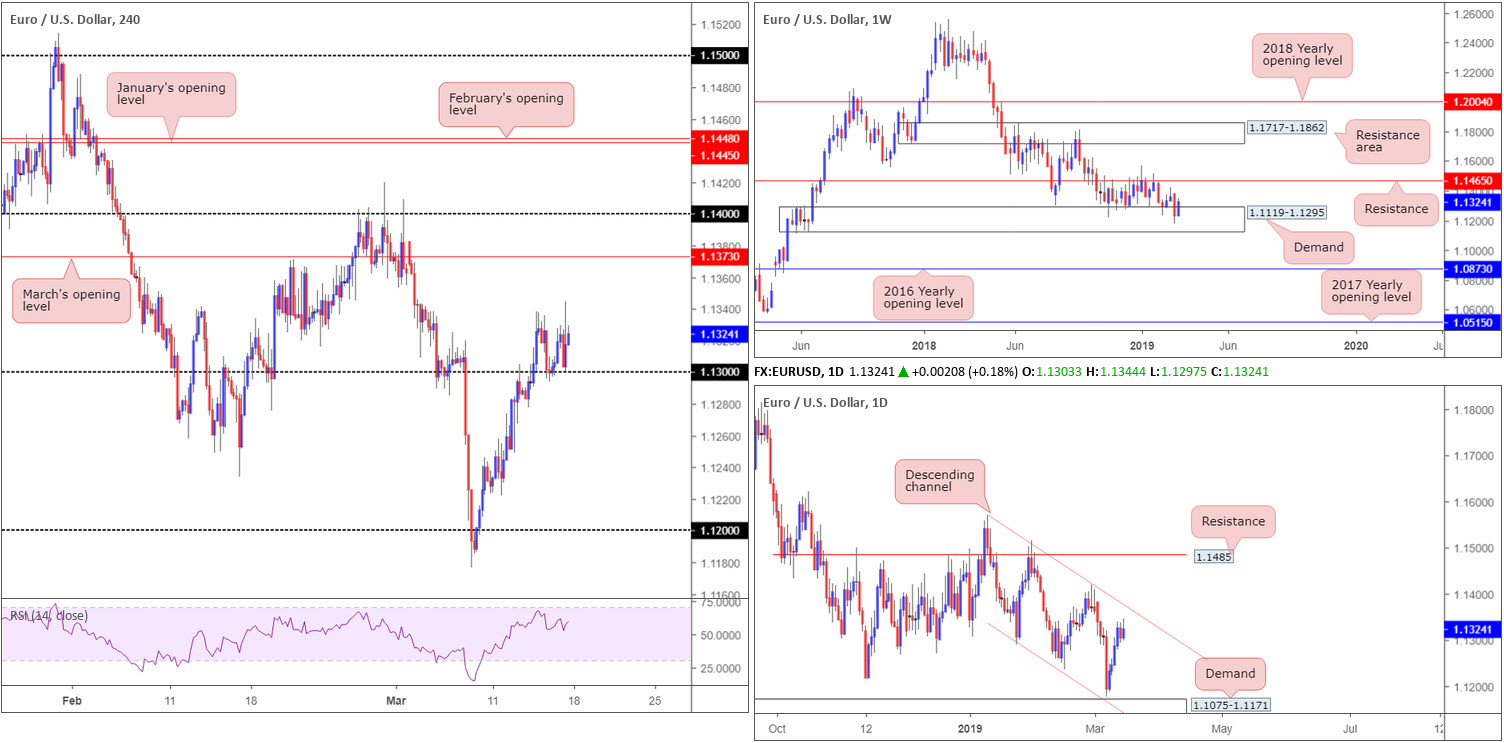
Underpinned by demand coming in at 1.1119-1.1295, EUR/USD bulls staged an impressive recovery last week. Further buying from here has resistance plotted at 1.1465 to target.
Overall, though, the long-term trend on this timeframe continues to face a southerly direction. The next area of interest beyond the current demand falls in around the 2016 yearly opening level priced in at 1.0873.
Daily perspective:
Since the beginning of this year, the daily candles have carved out a clear-cut descending channel formation (high: 1.1569 low: 1.1289). Thanks to last week’s action rallying 4 out of 5 trading days, the market is seen closing in on the upper limit of the said channel which could hamper buying out of the current weekly demand base.
H4 perspective:
The greenback remained on the defensive Friday, providing support for the 1.13 handle. For those who read Thursday’s report the piece highlighted a possible long from 1.13, having seen weekly buyers make a stand within the walls of demand and daily price displaying room to press as far north as its channel resistance. Well done to any of our readers who managed to jump aboard the move from 1.13.
Aside from session tops around 1.1338, the next upside target on the H4 timeframe can be seen around March’s opening level at 1.1373 which aligns reasonably closely with the channel resistance mentioned above on the daily timeframe.
Areas of consideration:
On the whole, the research team remains biased to the upside for the time being until we reach the daily channel resistance. As underlined above, March’s opening level at 1.1373 is the next upside target on the H4 timeframe for any traders long from 1.13.
Ultimately, buyers are looking for a break of 1.1338 to confirm strength today/early week. Intraday buyers, assuming a H4 close is seen above 1.1338, have more than 20 pips of room to manoeuvre until possible selling enters the mix. A lower-timeframe retest play off 1.1338 may, therefore, be something to consider.
Today’s data points: Limited.
GBP/USD:
Weekly gain/loss: +2.10%
Weekly close: 1.3285
Weekly perspective:
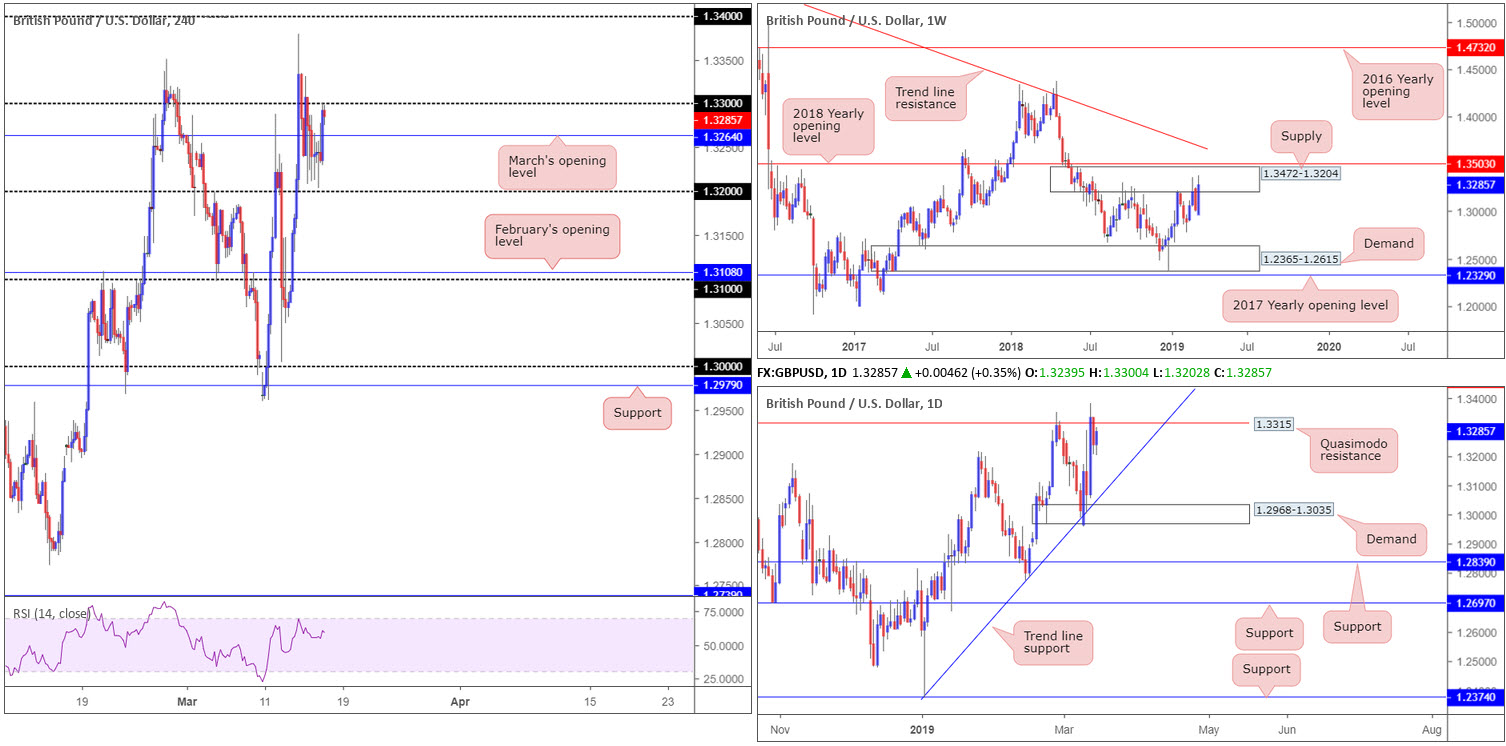
Over the course of last week, GBP/USD bulls spun off into a phase of buying and dipped their toes back into supply coming in at 1.3472-1.3204. In view of the number of times this area has been tested since July 2018, the supply’s foundation is likely weakened, giving rise to a possible advance towards the 2018 yearly opening level at 1.3503 this week.
Daily perspective:
Although marginally exploring ground above Quasimodo resistance at 1.3315 Wednesday, price action ended the week south side of this level. Nearby trend line support (taken from the low 1.2373) is the next downside target from current price, whereas another break of 1.3315 places resistance at 1.3465 back in the spotlight (not seen on the screen).
H4 perspective:
Following three stormy days, Thursday and Friday were somewhat calmer in comparison. Leaving 1.32 unchallenged Friday, the day concluded testing the underside of 1.33 after conquering March’s opening level at 1.3264.
Wednesday’s high at 1.3379 is the next port of call above 1.33 on this timeframe, shadowed closely by 1.34. Despite this, buying above 1.33 faces potential selling from the higher timeframes. Although appearing weak, the market remains trading within the parapets of weekly supply. The same can be said for the current daily Quasimodo resistance level.
Areas of consideration:
Much like Brexit, the GBP/USD’s technical structure emphasises a somewhat uncertain tone.
In the event we push above 1.33, and traders are comfortable knowing what they’re possibly buying into on the bigger picture, longs off 1.33 as a retest play is worthy of consideration today/early week. The first upside target, as mentioned above, is Wednesday’s high at 1.3379.
Folks looking to fade 1.33, on the other hand, have March’s opening level at 1.3264 to target. Ensure risk/reward is favourable before pulling the trigger – aim for at least a 1:1 ratio from entry to 1.3264. This allows traders the opportunity to reduce risk to breakeven and even take partial profits off the table.
Today’s data points: Limited.
AUD/USD:
Weekly gain/loss: +0.55%
Weekly close: 0.7081
Weekly perspective:
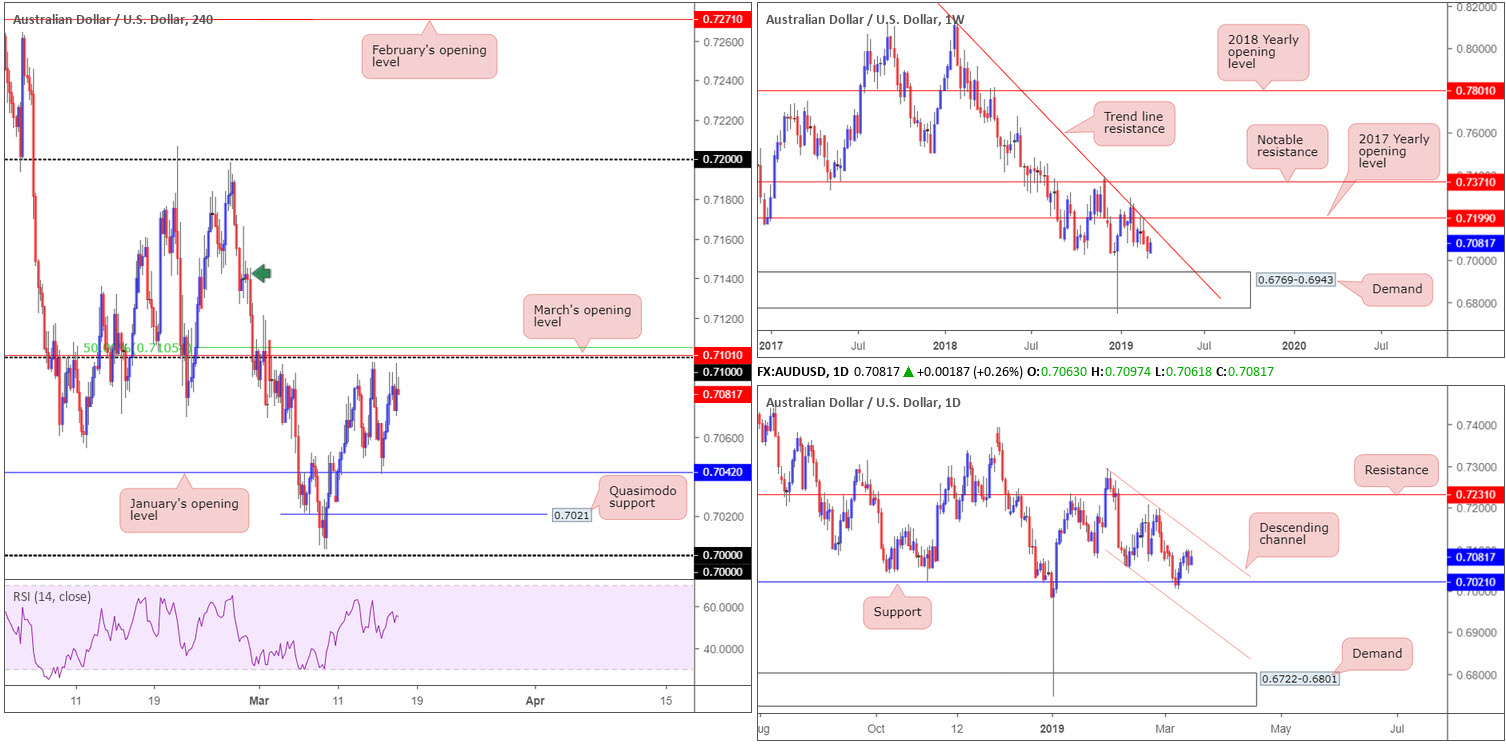
Since shaking hands with the underside of the 2017 yearly opening level at 0.7199 (and merging trend line resistance [taken from the 2018 yearly high of 0.8135]), the Australian dollar has pushed lower against its US counterpart.
Despite last week’s recovery, which reclaimed a large portion of the prior week’s losses, bias remains tilted to the downside until the unit connects with demand coming in at 0.6769-0.6943.
Daily perspective:
Daily flow continues to compress within a descending channel (high: 0.7295 low: 0.7060), though since March 7 the pair is seen pressing higher from support at 0.7021. This could eventually lead to a test of the channel’s upper limit.
H4 perspective:
Since the beginning of the week, the commodity currency has been wedged between January’s opening level at 0.7042 and the 0.71 handle (merges closely with March’s opening level at 0.7101 and the 50.0% resistance value at 0.7105).
A break of 0.71 this week has a reasonably clear run towards 0.72. Supply marked with a green arrow at 0.7166-0.7142 could be problematic, nevertheless, given its association with the daily channel resistance. A break of 0.7042 has nearby Quasimodo support in view at 0.7021, followed closely by the key figure 0.70.
Areas of consideration:
With limited higher-timeframe structure connected with current H4 levels, traders may attempt to play the range between 0.71/0.7042 this week. Should either edge sport a H4 candlestick signal (entry and risk can be determined according to this pattern), a trade to the opposing limit is an option.
Be wary of entering long above 0.71, particularly with a large stop-loss, as daily sellers will likely enter the fray from channel resistance.
A break of 0.7042 may attract sellers, though this is also a dicey move knowing Quasimodo support at 0.7021 is in sight, which happens to merge with daily support.
Today’s data points: Limited.
USD/JPY:
Weekly gain/loss: +0.27%
Weekly close: 111.45
Weekly perspective:
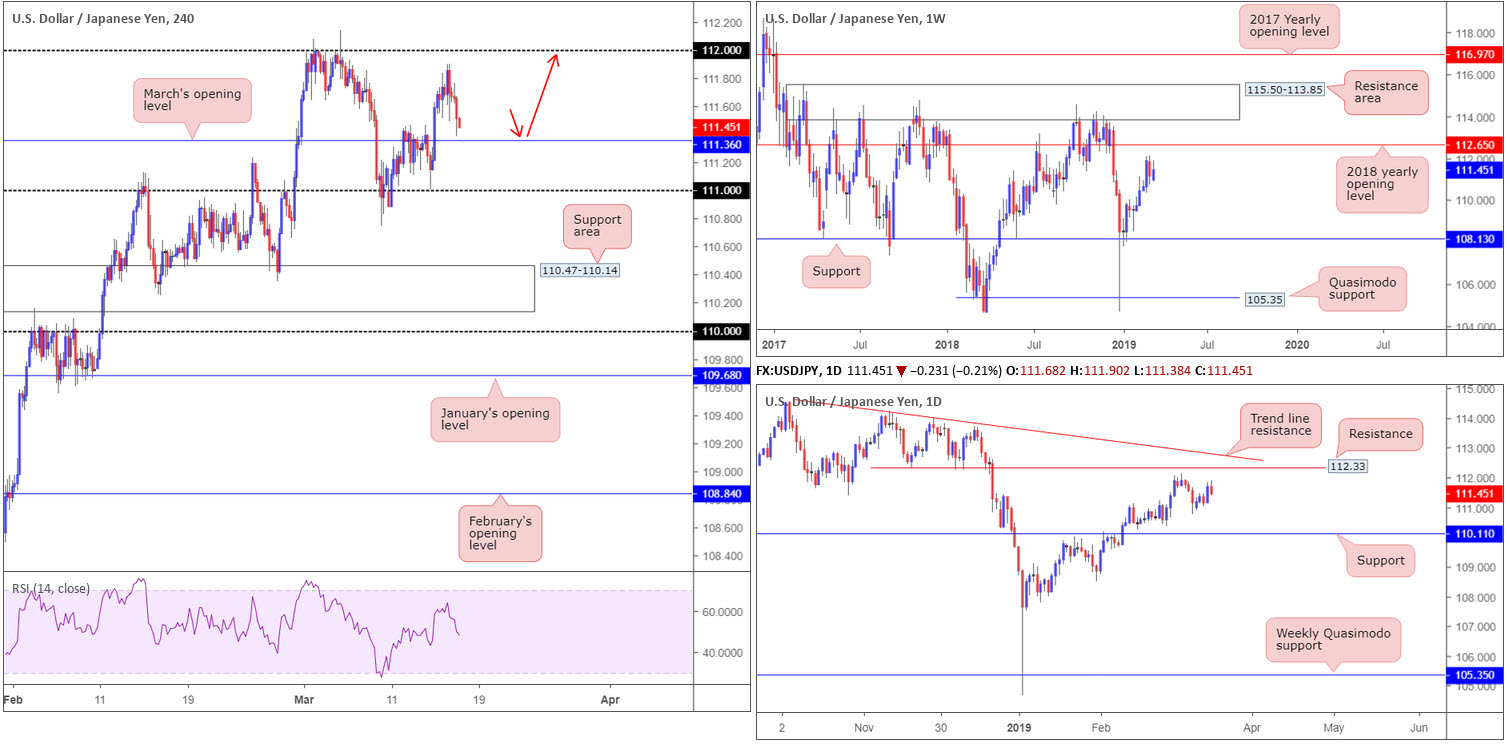
Although fading fresh 2019 highs at 112.13 two weeks back, the pendulum remains swinging in favour of the buyers at the moment. In terms of structure, pivotal resistance at 112.65 (the 2018 yearly opening level) is seen, potentially signifying this market has room to advance.
Daily perspective:
Since bottoming at 104.65 at the beginning of the year, the daily candles printed a series of higher highs and higher lows. Recent selling found support around the 110.74 March 8 low and has thus far shown possibility to the upside, with eyes likely on resistance plotted at 112.33, followed by trend line resistance extended from the high 114.23.
H4 perspective:
A brief review of Friday’s movement on the H4 timeframe reveals the USD/JPY settled for the week a few pips north of March’s opening level at 111.36, largely influenced by waning US Treasury yields and broad-based USD selling. The next upside target on this scale can be seen around the 112 handle.
Areas of consideration:
According to the higher timeframes the buyers are in good form, with daily resistance at 112.33 in place as the first upside objective.
Should H4 action retest 111.36 as support and hold (preferably in the shape of a bullish candlestick signal – entry and risk levels can be determined on the back of this structure), a rally towards 112 could be on the cards (red arrows). A failure of 111.36, nonetheless, will likely draw the unit in the direction of 111, which, as you can see, provided the market reasonably strong support and resistance of late.
Today’s data points: Limited.
USD/CAD:
Weekly gain/loss: -0.60%
Weekly close: 1.3335
Weekly perspective:
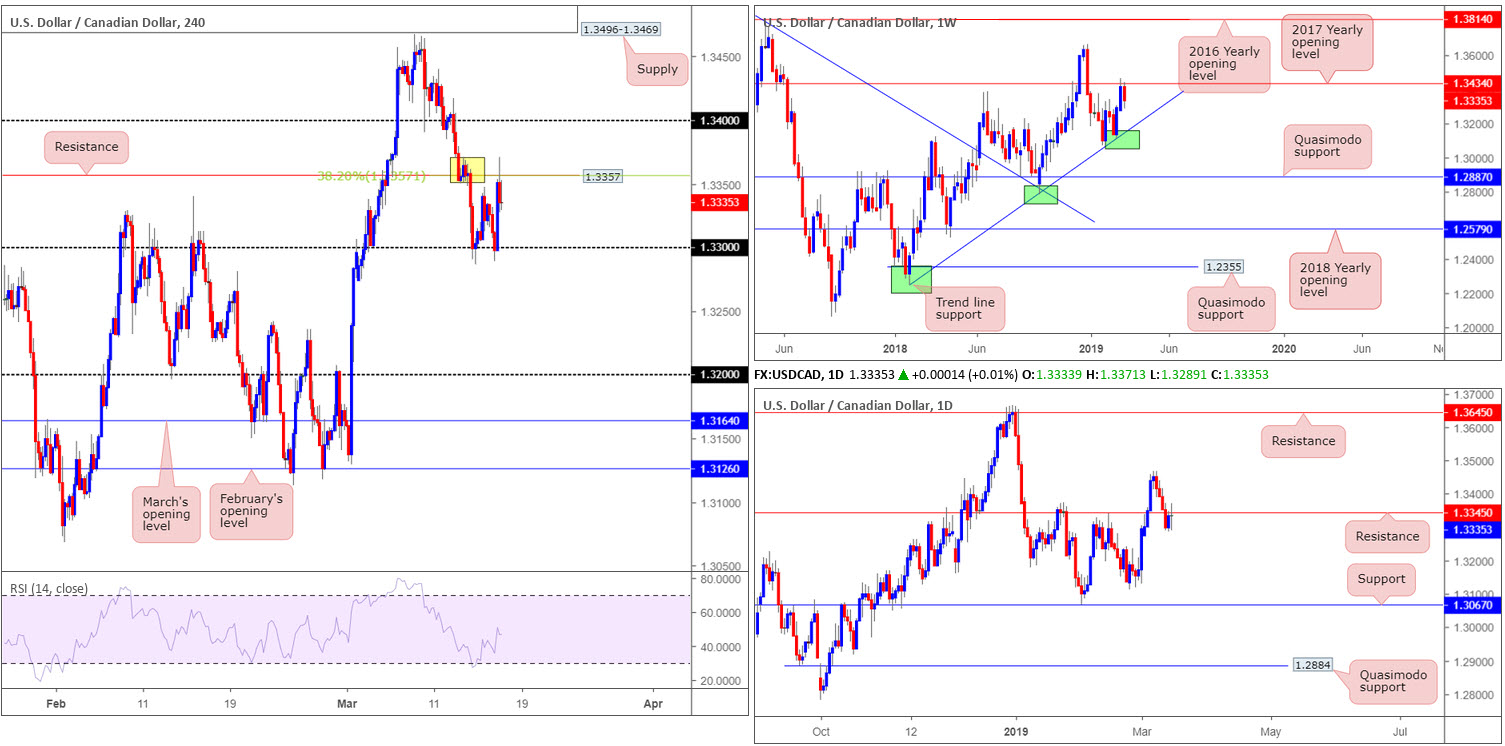
Shattering a two week bullish phase, weekly price crossed swords with its 2017 yearly opening level at 1.3434 recently and sold off last week. Down more than 80 points, additional selling could come to fruition this week as the next support target does not enter the fight until trend line support (extended from the low 1.2421).
On the occasion buyers make an appearance at current price and push above 1.3434, keep tabs on the 1.3664 Dec 31 high, followed reasonably closely by the 2016 yearly opening level at 1.3814.
Daily perspective:
Wednesday observed daily action elbow its way through support at 1.3345, and provide resistance Thursday and Friday. Note Friday’s session concluded by way of a clear-cut indecision candle. The 1.3112 Feb 25 low is in view should the unit push for lower ground this week, closely tailed by a reasonably well-rounded support at 1.3067.
H4 perspective:
Friday’s session witnessed 1.33 hold as support for a second time, with little drawdown. The move from here engulfed Thursday’s high 1.3347 and tested resistance priced in at 1.3357, which happens to merge with a 38.2% Fibonacci resistance value and a supply zone (yellow) at 1.3371-1.3350.
Knowing we’re coming from weekly resistance (1.3434) and are seen fading the underside of daily resistance at 1.3345, the H4 resistances mentioned above are likely to hold. This could lead to an additional retest of 1.33 or perhaps a break of this number, which, according to the H4 scale, potentially sets the stage for a run towards 1.32.
Areas of consideration:
Two possible scenarios –
- Sell at current price with stop-loss orders tucked above Friday’s session high (1.3371), targeting 1.33 as an initial trouble area. Ultimately, though, a break of 1.33 to the downside is desirable, as this exposes 1.32 as the next support target.
- Instead of attempting a sell at current price, conservative traders may opt to wait and see if 1.33 is engulfed. A H4 close below this number that’s followed up with a retest (entry and stop levels can be defined according to the rejecting candle’s limits) is, given the picture on the higher timeframes, a high-probability sell, targeting 1.32.
Today’s data points: Limited.
USD/CHF:
Weekly gain/loss: -0.57%
Weekly close: 1.0020
Weekly perspective:
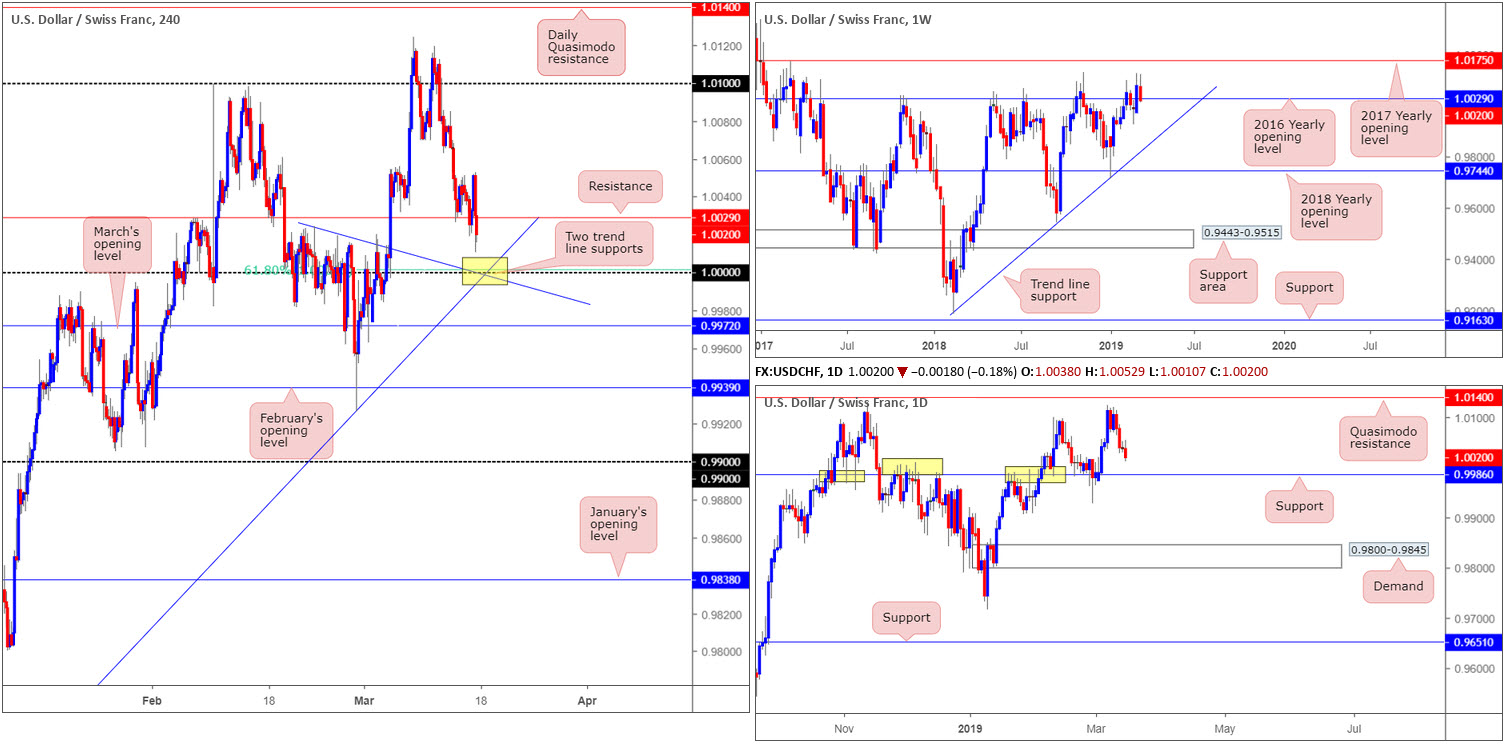
In spite of the unit reaching highs at 1.0124 in recent trading, last week’s candle concluded marginally beneath the 2016 yearly opening level at 1.0029. Having seen this level cap upside since May 2017, there’s a strong chance lower levels are going to be seen this week. The next area of interest to the downside from here is a trend line support (extended from the low 0.9187).
Daily perspective:
Leaving Quasimodo resistance at 1.0140 unchallenged, the pair extended lower last week and closed 40 or so pips north of a notable support level at 0.9986. Should this level be brought into the mix this week, it’s likely to offer a bounce, owing to its broad history as a support and resistance (yellow).
H4 perspective:
On the back of a fading dollar, the USD/CHF ended Friday’s segment down 0.18% and within touching distance of the widely watched key figure 1.0000 (parity). As demonstrated on the chart, 1.0000 finds additional support from a 61.8% Fibonacci value at 1.0001 and two merging trend line supports (1.0024/0.9716). While a bounce from 1.0000 is high probability, traders are urged to pencil in the possibility of a fakeout being seen beneath 1.0000 into daily support mentioned above at 0.9986.
Areas of consideration:
An ideal scenario would be for H4 price to print a bullish pin-bar formation that pierces through 1.0000 and brings in daily buyers from 0.9986 (entry/risk levels to be determined according to the pattern’s limits). The first upside target from here can be sited around 1.0029: a clear intraday resistance and also a weekly resistance as well.
Today’s data points: Limited.
Dow Jones Industrial Average:
Weekly gain/loss: +1.34%
Weekly close: 25860
Weekly perspective:
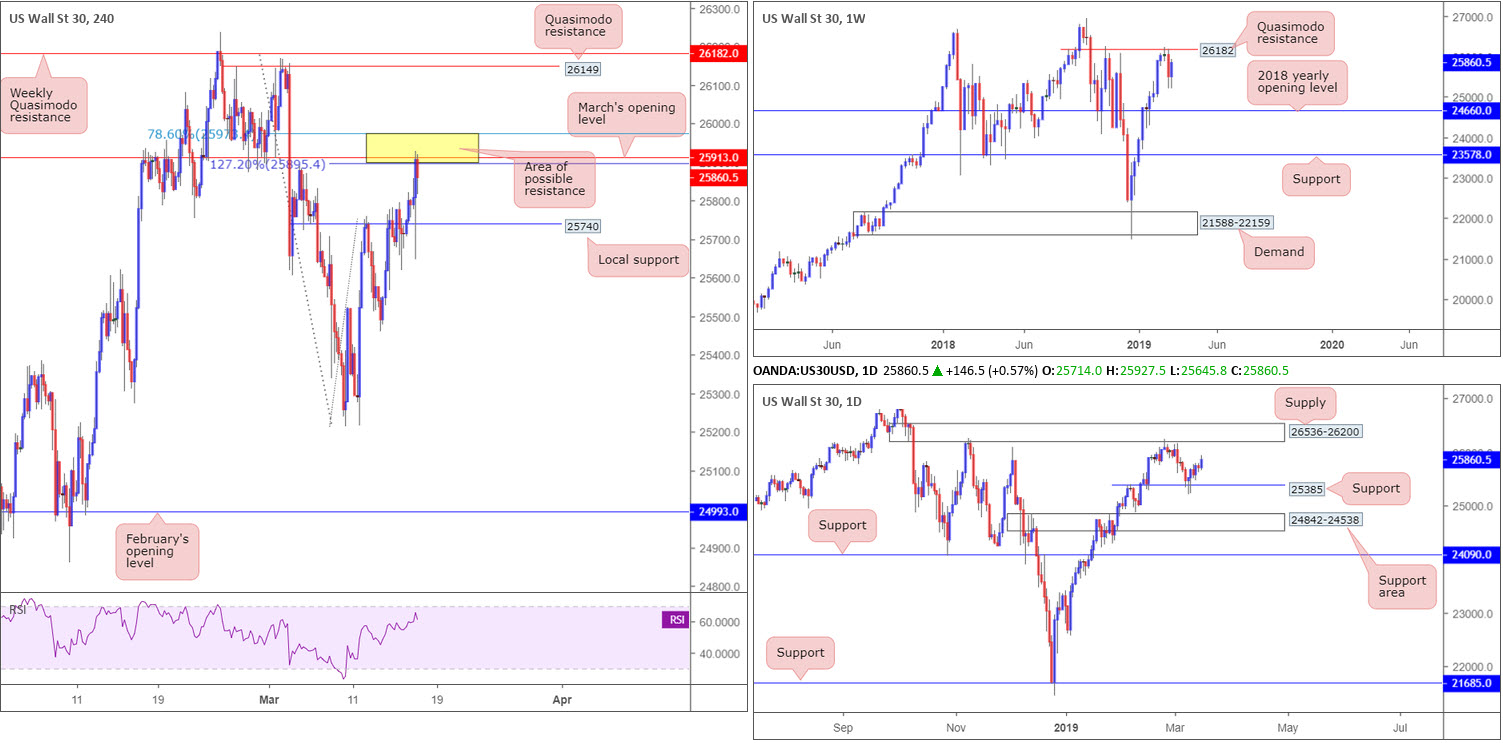
US equities rebounded sharply over the course of last week, reclaiming a respectable portion of prior losses. Further buying this week will bring weekly action towards its Quasimodo resistance level at 26182, with a break of this level having all-time highs at 26939 in sight.
Daily perspective:
Bolstering last week’s run higher was a local support on the daily timeframe at 25385. The next upside target from current price stands at supply drawn from 26536-26200. Note this area is parked a few points above the Quasimodo resistance at 26182 on the weekly timeframe.
H4 perspective:
In spite of both weekly and daily timeframes signifying a move higher is likely, Friday’s session on the H4 timeframe closed around the underside of a particularly interesting area of resistance at 25978/25895 (yellow – comprised of a 127.2% H4 Fibonacci ext. point at 25895, a 78.6% Fibonacci resistance value at 25978 and March’s opening level at 25913).
Areas of consideration:
Overall, we could be in for a move higher this week, though this doesn’t mean we will not witness a bounce take shape out of the H4 resistance area mentioned above at 25978/25895. Be sure to lock in partial profits at local support drawn from 25740 and reduce risk to breakeven.
Once, or indeed if, the current H4 resistance area is taken out this week, all eyes will then be on H4 Quasimodo resistance at 26149, the weekly Quasimodo resistance at 26182 and the underside of daily supply at 26200. Longs could, therefore, be an option on any retest seen at 25913ish, and shorts desirable between 26200/26149.
Today’s data points: Limited.
XAU/USD (GOLD):
Weekly gain/loss: +0.30%
Weekly close: 1301.9
Weekly perspective:
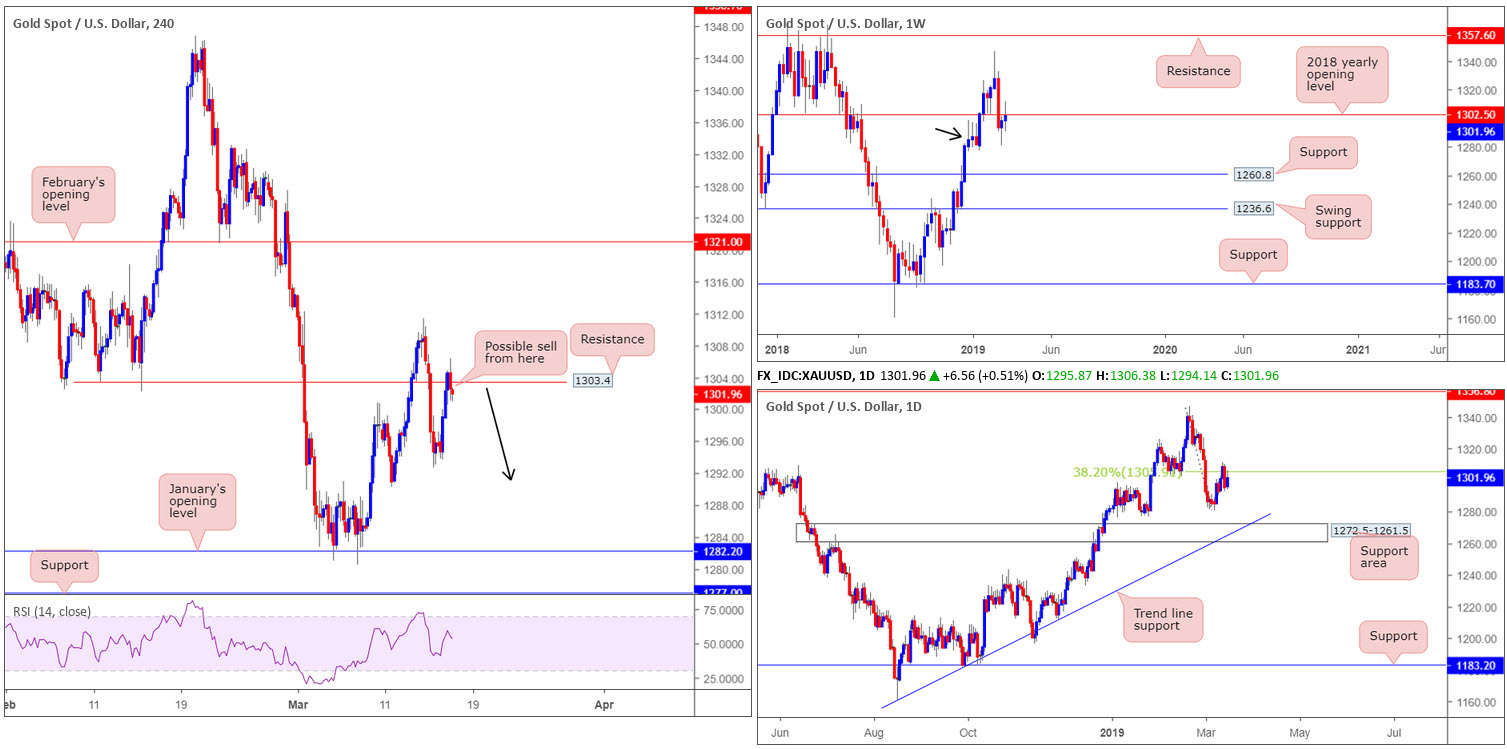
Thanks to recent selling, weekly price snapped back beneath its 2018 yearly opening level at 1302.5. Despite this, traders are urged to consider the unit still trades from demand on this timeframe around 1276.5-1298.5 (black arrow).
Daily perspective:
Supporting 1302.5 on the weekly timeframe is a 38.2% daily Fibonacci resistance at 1305.9. This barrier, assuming it holds this week, has the support area at 1272.5-1261.5 in sight, which, as you can see, merges with a trend line support (taken from the low 1160.3). Though do bear in mind for this area to be brought into the fight, a break of the current weekly demand zone will need to take shape.
H4 perspective:
With the US dollar exploring lower ground Friday as well as the 10-year US Treasury yield clocking a second consecutive weekly loss, bullion attacked higher levels. Thursday witnessed the unit bottom around 1292.7 and push higher Friday to challenge resistance coming in at 1303.4.
A relatively strong bearish H4 candle printed from this level going into the close, which, given where we are currently positioned on the bigger picture, could be enough to entice sellers back into the market this week.
Areas of consideration:
Selling from current price on the H4 chart is an option with stop-loss orders tucked above Friday’s session high at 1306.3. As for immediate downside targets, the research team has eyes on Thursday’s low 1292.7 and then last Monday’s low at 1290.2. Beyond here, some local support resides around 1289.0ish, followed closely by January’s opening level at 1282.2.
The accuracy, completeness and timeliness of the information contained on this site cannot be guaranteed. IC Markets does not warranty, guarantee or make any representations, or assume any liability with regard to financial results based on the use of the information in the site.
News, views, opinions, recommendations and other information obtained from sources outside of www.icmarkets.com.au, used in this site are believed to be reliable, but we cannot guarantee their accuracy or completeness. All such information is subject to change at any time without notice. IC Markets assumes no responsibility for the content of any linked site. The fact that such links may exist does not indicate approval or endorsement of any material contained on any linked site.
IC Markets is not liable for any harm caused by the transmission, through accessing the services or information on this site, of a computer virus, or other computer code or programming device that might be used to access, delete, damage, disable, disrupt or otherwise impede in any manner, the operation of the site or of any user’s software, hardware, data or property


