
EUR/USD:
Weekly Gain/Loss: -1.34%
Weekly Closing price: 1.1605
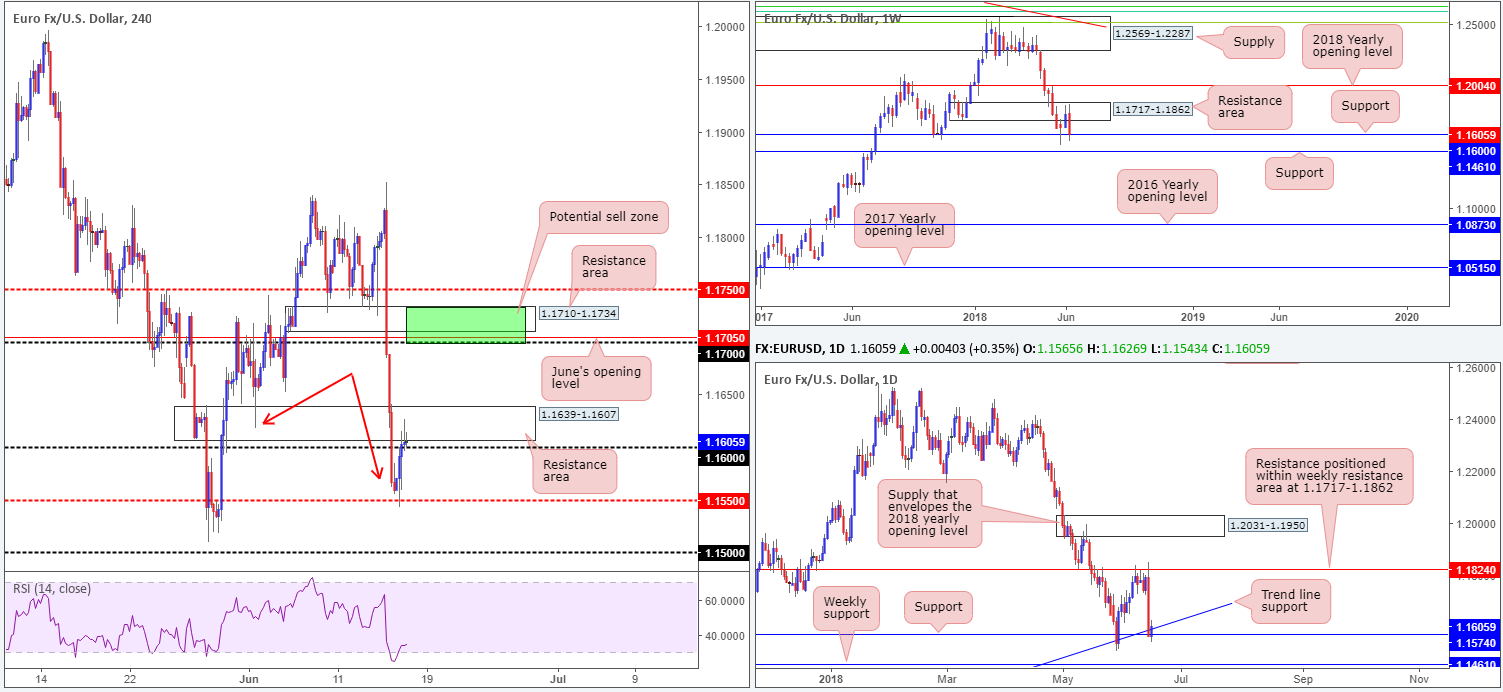
The single currency, as you can see, lost considerable ground against its US counterpart over the course of last week’s trade. Modelled in the shape of a weekly bearish engulfing candle, the pair snowballed south from the upper limit of a weekly demand-turned resistance area at 1.1717-1.1862 and shook hands with weekly support at 1.1600 into the close. These two barriers, and also the additional layer of weekly support seen beneath 1.1600 at 1.1461 will be on our radar this week.
Positioned closely to the current weekly support at 1.1600, there’s also a nice-looking daily support priced in at 1.1574, coupled with a neighboring daily trend line support taken from the low 1.0340. Following a dominant selloff on Thursday from daily resistance at 1.1824 (sited within the walls of the aforementioned weekly resistance area), price action connected with the aforementioned daily barriers and produced a modest bullish candle amid Friday’s movement.
A quick recap of Friday’s action on the H4 timeframe shows that a low just south of 1.1550 was posted early Europe. Despite this, a broad USD pull-pack and some euro short covering amid US President Donald Trump announcing that the US are to start imposing 25% tariffs on $50B worth of Chinese goods effective July 6, prompted a recovery back to and just over the 1.16 handle into a H4 resistance area at 1.1639-1.1607.
Areas of consideration:
Having seen both weekly and daily support brought into the picture (see above) last week, and the likelihood of 1.16 now acting as support (thanks to a H4 close above it), we feel hunting for shorts inside the current H4 resistance area is going to be a challenge. Should our analysis be correct and price extends Friday’s gains, the next area of interest on the H4 scale to have noted is the H4 resistance area plotted at 1.1710-1.1734. This area screams shorts. Not only have we recently put in a lower low (see red arrows), the area itself is further bolstered by the 1.17 handle and June’s opening level at 1.1705 (green zone). Further adding to this, traders may have also observed that the H4 zone is glued to the underside of the weekly resistance area highlighted above at 1.1717-1.1862.
In addition to the above, traders might also want to contemplate longs off 1.16, targeting the 1.17 region. Yes, we know this entails buying into the current H4 resistance area, but given the backing seen from higher-timeframe supports, this is a high-probability setup.
Today’s data points: ECB President Draghi takes to the stage; FOMC members Bostic and Williams also speak.
GBP/USD:
Weekly Gain/Loss: -1.01%
Weekly Closing price: 1.3275
In similar fashion to the EUR/USD, the British pound also took to lower levels last week against its US peer. Leaving the 2018 yearly opening level seen on the weekly timeframe at 1.3503 unchallenged, the pair managed to erase two weeks’ worth of gains, and potentially set the stage for a continuation move lower this week. The next support target on the weekly scale can be found at 1.3047.
Recent selling, as is shown on the daily timeframe, brought price through support at 1.3314 (now acting resistance) to the May 29 low at 1.3204. In the event that sellers remain defensive, the next support can be drawn in at 1.3063 (sited a few pips above the aforementioned weekly support – not seen on the screen).
H4 support at 1.3222, positioned just north of the 1.32 handle, was brought into the fray on Friday. Cable rose modestly from this barrier, recovering some of the lost ground seen on Thursday and bringing the unit up to within shouting distance of the 1.33 handle.
Areas of consideration:
On account of all three timeframes continuing to air somewhat bearish vibes, the small area marked in green on the H4 timeframe between 1.3314/1.33 (daily resistance and round number) remains an ideal location to consider a short from, targeting H4 support mentioned above at 1.3222 as the initial take-profit zone. Owing to psychological numbers being prone to fakeouts, however, we would strongly recommend waiting and seeing if H4 price can pencil in a full or near-full-bodied bearish candle from 1.3314/1.33 before pulling the trigger.
Today’s data points: FOMC members Bostic and Williams also speak.

AUD/USD:
Weekly Gain/Loss: -2.09%
Weekly Closing price: 0.7440
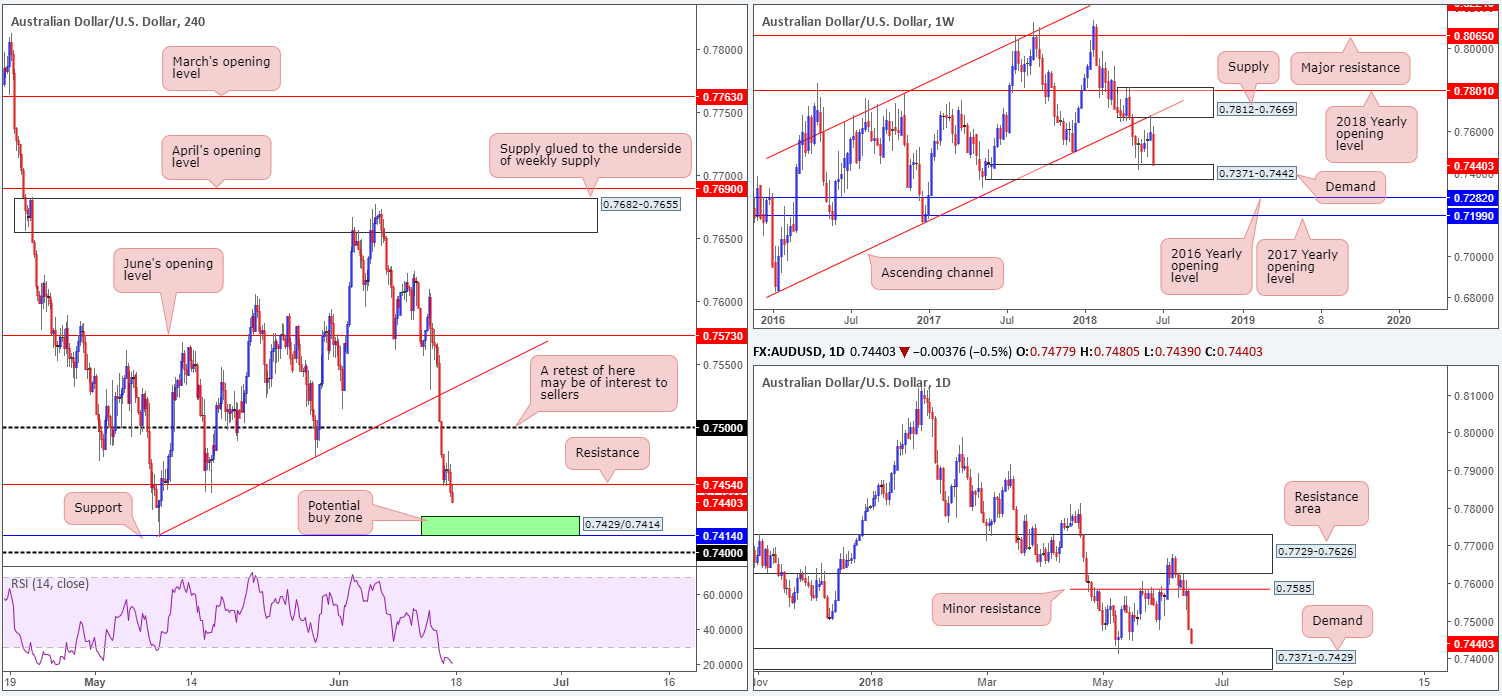
The Australian dollar underperformed markedly during last week’s sessions, likely a victim of the recent USD advance. Following the prior week’s prominent weekly bearish pin-bar formation off the lower edge of a weekly supply at 0.7812-0.7669, and its intersecting weekly channel support-turned resistance (extended from the low 0.6827), the AUD/USD plunged south and crossed swords with weekly demand plotted at 0.7371-0.7442 by the week’s end.
Looking at this market from the daily timeframe, we can also see that the recent bout of selling ended with the daily candles closing the week out just north of a daily demand base coming in at 0.7371-0.7429 (housed within the lower limit of the aforementioned weekly demand area).
After H4 price obliterated the 0.75 handle on Thursday, the commodity-linked currency attempted a recovery off lows of 0.7452. Failing to print anything meaningful to the upside, sellers stepped in and continued to edge lower, now likely eyeing H4 support pegged at 0.7414. Also worthy of mention on the H4 timeframe is the RSI indicator currently displaying a clear oversold signal.
Areas of consideration:
In view of the unit trading at/nearby clear areas of support, selling this market would be a daredevil move. As for possible buying opportunities, the team has noted to keep eyes on the green H4 area marked at 0.7429/0.7414. This zone denotes the top edge of the aforesaid daily demand (which as we already know is sited within the current weekly demand) and H4 support mentioned above at 0.7414. As it is impossible to judge whether the H4 candles will whipsaw beneath this barrier to bring in buyers from the nearby 0.74 handle, waiting for H4 price action to confirm buyer intent (preferably in the shape of a full or near-full-bodied bull candle) from 0.7429/0.7414 is recommended before engaging with the market.
Should the above come to fruition, stop-loss orders can be positioned beyond the rejection candle’s tail, with the initial area of concern (resistance) located at 0.7454, followed then by the 0.75 mark.
Today’s data points: FOMC members Bostic and Williams also speak.
USD/JPY:
Weekly Gain/Loss: +1.01%
Weekly Closing price: 110.64
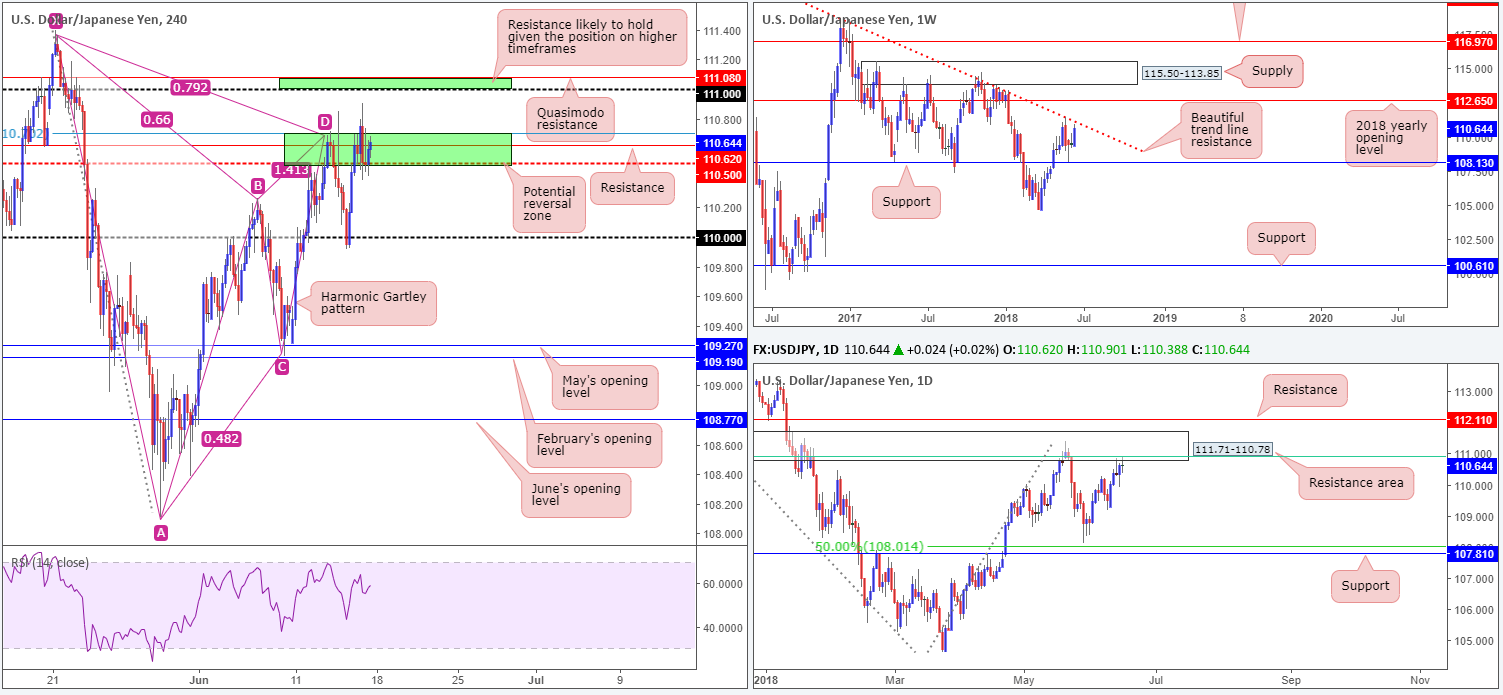
Thanks largely to a robust USD seen across the board, the USD/JPY punched its way higher in recent trade. This has, as you can see on the weekly timeframe, brought price action up to within a stone’s throw away from trend line resistance taken from the high 123.67. A rejection seen off of this line this week could renew interest in weekly support at 108.13, whereas continued buying from this point would place the 2018 yearly opening level at 112.65 in the firing range.
Supporting the current weekly trend line resistance is a daily resistance zone seen at 111.71-110.78, an area that fuses with a 61.8% daily Fib resistance value at 110.91 (green line) and has reasonably significant history dating back to August 2017. In the event of this area giving way, traders’ crosshairs will likely be fixed on daily resistance at 112.11.
Friday’s action on the H4 timeframe was somewhat sedated, as buyers and sellers battled for position within a potential reversal zone marked in green (lower area) at 110.72/110.50 (comprised of a H4 harmonic Gartley completion point [78.6% H4 Fib resistance], a H4 resistance level at 110.62 and a H4 mid-level resistance at 110.50). A failure of this zone will likely see the H4 candles approach 111.08/111: another area of resistance worthy of attention comprised of a H4 Quasimodo resistance level and the 111 handle.
Areas of consideration:
There remains two areas of interest in this market for potential shorts:
- The first is the current area highlighted at 110.72/110.50. Note that it has the backing of the aforementioned daily resistance area. The initial take-profit target from this region can be found around the 110 handle.
- The second zone, a little higher up and also marked in green, is seen at 111.08/111. Like the lower zone, this area also has strong connections to higher-timeframe structure. From this point, we’d be looking at the 110.50ish region as a first take-profit area.
Stop-loss placement, irrespective of where one chooses to short, should be beyond the X point of the harmonic Gartley pattern (111.39).
Today’s data points: FOMC members Bostic and Williams also speak.
USD/CAD:
Weekly Gain/Loss: +2.14%
Weekly Closing price: 1.3202
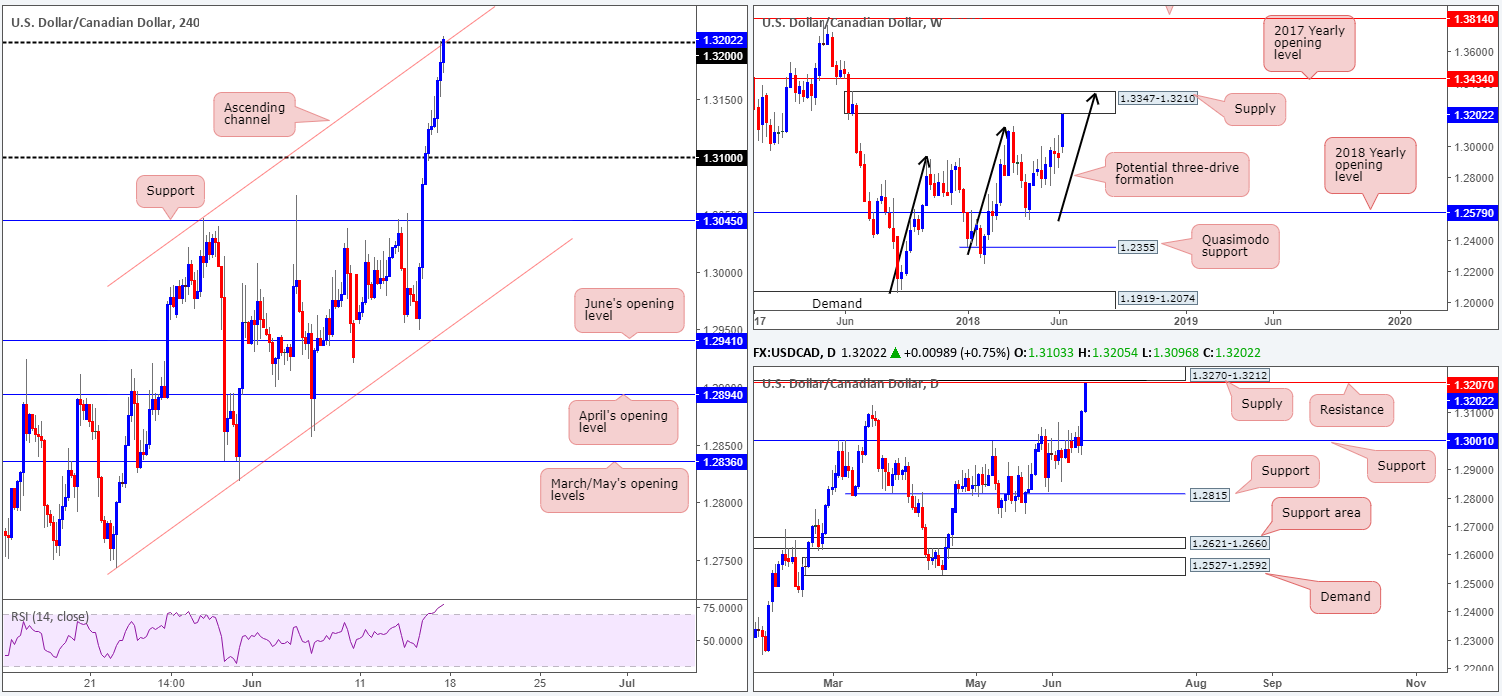
Following two weeks of hesitant price action on the weekly timeframe, USD/CAD bulls went on the offensive in recent trade. In the shape of a strong near-full-bodied weekly bull candle, the pair is currently seen trading just south of a weekly supply zone priced in at 1.3347-1.3210. On top of this, we can also see a potential three-drive formation in play, which appears to complete not too far off the top edge of the said weekly supply area.
A closer look at this market, however, highlights possible resistance on the daily timeframe at 1.3207 and nearby daily supply drawn in just above it at 1.3270-1.3212. Knowing that these two zones also have close connections with the weekly supply area mentioned above at 1.3347-1.3210, there’s a good chance this market will attempt to pare some of its recent gains this week.
Friday’s economic data out of Canada showed that manufacturing sales had contracted in April, coming in at -1.3% vs. expected 0.6%. The aftermath of the report saw the Canadian dollar add to recent losses, allowing the USD/CAD market to approach the 1.32 handle and its converging H4 channel resistance taken from the high 1.3046. Traders should also note that the H4 RSI indicator is currently displaying overbought trading conditions.
Areas of consideration:
All three timeframes point to a possible downside move this week:
- Weekly price nearing the underside of supply at 1.3347-1.3210.
- Daily price trading nearby daily resistance at 1.3207/daily supply at 1.3270-1.3212.
- H4 action seen kissing the 1.32 handle and a fusing H4 channel resistance.
Ultimately, we believe that sellers will look to make an appearance around the 1.32 region today/early this week. However, we would not advise entering short just yet, since there is a strong chance the market will want to bring in the underside of both weekly (1.3210) and daily (1.3212) supplies before probing lower. Once both areas are in play, traders can then look to short on the first reasonably sized bearish H4 rotation candle (preferably a full-bodied formation), targeting 1.31 as the initial port of call.
Today’s data points: FOMC members Bostic and Williams also speak.
USD/CHF:
Weekly Gain/Loss: +1.27%
Weekly Closing price: 0.9971
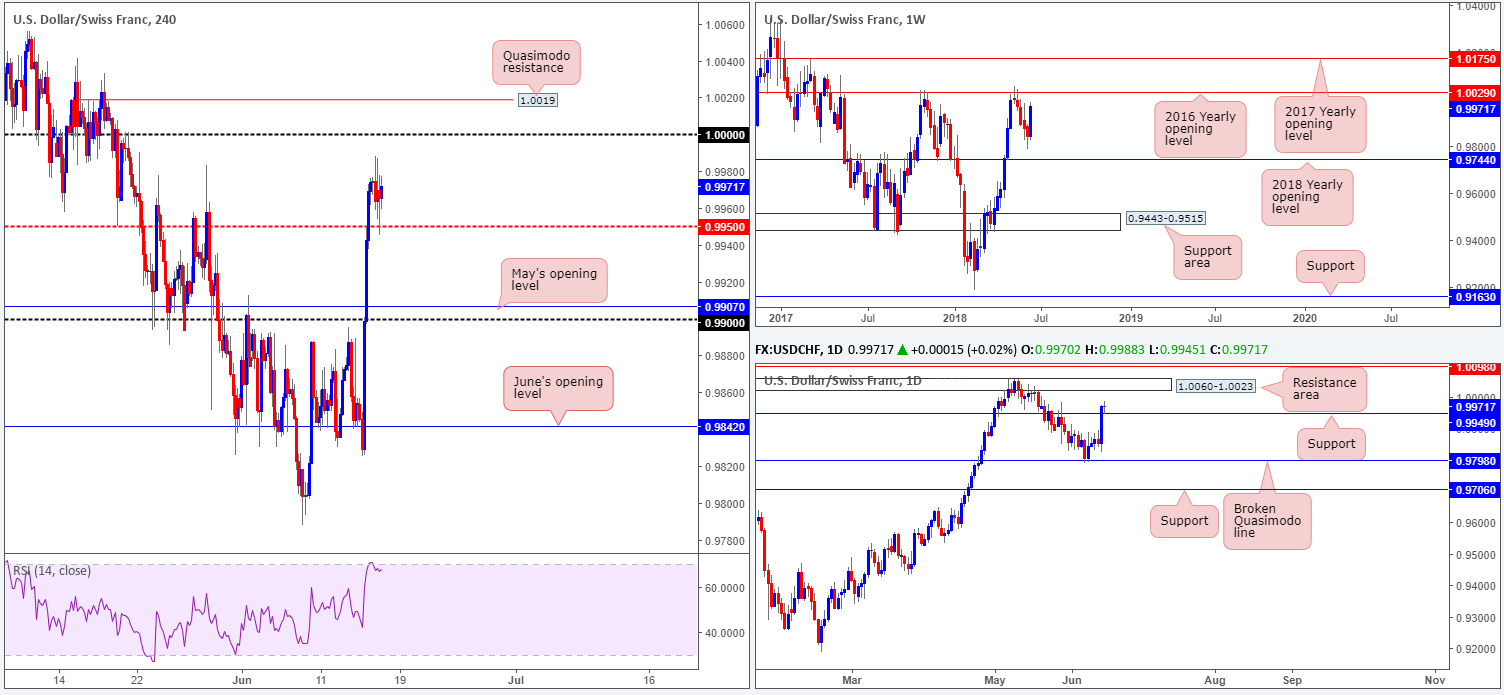
USD/CHF bulls stepped in and hauled the pair to highs of 0.9988 last week, consequently breaking a four-week bearish phase. The move has likely renewed interest around the 2016 yearly opening level seen on the weekly timeframe at 1.0029: a barrier which held price lower in early May of this year and in late October in 2017.
On the back of last week’s buying strength, the daily candles cut across daily resistance at 0.9949 (now acting support) and ended the week forming a clear-cut daily indecision candle. Not only that, but price action looks reasonably free to now approach a nearby daily resistance area at 1.0060-1.0023.
A brief look at recent dealings on the H4 timeframe reveals that the unit came within touching distance of the critical 1.0000 (parity) level amid European trade on Friday. Price managed to clock session highs of 0.9988 before turning lower and retesting the H4 mid-level support at 0.9950.
Areas of consideration:
Although the bulls certainly had the upper hand last week, this may come to an end in the not so distant future as the Swissie is seen approaching some rather significant resistance on all three timeframes we follow:
- The 2016 yearly opening level at 1.0029 on the weekly timeframe.
- The daily resistance area at 1.0060-1.0023.
- The key figure 1.0000 seen on the H4 timeframe, along with nearby H4 Quasimodo resistance level at 1.0019.
In light of this, selling from the aforementioned H4 Quasimodo resistance level may be of interest to some traders this week. We would, however, advise placing stops above the daily resistance zone at around the 1.0062ish mark. Yes, this may seem like a large stop-loss distance, but when one takes into consideration that we’re trading from higher-timeframe areas, the move lower from here could be extremely large (and profitable).
Today’s data points: FOMC members Bostic and Williams also speak.
Dow Jones Industrial Average:
Weekly Gain/Loss: -0.97%
Weekly Closing price: 25077
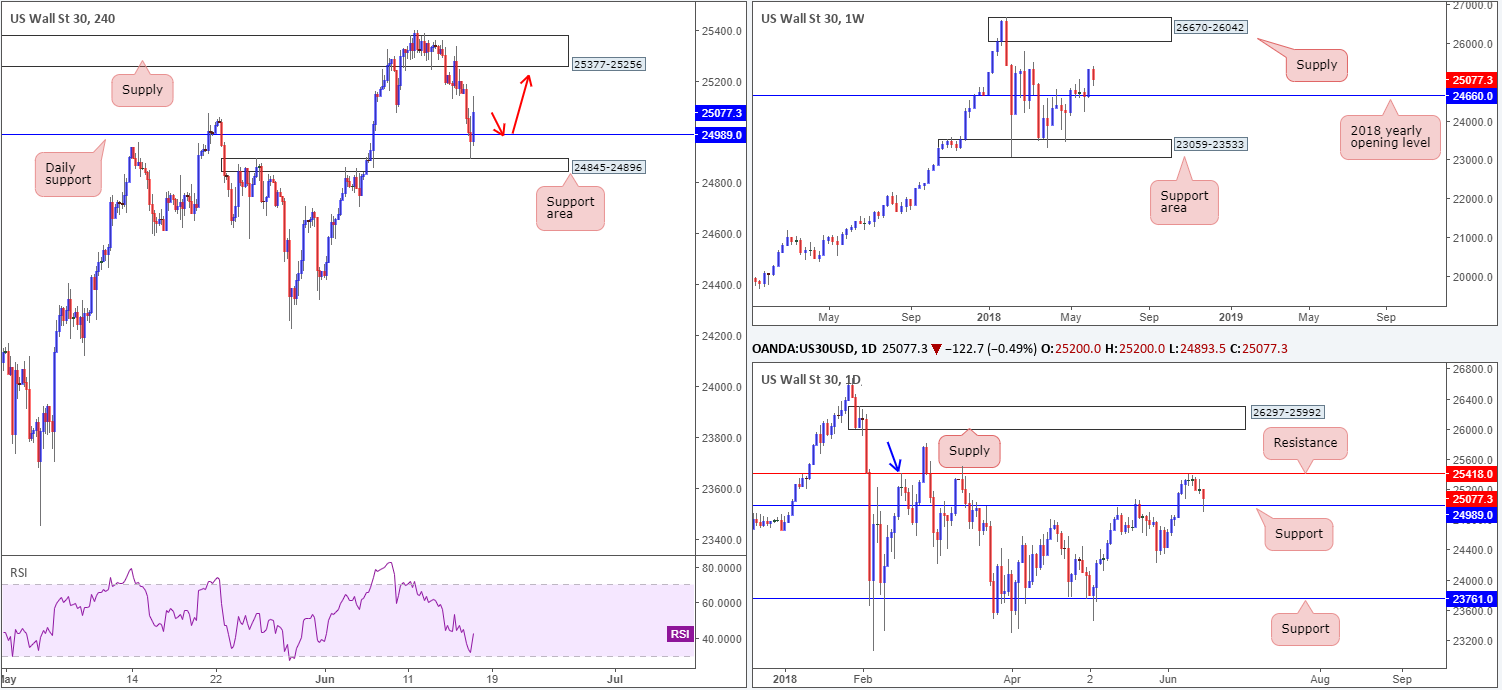
After a considerable move to the upside off the 2018 yearly opening level seen on the weekly timeframe at 24660, price was unable to build on these gains last week. Topping at a weekly high of 25399, the index began paring recent gains. Should the bulls regain consciousness, however, the next upside target to have noted on the weekly timeframe can be seen around all-time highs: weekly supply drawn from 26670-26042.
The story on the daily timeframe highlights daily support at 24989 which was brought into the fray on Friday, following a modest week-long selloff from just south of a daily resistance level at 25418. Also worth noting is this resistance level represents a daily Quasimodo resistance (left shoulder marked by the blue arrow).
While the aforementioned daily support level is in play, we can see on the H4 timeframe that price momentarily surpassed this level and shook hands with a nearby H4 support area coming in at 24845-24896. Well done to any of our readers who managed to catch this move, as H4 price concluded the week firmly back above daily support.
Areas of consideration:
According to daily structure, it’s possible that the market may look to climb north to retest the noted daily resistance level, which happens to be positioned directly above the H4 supply zone at 25377-25256 (the next upside hurdle on the H4 timeframe). Therefore, a H4 retest off the said daily support level, followed by a full or near-full-bodied H4 bull candle would, in our book, be enough to validate a long position, targeting the current H4 supply.
Today’s data points: FOMC members Bostic and Williams also speak.
XAU/USD (Gold)
Weekly Gain/Loss: -1.48%
Weekly Closing price: 1278.4
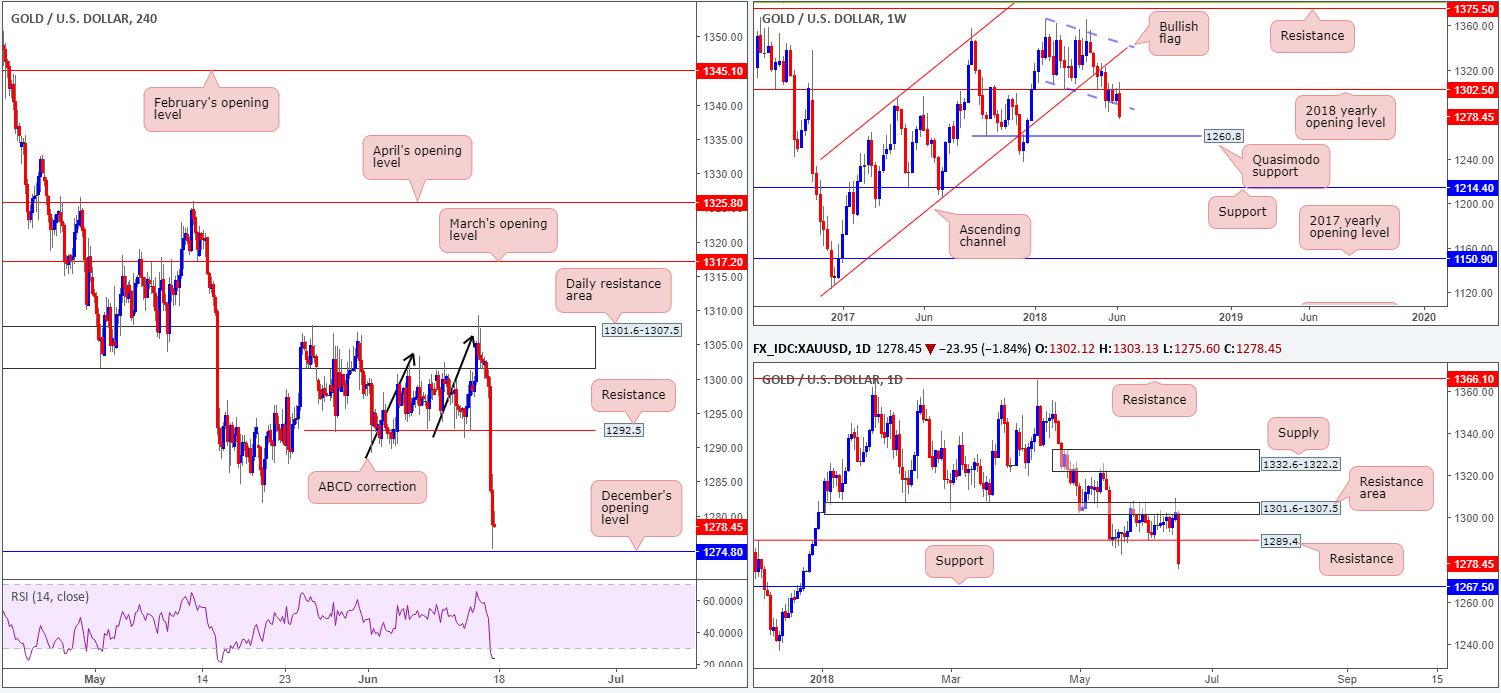
Since late May, the weekly candles have been tightly confined between the 2018 yearly opening level on the weekly timeframe at 1302.5 and the lower edge of a weekly bullish flag formation taken from the low 1346.1. That was, of course, until last week when a strong round of selling came into the market and broke lower. The move has potentially set the stage for a test of 1260.8: a weekly Quasimodo support.
As can be seen on the daily timeframe, Thursday’s session printed a nice-looking daily bearish pin-bar formation that pierced through a daily resistance area at 1301.6-1307.5. This, as you can see, generated a truckload of selling interest on Friday, consequently sending price action below the daily support level at 1289.4 (now acting resistance) and placing daily support at 1267.5 on the hit list.
Friday’s strong selling, clearly a victim of USD strength, broke through multiple tech supports on the H4 timeframe, following the completion of a H4 ABCD correction (black arrows) at 1306.3 within the said daily resistance area. With the H4 RSI in clear oversold territory, the next H4 support target in view can be seen at December’s (2017) opening level at 1274.8.
Areas of consideration:
Well done to any of our readers who managed to catch Friday’s move, as this was noted to keep an eye out for in Friday’s briefing!
Despite H4 price closing just north of a potential support level (December’s opening barrier), buying from here is a risky move given both weekly and daily structure portending further selling this week. As such, the team has noted to keep tabs on the H4 resistance level at 1292.5 as a potential sell zone, with an ultimate take-profit target set at the daily support mentioned above at 1267.5, followed closely by the weekly Quasimodo support at 1260.8.
The use of the site is agreement that the site is for informational and educational purposes only and does not constitute advice in any form in the furtherance of any trade or trading decisions.
The accuracy, completeness and timeliness of the information contained on this site cannot be guaranteed. IC Markets does not warranty, guarantee or make any representations, or assume any liability with regard to financial results based on the use of the information in the site.
News, views, opinions, recommendations and other information obtained from sources outside of www.icmarkets.com.au, used in this site are believed to be reliable, but we cannot guarantee their accuracy or completeness. All such information is subject to change at any time without notice. IC Markets assumes no responsibility for the content of any linked site. The fact that such links may exist does not indicate approval or endorsement of any material contained on any linked site.
IC Markets is not liable for any harm caused by the transmission, through accessing the services or information on this site, of a computer virus, or other computer code or programming device that might be used to access, delete, damage, disable, disrupt or otherwise impede in any manner, the operation of the site or of any user’s software, hardware, data or property.


