
A note on lower timeframe confirming price action…
Waiting for lower timeframe confirmation is our main tool to confirm strength within higher timeframe zones, and has really been the key to our trading success. It takes a little time to understand the subtle nuances, however, as each trade is never the same, but once you master the rhythm so to speak, you will be saved from countless unnecessary losing trades. The following is a list of what we look for:
- A break/retest of supply or demand dependent on which way you’re trading.
- A trendline break/retest.
- Buying/selling tails/wicks – essentially we look for a cluster of very obvious spikes off of lower timeframe support and resistance levels within the higher timeframe zone.
- Candlestick patterns. We tend to only stick with pin bars and engulfing bars as these have proven to be the most effective.
We search for lower timeframe confirmation between the M15 the H1 timeframes, since most of our higher-timeframe areas begin with the H4. Stops are usually placed 5-10 pips beyond confirming structures.
EUR/USD:
Weekly gain/loss: – 19 pips
Weekly closing price: 1.1028
Weekly opening price: 1.1049
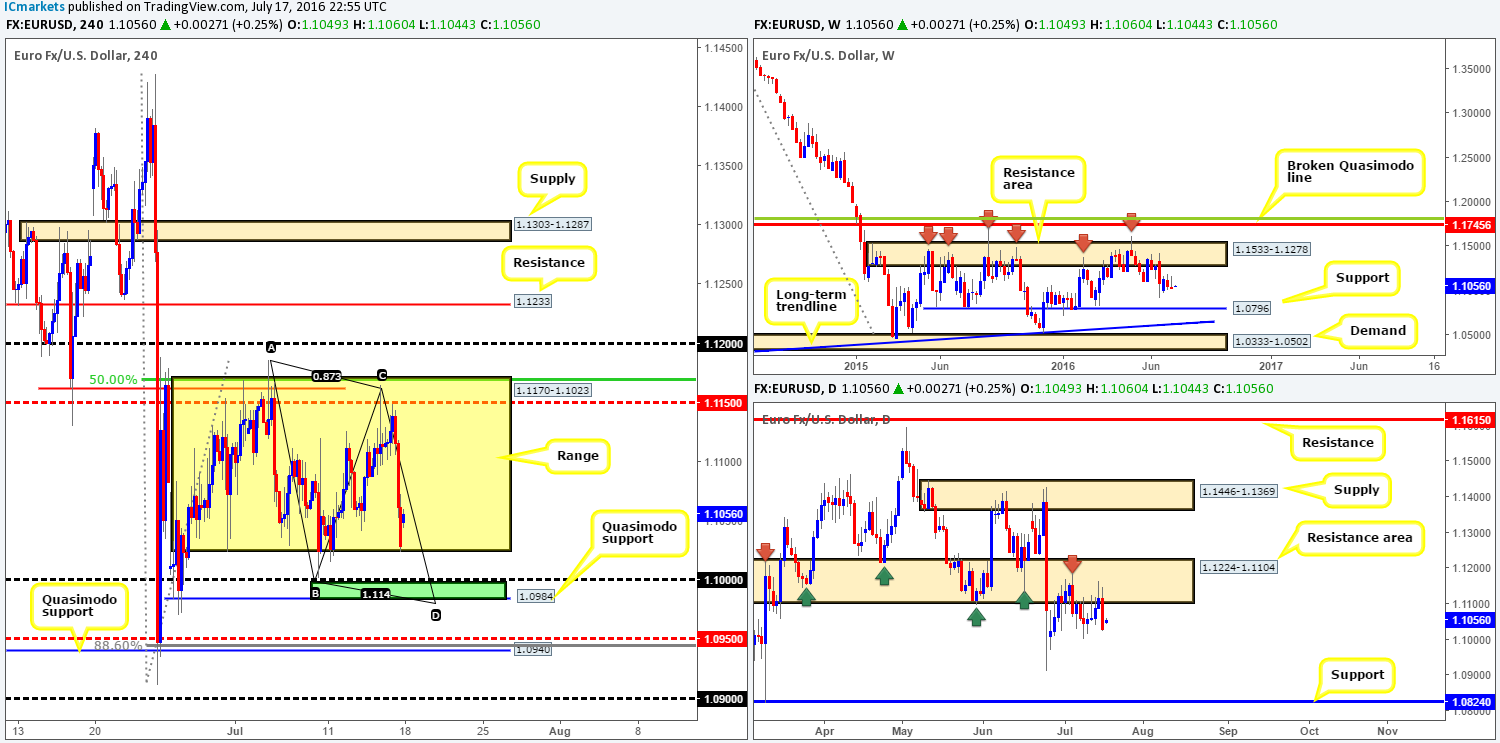
Weekly view: Although the single currency ranged around 150 pips during the course of last week, price remained relatively unchanged by the close. As far as structure is concerned, weekly movement continues to trade mid-range between a long-term weekly resistance area coming in at 1.1533-1.1278, and a long-term weekly support line seen at 1.0796. Both areas have stood the test of time, and with that either one could play a significant role during trading this week.
Daily view: The daily resistance area at 1.1224-1.1104 once again did a pretty good job in holding this market lower last week. Since January 2015, this zone has provided the pair strong support and resistance on numerous occasions. Apart from the referendum low seen at 1.0911, there’s little support stopping price from reaching the daily support chalked in at 1.0824 this week.
H4 view: Bolstered by a string of better than expected US data, the H4 chart shows that the EUR plummeted against its US counterpart on Friday, consequently wiping out any gains the market accrued during the week. Despite the strong bearish close, the pair opened the week around twenty pips above Friday’s close.
The technical picture on the H4 chart is clear. Price has spent the last three weeks chiseling out a decent-sized range fixed between 1.1170-1.1023 (yellow zone). Therefore, this morning’s open is not really a surprise considering price closed the week heavily into the lower edge of this H4 consolidation. Be that as it may, given that the higher timeframe picture suggests lower prices may be seen this week (see above), we feel this H4 range will eventually be breached. Prior to this, however, there are two strong-looking barriers of support on the H4 where price is likely to bounce from:
- The minor H4 Quasimodo support line seen at 1.0984. This line also coincides with a H4 AB=CD completion point at 1.0979, and sits just beneath the key figure 1.10 (green zone). Collectively, this zone is high-probability area for a bounce to be seen.
- The larger H4 Quasimodo support at 1.0940. Not only did the H4 candles bounce from this line during the ‘Brexit’ fallout (indicating strong support), it also fuses with a H4 88.6% Fib retracement line at 1.0945 and a H4 mid-way support at 1.0950.
Our suggestions: Watch both of the aforementioned H4 support barriers this week for potential long positions. We are confident a bounce will be seen from these areas, but would still advise traders to trade cautiously in light of what’s been noted on the higher timeframes.
Levels to watch/live orders:
- Buys: 1.0984/1.10 [Tentative – confirmation required] (Stop loss: dependent on where one confirms this area). 1.0940/1.0950 [Tentative – confirmation required] (Stop loss: dependent on where one confirms this area).
- Sells: Flat (Stop loss: N/A).
GBP/USD:
Weekly gain/loss: + 234 pips
Weekly closing price: 1.3172
Weekly opening price: 1.3194
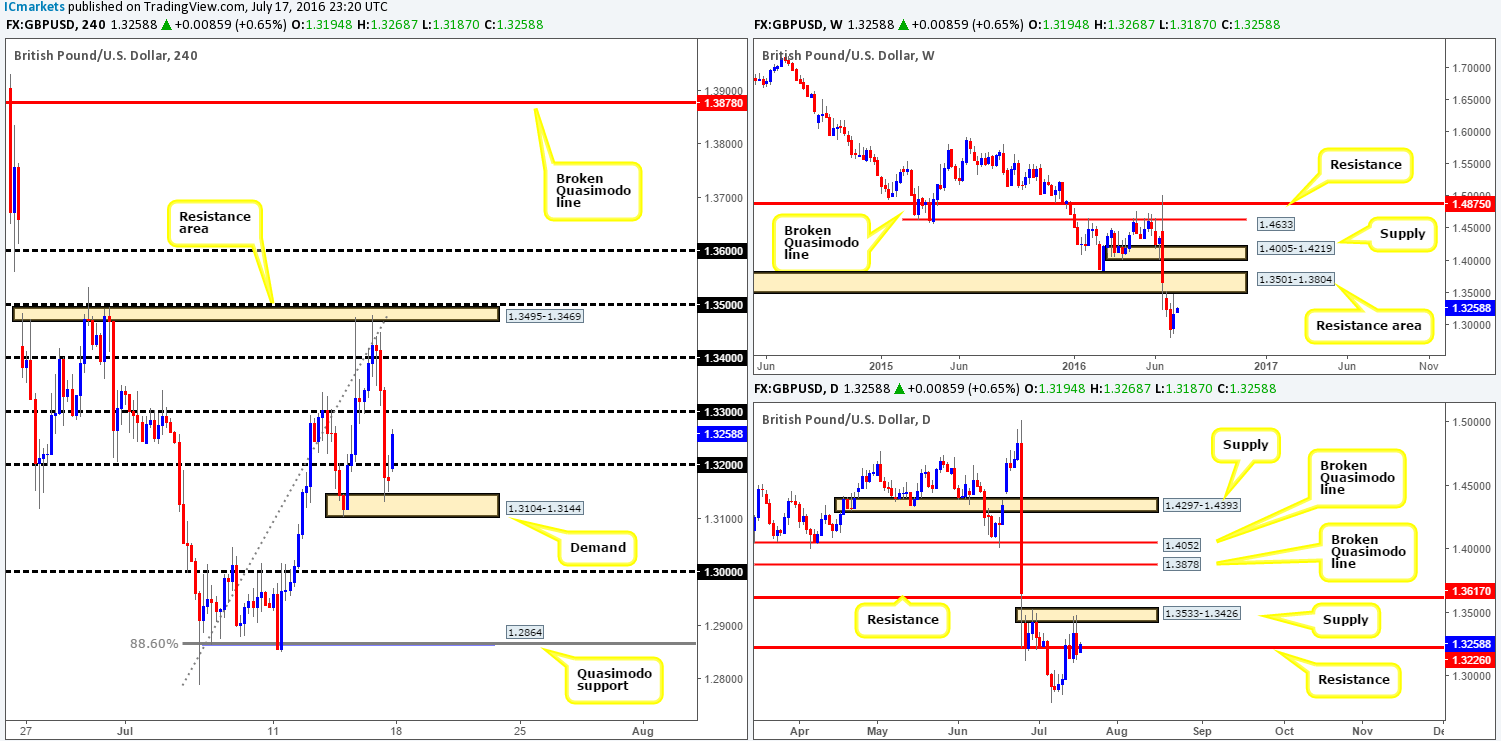
Weekly view: Last week’s action, as can be seen from the weekly chart, saw renewed buying interest enter the market. Price came within touching distance of striking the weekly resistance area at 1.3501-1.3804, before seeing an end-of-week correction to 1.3172. By and large, we see little support to the left of current price until the market reaches the 1.20 region. However, as you can see, there’s a lot of ground to cover before this barrier is brought into view, but for now, at least from a technical standpoint, this pair has the potential to continue much lower!
Daily view: In line with weekly expectations of further downside, daily price struck supply at 1.3533-1.3426 and closed the week below a daily support line at 1.3226. In the event that this level holds as resistance, a move down to the 1.30 area is very likely we feel.
H4 view: Led by a batch of better than expected US data, the GBP collapsed mid-way through Friday’s London session. Two handles were taken out allowing price to attack H4 demand coming in at 1.3104-1.3144, which held firm going into the week’s end. With the couple opening 22 pips higher than Friday’s close this morning, the bulls have dug in deep and is now seen trading around the 1.3250 region.
Although the buy-side of this market opened strongly, our team favors further selling in view of what’s been noted on the higher timeframes (see above). With that being the case, what we’re looking for at the moment is a break below the H4 demand we mentioned above at 1.3104-1.3144. This would not only likely open the path down to 1.30, but also quite possibly the H4 Quasimodo support at 1.2864 (merges with a H4 Fib retracement level).
Our suggestions: Watch for a close below the aforementioned H4 demand base. For our team to be given the green light to short below here, nevertheless, a retest of the broken demand would need to be seen followed by a lower timeframe sell signal (see the top of this report for a list of lower timeframe entry techniques). The initial target would be the 1.30 mark, which is where we’d also look to reduce risk to breakeven.
Levels to watch/live orders:
- Buys: Flat (Stop loss: N/A).
- Sells: Watch for price to consume the H4 demand at 1.3104-1.3144 and look to trade any retest seen thereafter (lower timeframe confirmation required).
AUD/USD:
Weekly gain/loss: + 13 pips
Weekly closing price: 0.7575
Weekly opening price: 0.7594
Weekly view: From Tuesday onwards last week, the commodity-linked currency was seen hovering above the weekly resistance level at 0.7604, and it was looking more and more likely that the pair would indeed close higher. However, given Friday’s sell off price ended the week rejecting this weekly barrier, despite still closing 13 pips in the green. Should the bears remain dominant below this hurdle this week, the next downside target from here can be seen at the weekly support area drawn from 0.7438-0.7315
Daily view: From this angle, we can see that price actually rebounded from a daily supply zone seen at 0.7719-0.7665, which allowed the daily candle to engulf both Wednesday and Thursday’s candles, and close back below the aforementioned weekly line. The next daily area of support to keep an eye on from here falls in at 0.7517-0.7451.
H4 view: Like the EUR and GBP pairs above, the Aussie also sold off heavily mid-way through Friday’s London session on the back of upbeat US news. As a result of this, the 0.76 handle was wiped out with price managing to reach lows of 0.7558 on the day.
Seeing as the market gapped twenty pips north this morning, the major struck the underside of 0.76 which has so far responded relatively well. Assuming that the bears manage to continue defending this line, there is a strong possibility, given the higher timeframe picture (see above), that a sell off down to H4 support area at 0.7544-0.7521 will take place.
Our suggestions: Watch for a lower timeframe sell entry off the back of the 0.76 handle, targeting the H4 support area at 0.7544-0.7521 as a first take-profit target. Although a bounce from this H4 area will likely be seen, there is a chance of further downside to 0.75, or even the H4 mid-range Quasimodo support at 0.7446, according to the higher timeframes. Therefore, our team’s ultimate target, should we manage to pin down a sell entry from 0.76, will be the 0.7450 region. This line conveniently sits just above the weekly support area at 0.7438-0.7315 and coincides nicely with a H4 channel support extended from the low 0.7148.

Levels to watch/live orders:
- Buys: Flat (Stop loss: N/A).
- Sells: 0.76 region [Tentative – confirmation required] (Stop loss: dependent on where one confirms this area).
USD/JPY:
Weekly gain/loss: + 424 pips
Weekly closing price: 104.80
Weekly opening price: 105.33
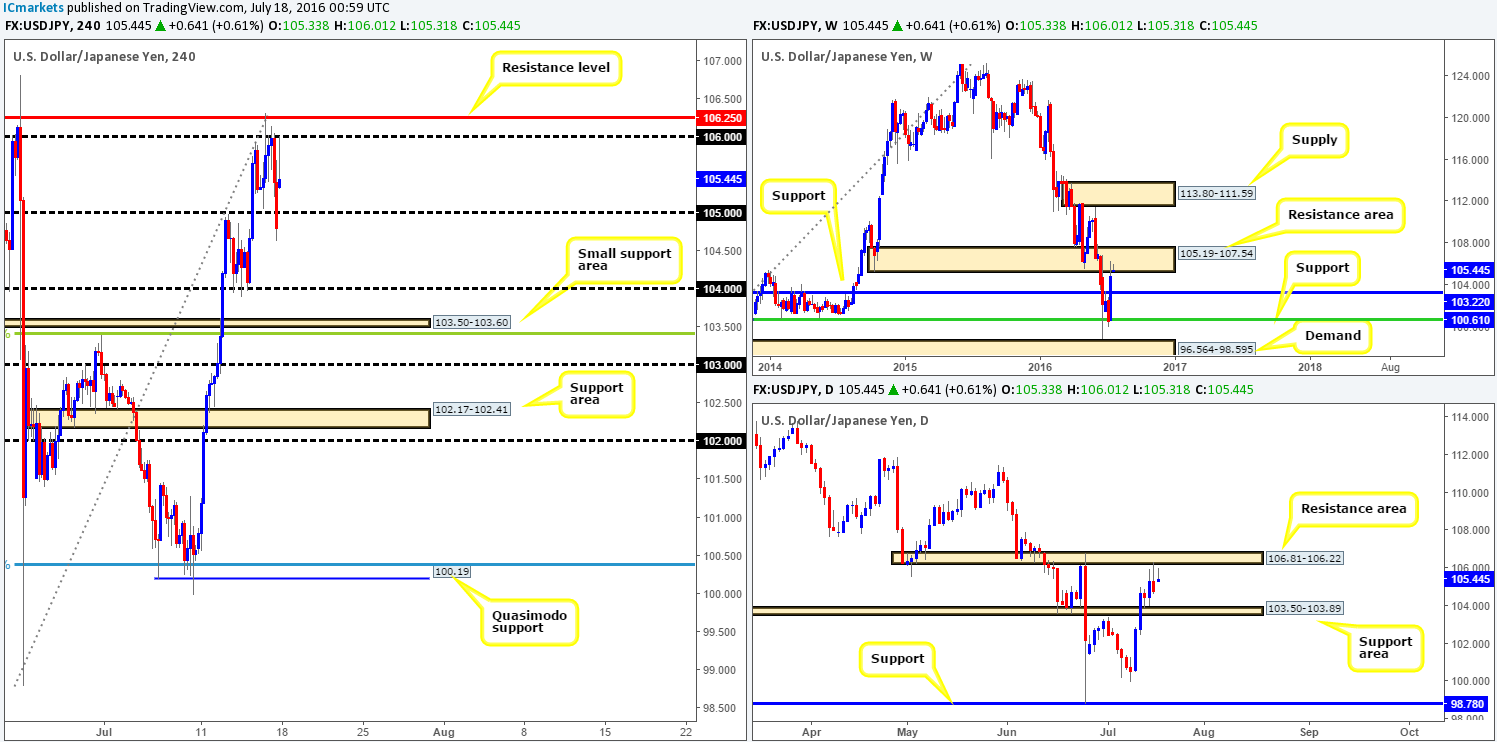
Weekly view: After a rather aggressive move north last week, price settled around the underside of a weekly resistance area coming in at 105.19-107.54. On the grounds that this zone holds firm this week, the next area of interest below comes in at 103.22 – a long-term weekly support level.
Daily view: In conjunction with weekly price, the daily chart also shows that the safe-haven pair recently responded well from a daily resistance area penciled in at 106.81-106.22. Providing that offers remain strong here, we feel this week’s movement may check in with the daily support area seen below at 103.50-103.89 (sits thirty or so pips above the aforementioned weekly support level).
H4 view: Despite Friday’s sessions aggressively closing the week below the 105 handle, the USD/JPY opened the week on the bid, 55 pips higher than Friday’s close. This has, as you can see, propelled the major up to the 106 handle which has so far responded beautifully.
Now, as far as we can see, the higher timeframe structures (see above) suggest that this market may dive lower. Before our team can look to become sellers, however, we would like the 105 line to be cleared, as this could potentially open the path south down to 104 (positioned just above the daily support area we discussed above at 103.50-103.89).
Our suggestions: Keep an eye out for a close below 105. This would, alongside a retest followed by a lower timeframe signal (see the top of this report for lower timeframe entry techniques), be enough for our team to jump in short here, targeting the 104 region.
Levels to watch/live orders:
- Buys: Flat (Stop loss: N/A).
- Sells: Watch for price to consume the 105 handle and look to trade any retest seen thereafter (lower timeframe confirmation required).
USD/CAD:
Weekly gain/loss: – 75 pips
Weekly closing price: 1.2961
Weekly opening price: 1.2936
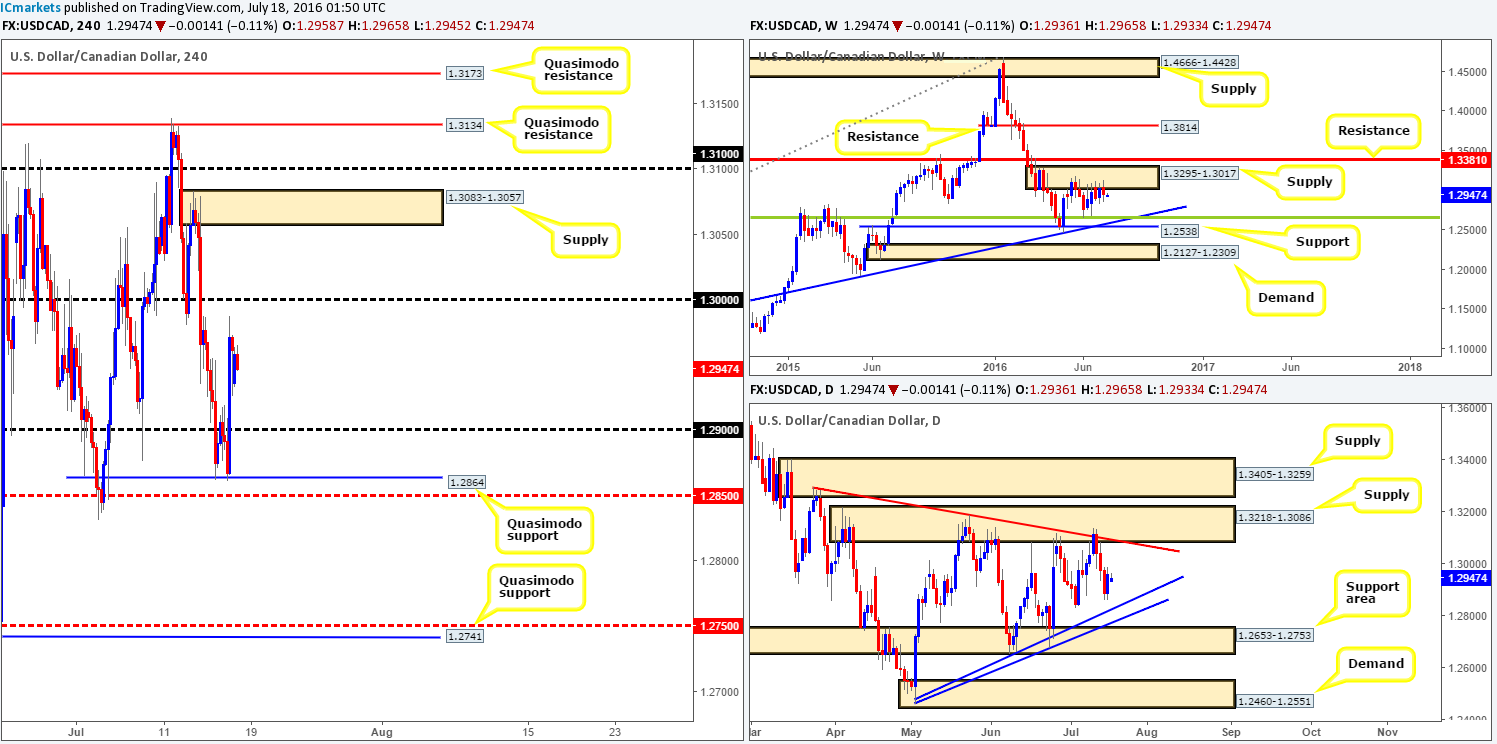
Weekly view: For the past four weeks, the USD/CAD pair has been seen clinging to the underside of a weekly supply base drawn from 1.3295-1.3017. Although this is a relatively newly-formed area, it has managed to cap upside in this market since the 16th May. Assuming that the bears do eventually stamp their authority on this zone, the next downside target can be seen at a weekly trendline support extended from the high 1.1278, which coincides with a weekly 38.2% Fib support at 1.2661 (taken from the low 0.9406).
Daily view: Since early May, the loonie has been seen trading between a relatively long-term daily support area at 1.2653-1.2753 (encapsulates the above said weekly Fib level) and a daily supply zone logged in at 1.3218-1.3086 (housed within the aforementioned weekly supply area). What’s more, there are two merging daily trendlines seen (1.2460/1.3295), forming somewhat of a bearish pennant, compressing price as we write. Conventional wisdom states that pennants are continuation patterns, which, in this case, seems a logical outcome considering the position of price on the weekly timeframe (see above).
H4 view: Boosted by a round of better than expected US data, the pair rallied beautifully from the H4 Quasimodo support at 1.2864 mid-way through Friday’s London trade, reaching highs of 1.2987 on the day. In spite of this bullish tempo, trade gapped 25 pips lower this morning.
With the weekend gap now filled, here’s what our team has logged going forward:
- From the weekly timeframe a bearish move is favored.
- Daily action shows that higher prices could be seen back up to the aforementioned daily supply and its merging daily trendline resistance, before selling is seen.
In view of these two points, these are the battle lines we have drawn up so far:
- H4 supply at 1.3083-1.3057. Although this area looks fresh and is located within the aforementioned weekly supply base, there’s still a good chance it will be faked due to the daily supply area hovering only a few pips above it at 1.3218-1.3086.
- The 1.31 handle. This is an interesting level since it’s located within both the above said daily supply and weekly supply zones.
- Finally, there are also two H4 Quasimodo resistances also lodged within the above noted higher timeframe supplies. The lower of the two at 1.3134 already held price beautifully back on the 11th July. The one above, the more extreme at 1.3173, has a very good chance of seeing a reaction should price stretch this high this week, since it remains fresh!
Our suggestions: Keep a tab on the above said areas this week. Since it is almost impossible to know which area will bounce, if any, we recommend being patient and waiting for lower timeframe price action (see the top of this report). However, should price climb to the most extreme H4 Quasimodo resistance line at 1.3173, we would enter with a market order since we then have the option of placing our stop above the current daily supply zone!
Levels to watch/live orders:
- Buys: Flat (Stop loss: N/A).
- Sells: 1.3083-1.3057 [Tentative – confirmation required] (Stop loss: dependent on where one confirms this area). 1.31 region [Tentative – confirmation required] (Stop loss: dependent on where one confirms this area). 1.3134 region [Tentative – confirmation required] (Stop loss: dependent on where one confirms this area). 1.3173 [Entering at market here is viable but is still dependent on the time of day] (Stop loss: 1.3220).
USD/CHF:
Weekly gain/loss: – 2 pips
Weekly closing price: 0.9815
Weekly opening price: 0.9815
Weekly view: Despite the Swissy ranging around 130 pips last week, the market closed relatively unchanged. As far as structure is concerned, we see an overhead weekly supply drawn from 1.0092-0.9928 while below there’s a weekly support seen at 0.9508 (coincides with a weekly trendline support taken from the low 0.8703). Both areas have proved reliable in the past so the two will remain firmly on our radar this week.
Daily view: The story on the daily chart shows that whilst price found bids around the daily support area at 0.9819-0.9784, a small daily demand zone marked with a green arrow at 0.9739-0.9765 was also tagged. Beyond these two zones, there’s little stopping price from diving down to greet the daily support area at 0.9708-0.9660. However, from current price there’s limited upside potential since a daily trendline resistance is seen lurking just above (1.0092).
H4 view: After a bout of stronger than expected US economic data hit the wire, the USD/CHF rocketed higher on Friday, taking out the 0.98 handle and reaching highs of 0.9846. Consequent to a relatively stable opening this morning, here’s what’s currently on our radar today and possibility going into the week…
Well to begin with, we like the H4 Quasimodo resistance level at 0.9865 due to it fusing beautifully with a daily trendline resistance taken from the high 1.0092. Beyond this line, however, we have our beady little eye on the two H4 supply zones seen at 0.9920-0.9899 and 0.9950-0.9934. The lower of the two boasts a deep H4 88.6% Fib resistance at 0.9906, as well as the 0.99 handle which is also a daily resistance line! The upper H4 supply, the better zone of the two in our opinion, does not necessarily have any merging structures, but it is glued to the underside of the above said weekly supply zone!
Our suggestions: Watch the above said zones for potential sell trades this week. Each area, as we’ve shown, has different qualities thus a bounce is possible from any of the three barriers. If you’re unsure of a level, it is recommended to wait for lower timeframe confirmation to form before risking capital (see the top of this report). Personally, out of the three zones, the only area that a we’d risk trading with a market order is at the 0.9950-0.9934 H4 supply zone due to its position on the weekly chart.

Levels to watch/live orders:
- Buys: Flat (Stop loss: N/A).
- Sells: 0.9865 region [Tentative – confirmation required] (Stop loss: dependent on where one confirms this area). 0.9920-0.9899 [Tentative – confirmation required] (Stop loss: dependent on where one confirms this area). 0.9933 [Possible entry at market here depending on the time of day] (Stop loss: 0.9955).
DOW 30:
Weekly gain/loss: + 378 points
Weekly closing price: 18499
Weekly opening price: 18499
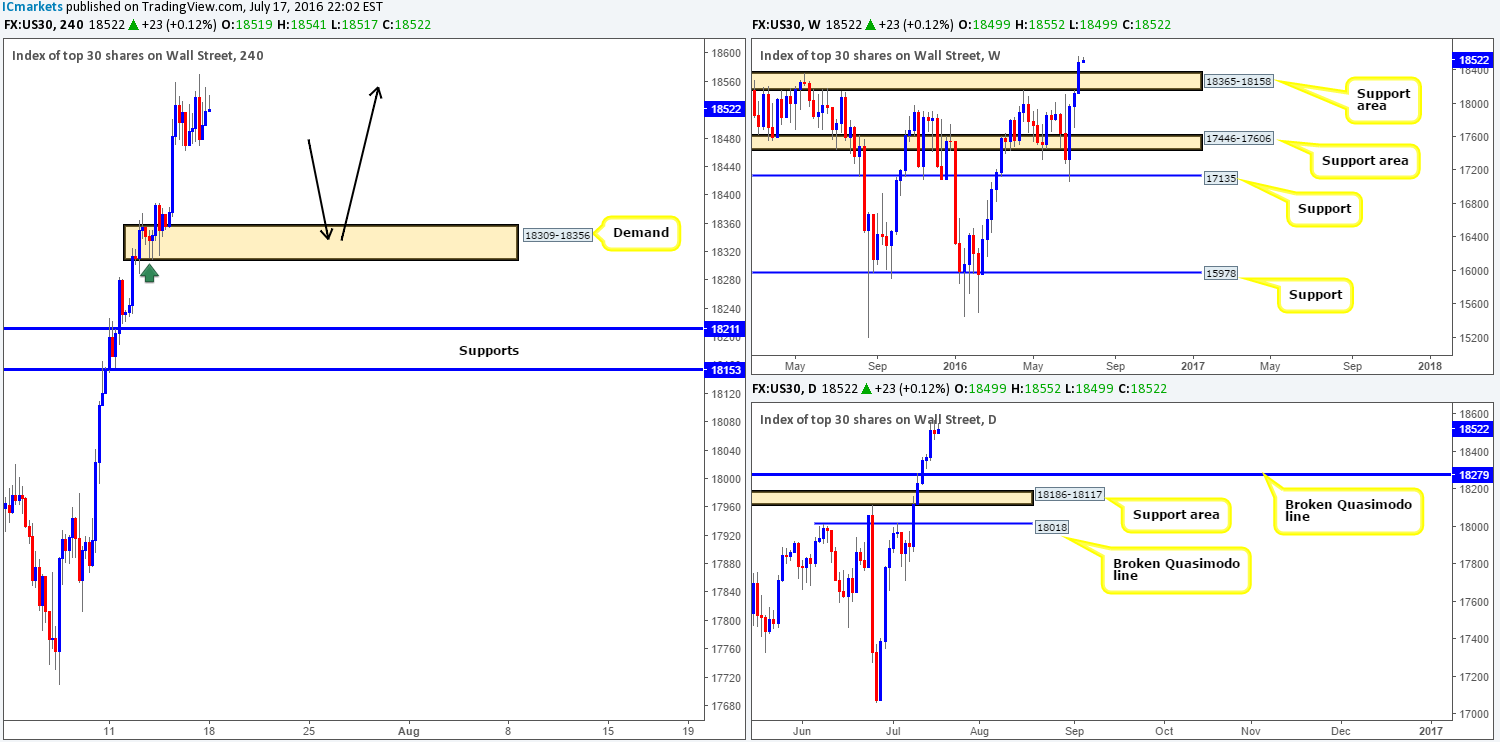
Weekly view: From a weekly viewpoint, we can see that weekly buyers printed a third consecutive bull candle last week, consequently engulfing the weekly resistance area at 18365-18158, and reaching an all-time high of 18571. Technically, further upside is likely on the cards over the coming weeks, with the possibility of seeing a retest at 18365-18158 as support.
Daily view: A very similar story is seen on the daily chart. The daily Quasimodo resistance line at 18279 was engulfed going into Tuesday’s session last week, which could be retested later on this week as support. Because this barrier is lodged within the above said weekly support area, it is certainly worth making a note of!
H4 view: In light of a relatively calm opening this morning, and very little noteworthy movement to report during Friday’s trading, our approach to this market this week is simple. There’s very little to suggest selling this market at this time. With that said, the team will look to ‘buy the dips’ until price action suggests otherwise. Our first port of call will be the H4 demand zone coming in at 18309-18356 (see black arrows). This base is housed nicely within the recently broken weekly resistance area at 18365-18158 (now an acting support area), and sits just above a broken daily Quasimodo level mentioned above at 18279. In addition to this, the tails seen marked on the H4 chart with a green arrow represent buying interest around this level, thus there is a strong possibility, given the higher timeframe picture as well, that there are unfilled orders still residing here.
Our suggestions: Watch for a lower timeframe buy entry from the H4 demand area mentioned above at 18309-18356. The reason for requiring extra confirmation here simply comes down to the possibility that price may fake beyond the aforementioned H4 demand into the broken daily Quasimodo line. For those who struggle to find reliable setups on the lower timeframes, please see the top of this report for a list of techniques we regularly use.
Levels to watch/live orders:
- Buys: 18309-18356 [Tentative – confirmation required] (Stop loss: dependent on where one confirms this area).
- Sells: Flat (Stop loss: N/A).
GOLD:
Weekly gain/loss: – $29
Weekly closing price: 1337.1
Weekly opening price: 1337.1
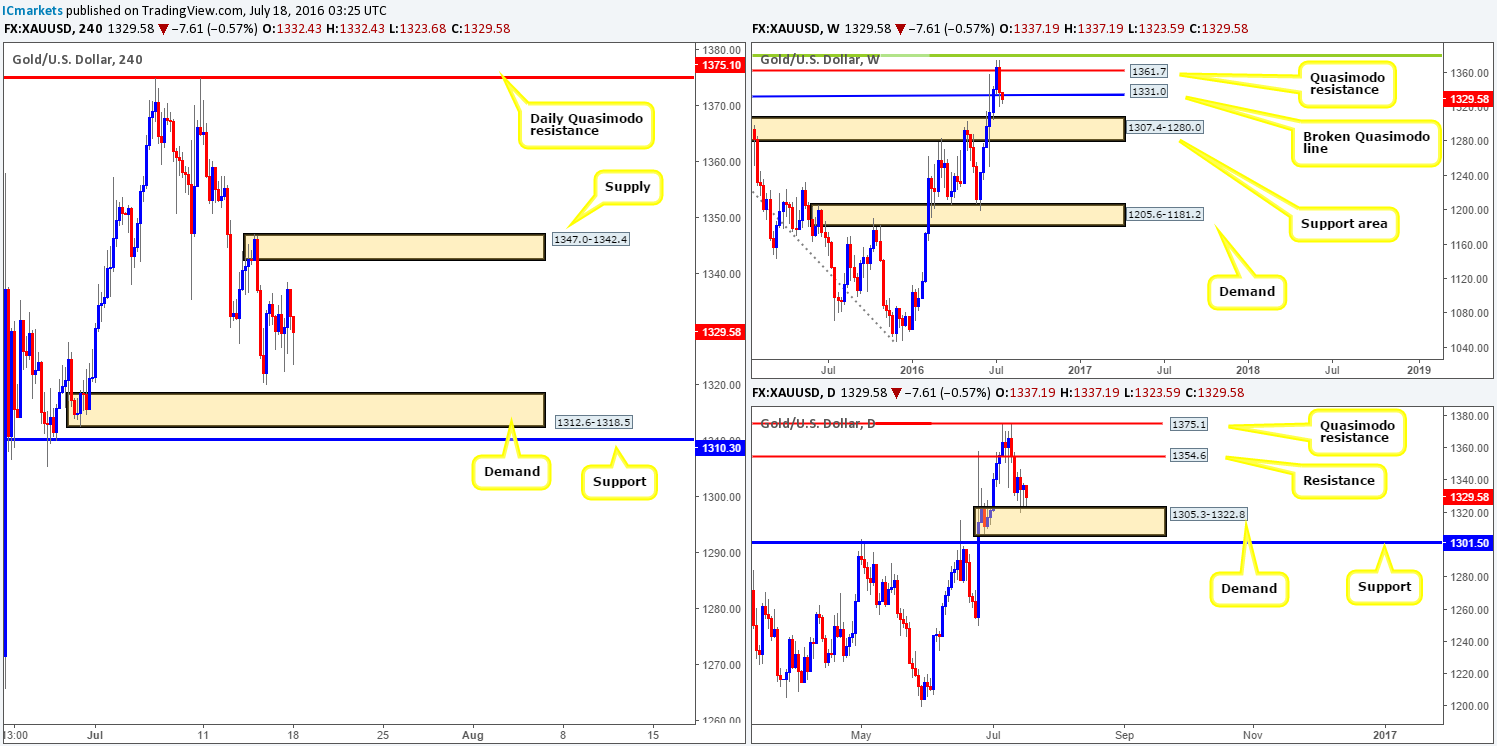
Weekly view: Following six weeks of gains, the yellow metal rotated from a weekly Quasimodo resistance level seen at 1367.7 last week. In consequence to this, gold was forced to connect with a broken weekly Quasimodo line coming in at 1331.0. As of this moment, the buyers look as though they’re struggling to find a foothold around this line, which could indicate that bullion may be heading further south to test the weekly support area chalked up at 1307.4-1280.0.
Daily view: In spite of weakness being seen around the current weekly level, daily action reveals that the metal is facing off with a daily demand base carved from 1305.3-1322.8. This – coupled with nearby daily support at 1301.5 seen just below, could be enough to half further selling in this market this week.
H4 view: A quick recap of Friday’s sessions show that price entered into a phase of consolidation between 1336.5/1328.8. Technically, there is room to move either way today it seems. Overhead, there’s a H4 supply area visible at 1347.0-1342.4, and below a H4 demand base is seen coming in at 1312.6-1318.5.
Our suggestions: Neither a long nor short seems attractive at this time. A long from the current H4 demand would place one against potential weekly sellers! While a short from the current H4 supply, not only opens one up to the possibility of a fakeout up to daily resistance drawn from 1354.6, but also places one against daily buyers from the current daily demand!
Therefore, our team has come to a general consensus that remaining on the sidelines today and reassessing the day’s action tomorrow is the best path to take.
Levels to watch/live orders:
- Buys: Flat (Stop loss: N/A).
- Sells: Flat (Stop loss: N/A).


