
EUR/USD:
Weekly gain/loss: -0.26%
Weekly close: 1.1290
Weekly perspective:
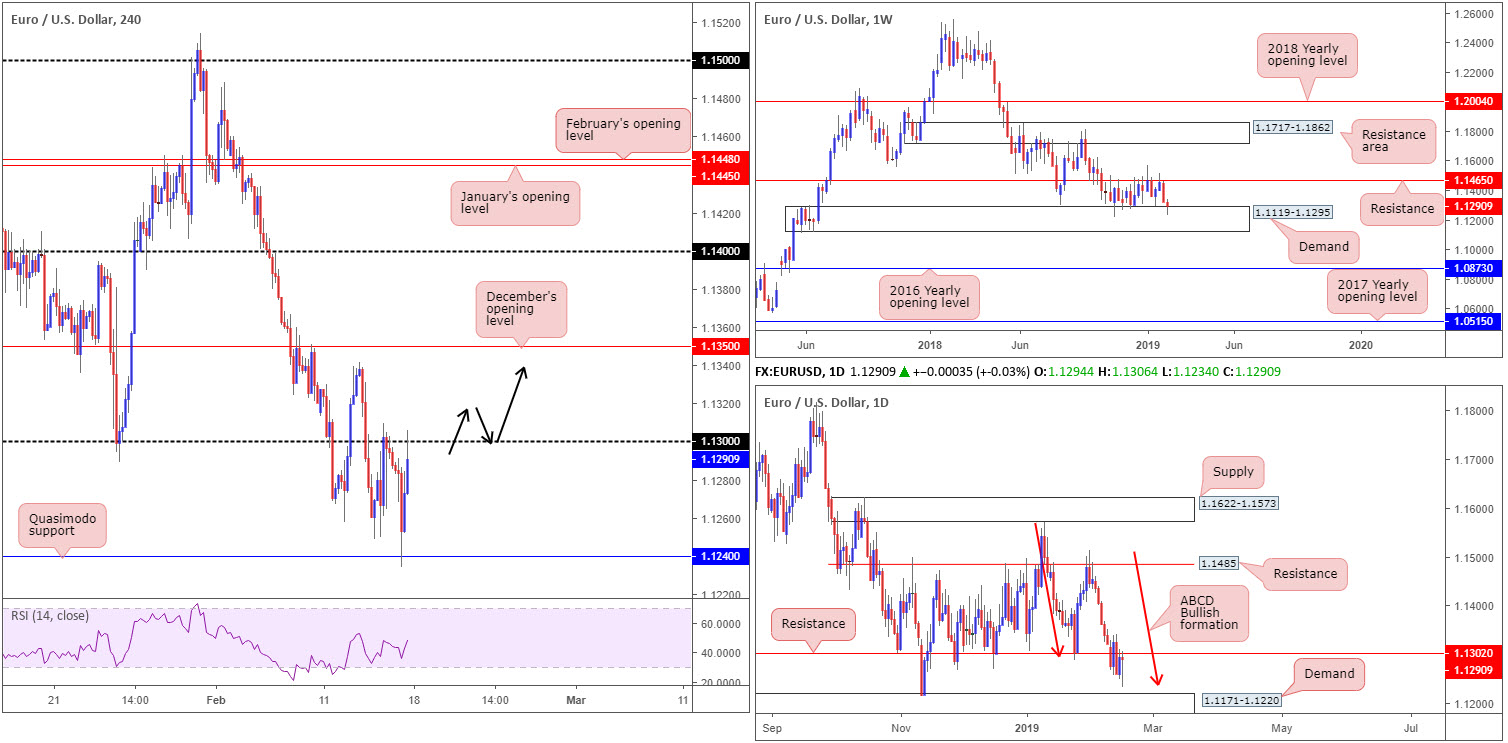
Since October 2018, the buyers and sellers have been battling for position between a long standing support/resistance at 1.1465 and a notable demand area coming in at 1.1119-1.1295. As is evident from the chart, the week concluded around the lower edge of this consolidation, therefore buyers may enter the fold this week. Outside of these areas, however, zones on the radar fall in at a resistance area drawn from 1.1717-1.1862 and the 2016 yearly opening level at 1.0873.
Daily perspective:
Following Wednesday’s near-full-bodied break of support at 1.1302, Friday’s movement shook hands with a ABCD bullish completion point (red arrows) around 1.1240 and ended the day recoiling towards the underside of 1.1302 as resistance. Note the ABCD pattern is positioned 20 pips north of a demand area seen at 1.1171-1.1220.
In the event we push back above 1.1302 this week, the next upside objective in view on the daily timeframe rests at resistance carved from 1.1485 – 20 pips above the current weekly resistance level.
H4 perspective:
For traders who read Friday’s briefing you may recall the piece highlighting 1.1220/1.1240 as a potential long play. Comprised of a H4 Quasimodo support at 1.1240 and the daily ABCD bullish completion (also at 1.1240) underlined above, as well as the top edge of nearby daily demand printed at 1.1220, this small, yet highly efficient, zone rebounded price action amid the early hours of US trading and struck the underside of 1.13 into the closing bell (1.13 merges closely with daily resistance at 1.1302). What also gave 1.1220/1.1240 extra credibility is it is located within the upper limit of the weekly demand area mentioned above at 1.1119-1.1295.
Well done to any of our readers who managed to jump aboard this move. The risk/reward offered here is mouth-watering.
Areas of consideration:
A break above 1.13 this week (and also the daily resistance at 1.1302) has the 1.1341 Feb 13 high to target on the H4 scale, shadowed closely by December’s opening level plotted at 1.1350. A long on the retest of 1.13 as support (black arrows – preferably off the back of a H4 bullish candlestick signal as this will help define entry/stop parameters), therefore, is certainly something to keep a watchful eye on going forward. This is an ideal location to either pyramid longs from 1.1220/1.1240, or for fresh buyers looking to join the market.
One final point to consider is 1.1350: December’s opening is not the final upside target here. We could potentially stretch as far north as 1.1485, according to our reading on the daily timeframe.
Today’s data points: US banks are closed in observance of Presidents’ Day.
GBP/USD:
Weekly gain/loss: -0.40%
Weekly close: 1.2884
Weekly perspective:
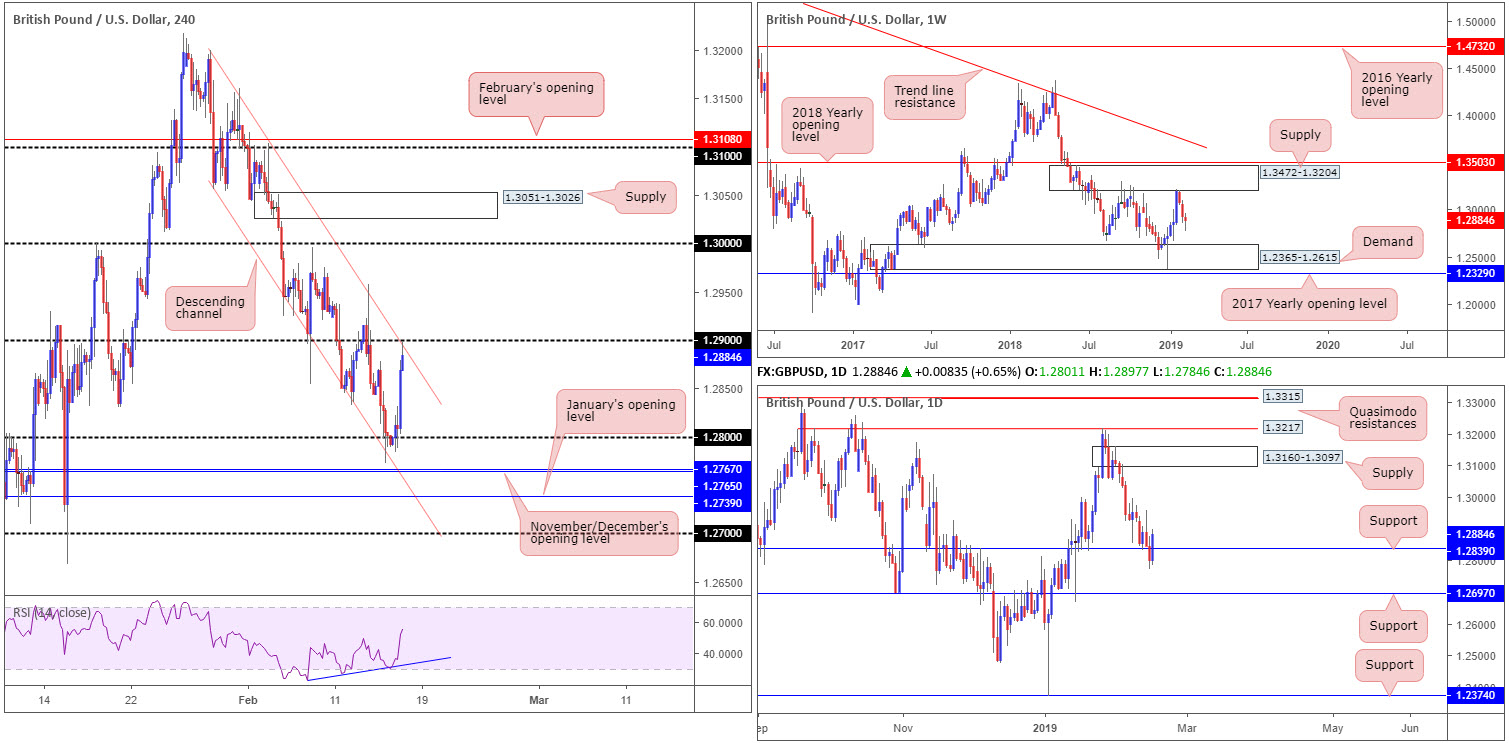
After cable found itself engaging with the lower border of supply drawn from 1.3472-1.3204, the pair encountered three weeks of uninterrupted losses. According to this timeframe, sellers remain in the driving seat with the next obvious downside target seen at demand carved from 1.2365-1.2615.
Daily perspective:
Contrary to weekly flow eyeing lower levels, daily activity snapped back above resistance at 1.2839 Friday in strong fashion. Should this level act as support this week, additional buying could materialise and potentially drag the pair as far north as supply at 1.3160-1.3097, sited just south of the current weekly supply.
H4 perspective:
While sterling continues to succumb to Brexit uncertainty after another crushing defeat for UK PM May in Parliament last week, the pair received some much-needed respite Friday following an upbeat UK retail sales print. The monthly growth rate in the quantity bought increased by 1.0% in January 2019, following a decline of 0.7% in December 2018, according to the Office for National Statistics.
From a technical standpoint, the candlesticks rotated higher from channel support (etched from the low 1.3055), reclaimed 1.28 to the upside and advanced towards 1.29, which happens to fuse with the opposite end of the current channel (taken from the high 1.3199).
Areas of consideration:
Having observed weekly price poised to explore lower ground and H4 action recently connect with a channel resistance and nearby 1.29 handle, the pendulum appears to be swinging toward more of a selloff. For conservative traders wishing to add a little confirmation to the mix, waiting for a H4 candlestick sell signal to form from 1.29 is an option. Not only will this structure display seller intent, it’d also provide traders entry and stop levels to work with.
The first downside target from the 1.29 region can be seen at daily support mentioned above at 1.2839, followed closely by the 1.28 handle.
Today’s data points: US banks are closed in observance of Presidents’ Day.
AUD/USD:
Weekly gain/loss: +0.78%
Weekly close: 0.7140
Weekly perspective:
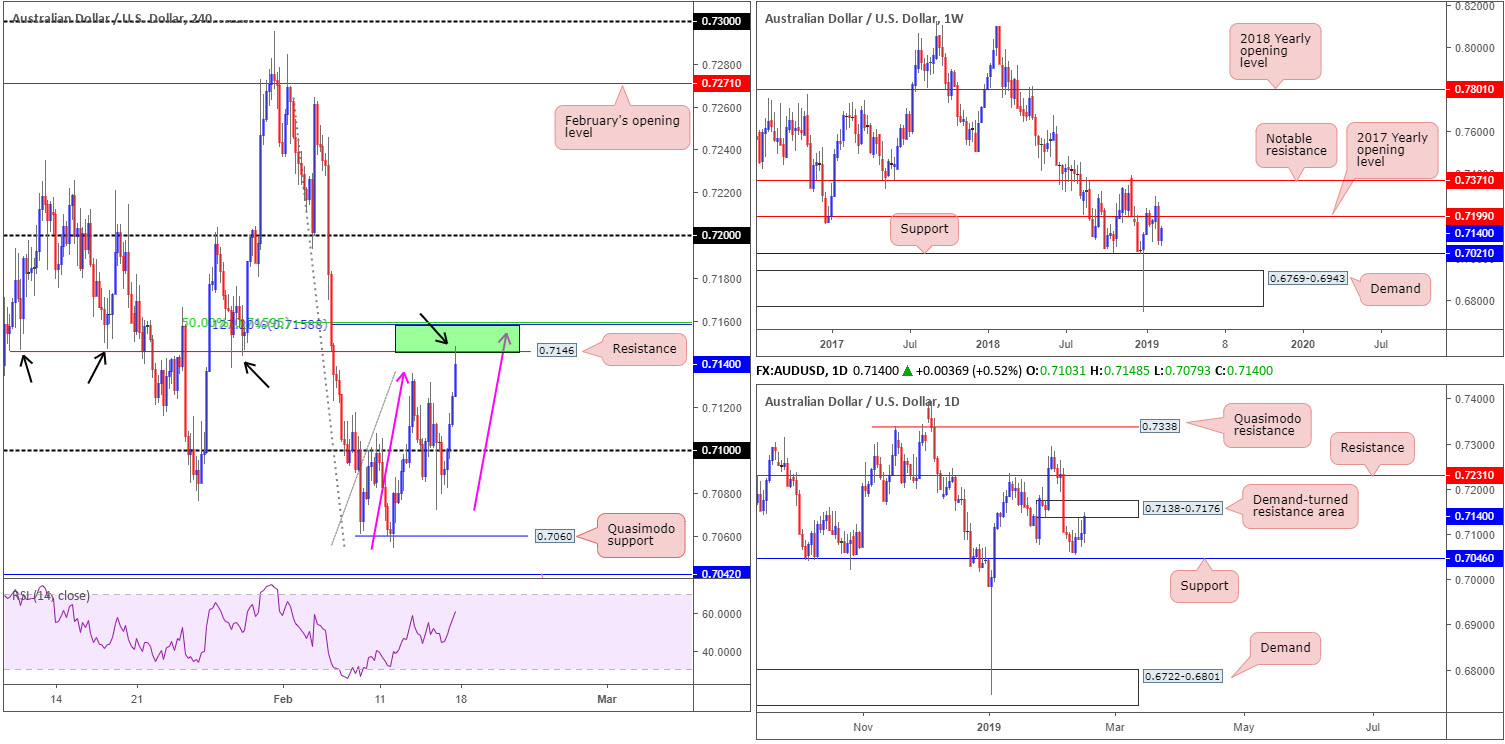
Despite last week’s action recapturing a portion of the prior week’s losses, structure on the weekly timeframe remains unaffected. To the upside, we have the 2017 yearly opening level as potential resistance at 0.7199 to focus on this week, whereas to the downside support falls in around the 0.7021 neighbourhood.
Daily perspective:
Leaving support at 0.7046 unchallenged last week, the commodity-linked currency rallied into the jaws of a nearby demand-turned resistance area at 0.7138-0.7176. Should we overthrow this zone this week, the next port of call can be seen at a resistance level marked at 0.7231, sited a little more than 30 pips above the current weekly resistance.
H4 perspective:
A quick recap of Friday’s trade on the H4 timeframe reveals the candles declined in early hours, led by soft Chinese inflation data. Despite this, a swift recovery took shape into the London session, bolstered by a waning US dollar and some optimistic trade-related comments out of recent US/China negotiations.
The move higher, as is evident from the chart, formed the D-leg of a nice-looking AB=CD bearish pattern (pink arrows) that completes around 0.7155. What’s also notable nearby this region (green) is a resistance level coming in at 0.7146, a 127.2% Fibonacci ext. point (connected to the AB=CD formation) at 0.7158 and a 50.0% resistance value at 0.7159.
Areas of consideration:
Seeing the H4 candles dipping its toes into a rather appealing H4 area of confluence (green), along with daily flow crossing swords with the underside of a resistance area at 0.7138-0.7176, a rotation lower may take shape today/early week.
For traders feeling threatened by weekly price exhibiting scope to press beyond the current daily resistance area, waiting for additional confirmation to form out of the highlighted H4 sell zone is an option before pulling the trigger. Two reasonably basic, yet highly effective, methods of confirmation are a H4 bearish candlestick formation printed out of the zone, or simply drilling down to the lower timeframes and searching for a support-turned resistance level to sell that’s also bolstered by candlestick confirmation. Both techniques provide entry and stop levels, with the first obvious take-profit target set around 0.71.
Today’s data points: US banks are closed in observance of Presidents’ Day.
USD/JPY:
Weekly gain/loss: +0.66%
Weekly close: 110.45
Weekly perspective:
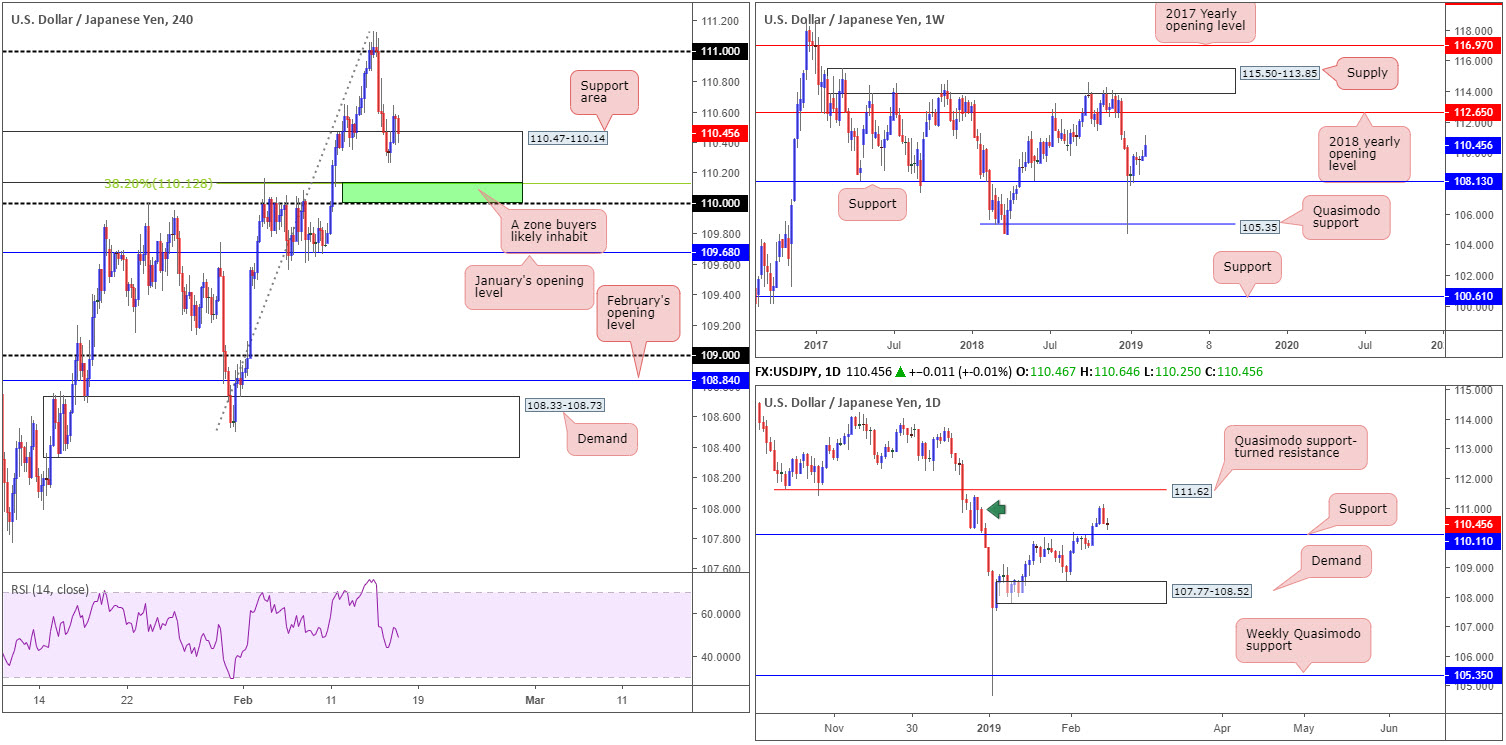
USD/JPY bulls went on the offensive last week, achieving highs at 111.12. As long as the unit remains above support drawn from 108.13, upside on this timeframe is relatively free until connecting with its 2018 yearly opening level at 112.65.
Daily perspective:
Following Thursday’s strong bearish rotation candle, the market generated little follow-through movement. Surrounding structure on this timeframe consists of a supply area at 111.40-110.27 (green arrow), a support level coming in at 110.10 and a Quasimodo support-turned resistance at 111.62.
The aforementioned support level will likely enter the fold sometime this week, which we believe will hold ground given where we’re trading on the weekly timeframe. This will eventually run stops above the current supply and bring in sellers from 111.62.
H4 perspective:
Renewed trade optimism between the US and China, along with impressive gains observed in US equities and the H4 candles trading within the upper limit of a rather large support area at 110.47-110.14, provided a floor for the USD/JPY market Friday.
Beneath the current support zone, traders may also want to pencil in daily support mentioned above at 110.11, shadowed closely by the 110 handle. Both levels boast relatively strong history, with the daily barrier positioned close by a 38.2% H4 Fibonacci support value at 110.12.
Areas of consideration:
Having observed weekly action poised to attack higher levels this week, as well as daily support plotted nearby, the green zone marked on the H4 timeframe between 110/110.12 (the round number 110, the daily support at 110.11 and the 38.2% H4 Fibonacci support at 110.12) is worthy of the watchlist today/this week. The only caveat, nevertheless, is the possibility of a stop run materialising through 110 (common viewing around psychological numbers) before an advance is seen. To help avoid being stung, waiting for additional H4 candlestick confirmation to form out of the zone is an idea (entry/stop levels can be defined according to the candlestick’s rules of engagement).
Today’s data points: US banks are closed in observance of Presidents’ Day.
USD/CAD:
Weekly gain/loss: -0.24%
Weekly close: 1.3242
Weekly perspective:
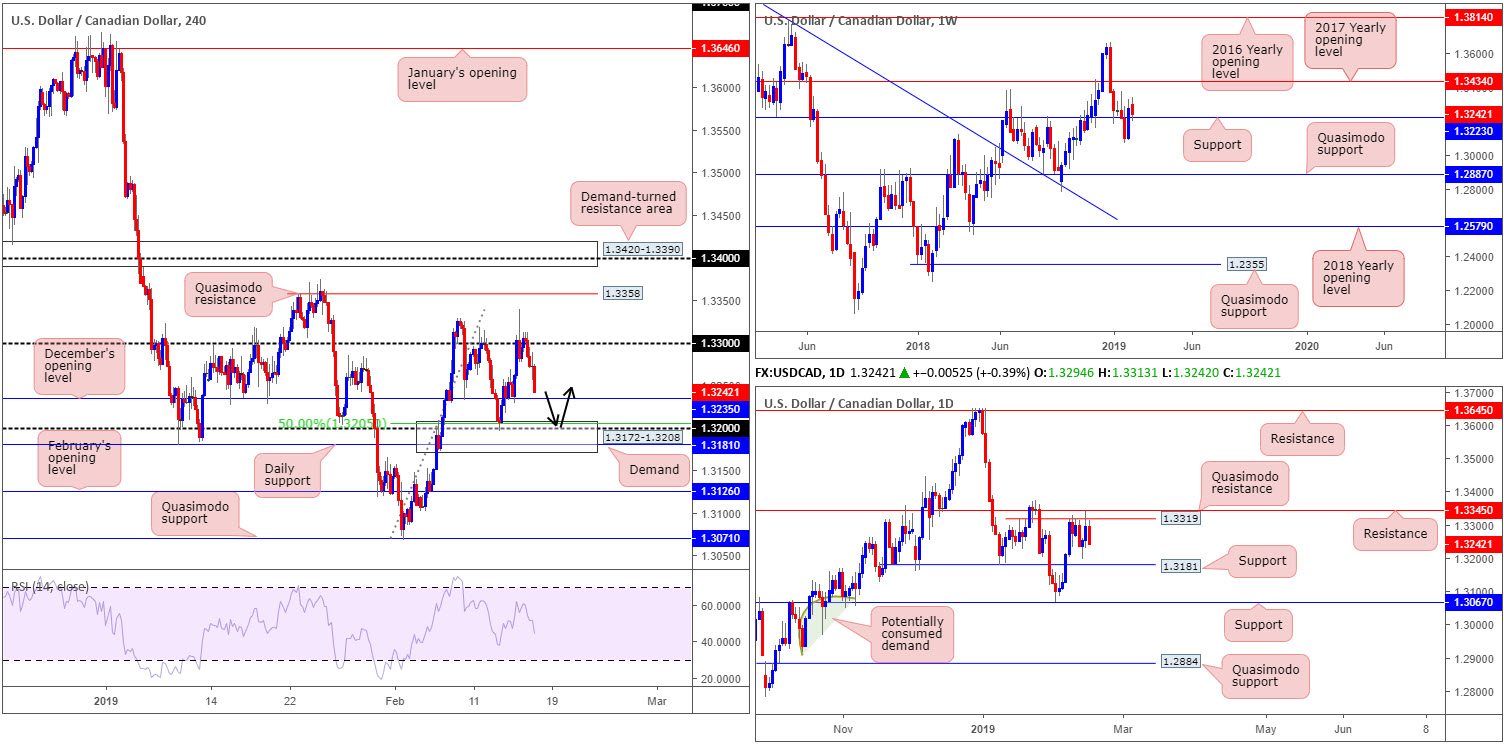
After reclaiming two weeks’ worth of losses and recapturing resistance at 1.3223 two weeks ago, last week’s action retested 1.3223 as support and contained losses. By and large, though, the research team are uninspired by the response off the said support. While an advance towards the 2017 yearly opening level at 1.3434 is still not out of the question, traders should prepare for the possibility of price crossing beneath 1.3223 this week and perhaps making a run in the direction of Quasimodo support coming in at 1.2887.
Daily perspective:
Since Feb 7, the daily candles have had upside capped by Quasimodo resistance at 1.3319, shadowed closely by another coating of resistance priced in at 1.3345. Friday’s motion, as you can see, concluded the week by way of a near-full-bodied bearish candle and, therefore, could spur additional selling today/early week towards support dressed nearby at 1.3181.
H4 perspective:
Reviewing Friday’s action on the H4 timeframe shows the USD/CAD came under pressure in early London. Weighed on by a declining US dollar that snapped beneath its 97.00 handle and a robust oil market, which favours CAD longs, the pair sold off beneath 1.33 and wrapped up the week a few pips north of December’s opening level at 1.3235.
Underneath 1.3235, nearby support rests at 1.32 (merges with a 50.0% support value at 1.3205), tailed closely by the daily support level mentioned above at 1.3181. Note 1.32 and 1.3181 are also enveloped within a proven demand area seen at 1.3172-1.3208.
Areas of consideration:
The H4 demand area mentioned above at 1.3172-1.3208 is of interest for a potential long play, having noted its surrounding confluence (see above in bold). With stop-loss orders set beneath 1.3172, buyers will likely be looking for a H4 close above December’s opening level at 1.3235 before reducing risk to breakeven. Ultimately, to secure reasonable risk/reward, however, the underside of 1.32 stands as an initial take-profit target.
Today’s data points: US banks are closed in observance of Presidents’ Day.
USD/CHF:
Weekly gain/loss: +0.51%
Weekly close: 1.0049
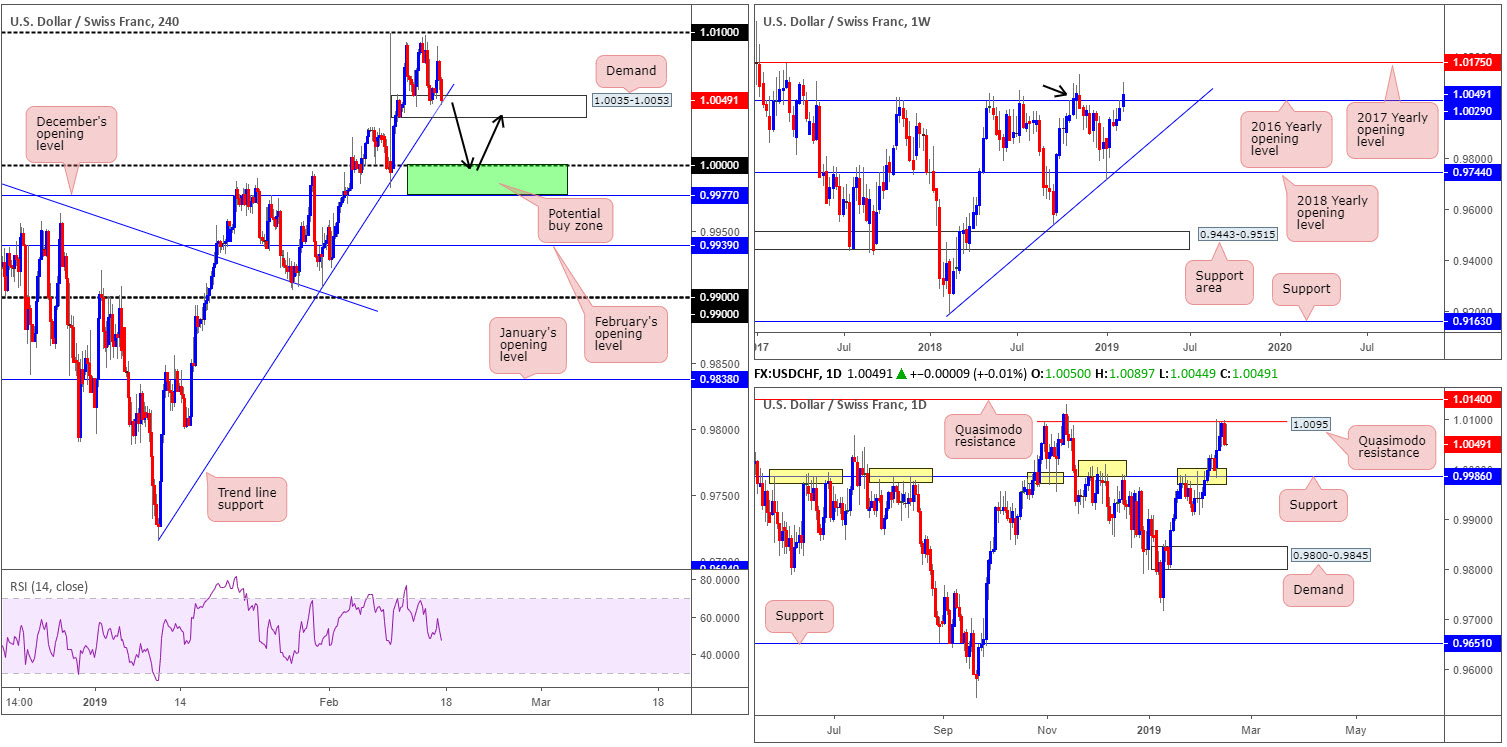
Weekly perspective:
The USD/CHF, as you can see, remains trading with a reasonably strong bias to the upside, recording its third consecutive weekly gain in recent trade. While the unit is attempting to establish some ground above the 2016 yearly opening level at 1.0029, the barrier’s history as a resistance may still draw in sellers as it did in November 2018 (black arrow).
Daily perspective:
Despite weekly flow suggesting a possible continuation to the upside this week, daily players failed to overthrow Quasimodo resistance at 1.0095 last week. What’s also notable from a technical perspective is Friday’s movement closing in the shape of a bearish pin-bar formation, with room seen to extend as far south as a long-standing resistance/support at 0.9986.
H4 perspective:
Demand at 1.0035-1.0053, which happens to merge with a trend line support (extended from the low 0.9716), remained in play on the H4 timeframe Friday. It might be worth noting the demand is sited a few pips north of the 2016 yearly opening level mentioned above on the weekly timeframe.
To the upside from 1.0035-1.0053 resistance falls in around the 1.01 handle (positioned just north of the daily Quasimodo resistance at 1.0095). Beneath the demand, nonetheless, 1.0000 (parity) is seen, followed closely by December’s opening level at 0.9977. Note this widely watched round number is located 14 pips above the daily support at 0.9986.
Areas of consideration:
While the current H4 demand and intersecting trend line support is a tempting platform to initiate longs from, daily price trading from a Quasimodo resistance with room to move lower and weekly price tackling a monster of a resistance, will likely overthrow the H4 barriers.
The combination of the daily support mentioned above at 0.9986 and 1.0000 offers a support to keep an eye on this week, which may bounce price higher (stop-loss orders can be planted below December’s opening level at 0.9977), with the first take-profit target residing around the underside of 1.0035-1.0053 (will be a demand-turned resistance area at this point).
Today’s data points: US banks are closed in observance of Presidents’ Day.
Dow Jones Industrial Average:
Weekly gain/loss: +3.18%
Weekly close: 25896
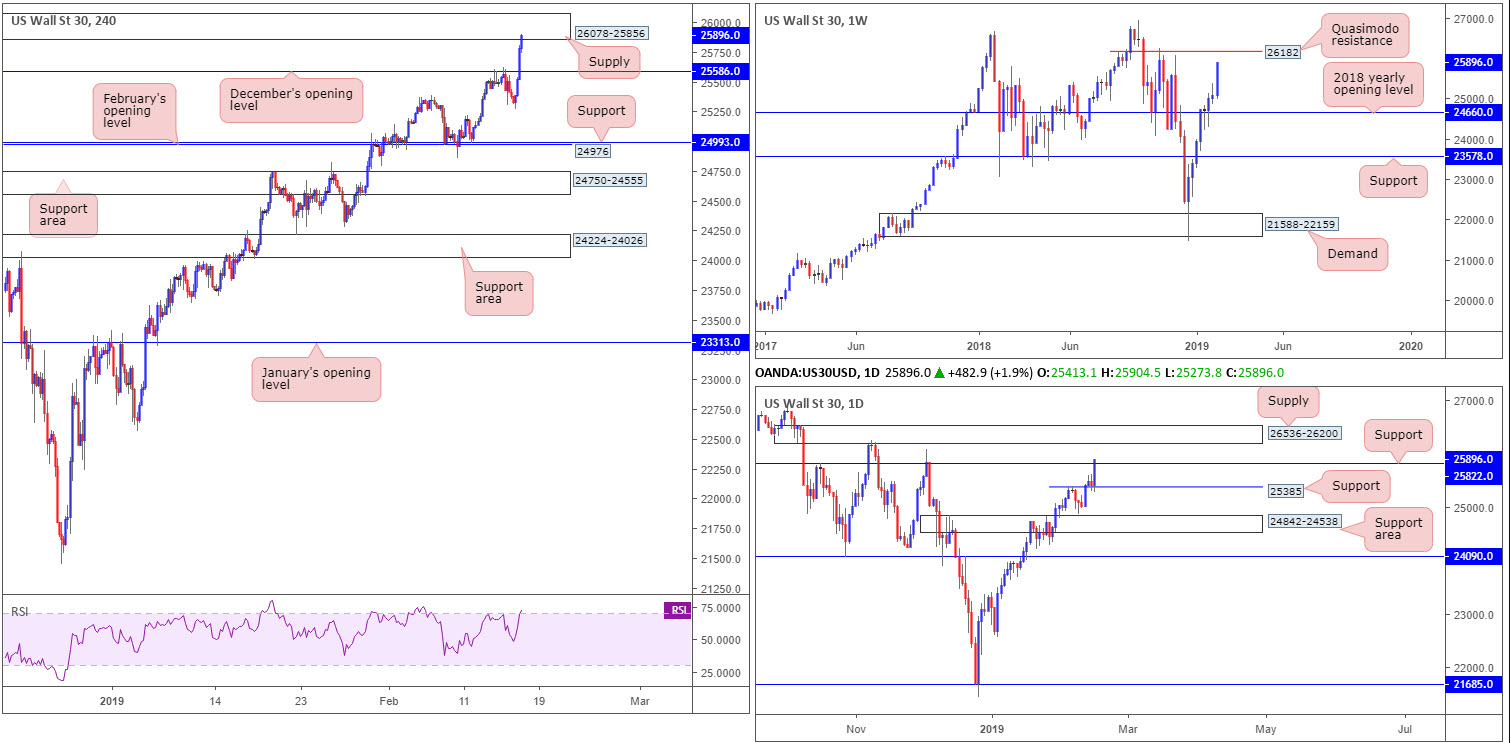
Weekly perspective:
Since clearing and retesting the 2018 yearly opening level at 24660 as support, the Dow Jones Industrial Average, in the shape of a near-full-bodied bull candle, has been on a tear, up 800 points last week. Further buying this week has Quasimodo resistance at 26182 to target.
Daily perspective:
Recent trade observed the daily candles establish support off 25385 (broken high-turned support) and marginally close above 25822. In the event this level holds firm as support this week, upside appears reasonably free until connecting with supply at 26536-26200 (sited just north of the weekly Quasimodo resistance).
H4 perspective:
According to CNBC, The United States and China will also resume trade talks this week in Washington. US President Donald Trump repeated on Friday he may extend a March 1 deadline for a deal and keep tariffs on Chinese goods from rising. Both the United States and China reported progress in five days of negotiations in Beijing last week.
Trade optimism provided fresh impetus Friday, pulling the candles beyond December’s opening level at 25586 into the walls of a supply zone coming in at 26078-25856. Note this supply is positioned directly beneath daily supply mentioned above at 26536-26200.
Areas of consideration:
Although US equities trade with a strong upside bias, notable resistance is on the horizon. We have Quasimodo resistance out of the weekly timeframe at 26182, which is sited just beneath daily supply at 26536-26200, which itself is sited above H4 supply at 26078-25856. Therefore, taking a long position in this market is difficult, according to our technical studies.
As for selling this week, the research team notes to wait and see if the unit connects with the weekly Quasimodo resistance 26182. Bringing in weekly sellers from here, and also daily sellers from nearby supply at 26536-26200, is likely enough to draw in sellers for a bounce lower. For conservative traders concerned about trading countertrend, waiting for a H4 bearish candlestick formation to print off 26182 is an option. This not only helps decipher whether sellers are active or not, it also provides entry/stop parameters to work with.
Today’s data points: US banks are closed in observance of Presidents’ Day.
XAU/USD (GOLD):
Weekly gain/loss: +0.53%
Weekly close: 1321.1
Weekly perspective:
By way of two back-to-back bullish pin-bar formations off the 2018 yearly opening level at 1302.5, weekly flow appears to be gearing up for another wave of buying this week. With respect to upside targets from the current angle, buyers could potentially stretch this market as far north as resistance plotted at 1357.6.
Daily perspective:
A closer reading on the daily timeframe witnessed the yellow metal rebound from support plotted at 1303.6 last week, concluding the session touching gloves with the underside of supply fixed at 1332.6-1322.3. A move above the current supply has resistance priced in at 1356.8 to target, sited a few pips beneath the weekly resistance mentioned above at 1357.6.
H4 perspective:
For those who read Thursday’s briefing you may recall the piece underlining that all three timeframes pointed to a possible upside move from the weekly support at 1302.5. A strong uptrend, combined with the noted weekly support, a daily support at 1303.6 and a H4 50.0% support value plotted at 1301.5, offered an incredibly strong floor of support. The report also highlighted H4 supply marked in yellow around 1316.9/1311.7 suffered a breach to the upside Wednesday, possibly unlocking the door towards H4 resistance at 1325.4.
As you can see, price behaved as expected and rebounded from the aforementioned weekly support level Thursday and continued to extend north Friday on the back of a declining greenback. Well done to any of our readers who managed to jump aboard.
Areas of consideration:
Traders who remain long may want to consider taking partial profits off the table at this point, as price reached its first take-profit target: the underside of daily supply at 1322.3, which happens to hold the H4 resistance level mentioned above at 1325.4 within its area.
With a portion of the position tightly locked away in the account and risk set to breakeven plus a few pips to cover commissions, the remaining position can now be trailed in the direction of weekly resistance at 1357.6. By trailing a position the research team simply means following price action with your stop-loss order behind swings. For example, one could place their stop behind 1310.3 (red arrow) and wait for the next swing to form before moving stops again.
For those who missed the boat off 1302.5, waiting for H4 price to overthrow the current H4 resistance at 1325.4 is recommended before looking for longs in this market again. A H4 close above this level followed up with a retest as support in the shape of a H4 candlestick signal is a high-probability buy signal, with an ultimate target set at weekly resistance 1357.6.

The accuracy, completeness and timeliness of the information contained on this site cannot be guaranteed. IC Markets does not warranty, guarantee or make any representations, or assume any liability with regard to financial results based on the use of the information in the site.
News, views, opinions, recommendations and other information obtained from sources outside of www.icmarkets.com.au, used in this site are believed to be reliable, but we cannot guarantee their accuracy or completeness. All such information is subject to change at any time without notice. IC Markets assumes no responsibility for the content of any linked site. The fact that such links may exist does not indicate approval or endorsement of any material contained on any linked site.
IC Markets is not liable for any harm caused by the transmission, through accessing the services or information on this site, of a computer virus, or other computer code or programming device that might be used to access, delete, damage, disable, disrupt or otherwise impede in any manner, the operation of the site or of any user’s software, hardware, data or property.


