
DXY:
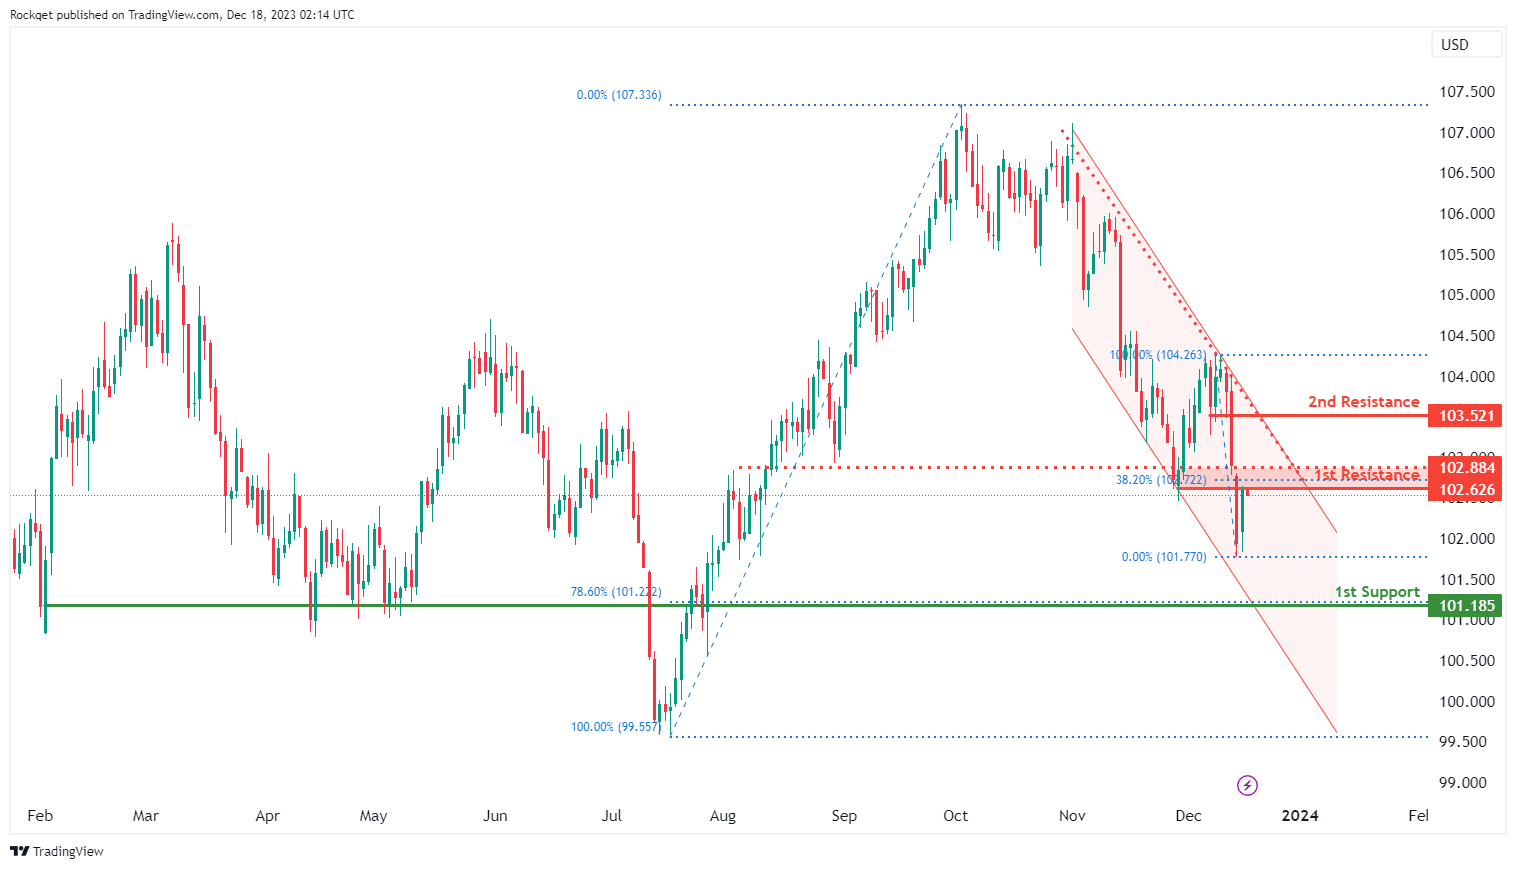
The DXY (US Dollar Index) chart currently shows an overall bearish momentum, indicating a potential for price to make a bearish reaction off the 1st resistance and fall towards the 1st support.
The 1st resistance level at 102.62 is identified as an overlap resistance that aligns close to the 38.20% Fibonacci retracement level. Higher up, the 2nd resistance level at 103.52 is marked as a pullback resistance, suggesting a potential barrier for further upside movement.
To the downside, the 1st support level at 101.18 is identified as a pullback support that aligns with the 78.60% Fibonacci retracement level, further reinforcing its importance as a potential key support level.
EUR/USD:
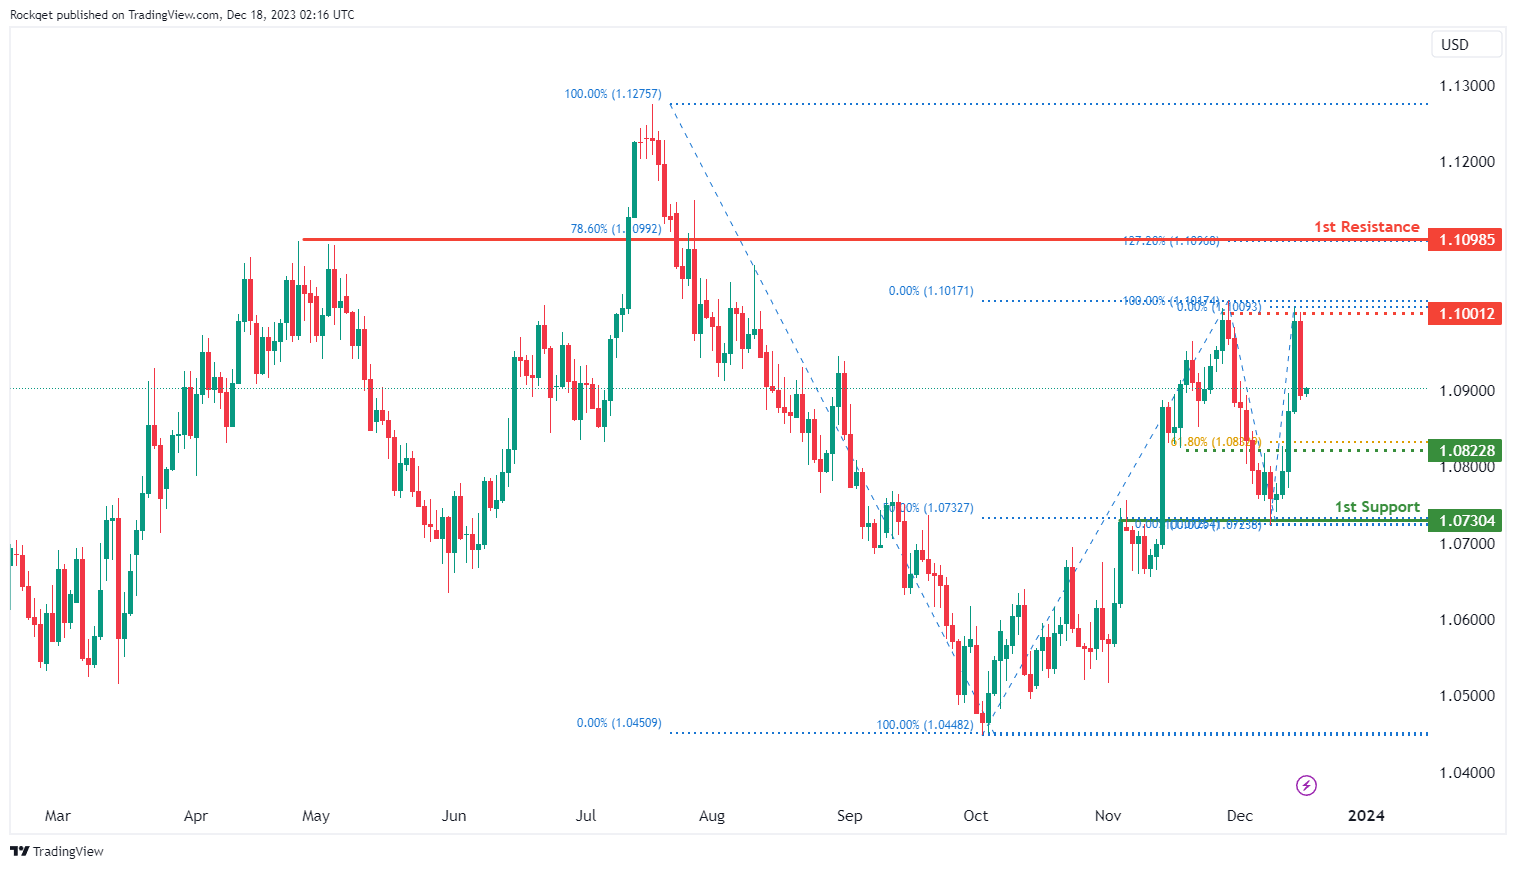
The EUR/USD chart currently exhibits an overall bullish momentum. However, there is a potential scenario for price to fluctuate between the intermediate resistance and intermediate support levels.
The intermediate resistance level at 1.1001 is identified as a pullback resistance. Higher up, the 1st resistance level at 1.1098 is also noted as a pullback resistance that aligns with a confluence of Fibonacci levels i.e. the 127.20% extension and the 78.60% retracement levels, suggesting a potential barrier for further upside movement.
To the downside, the intermediate support level at 1.0822 is identified as an overlap support that aligns close to the 61.80% Fibonacci retracement level. Further below. the 1st support level at 1.0730 is also marked as an overlap support that aligns with the 50.00% Fibonacci retracement level, further reinforcing its importance as a potential key support level.
EUR/JPY:
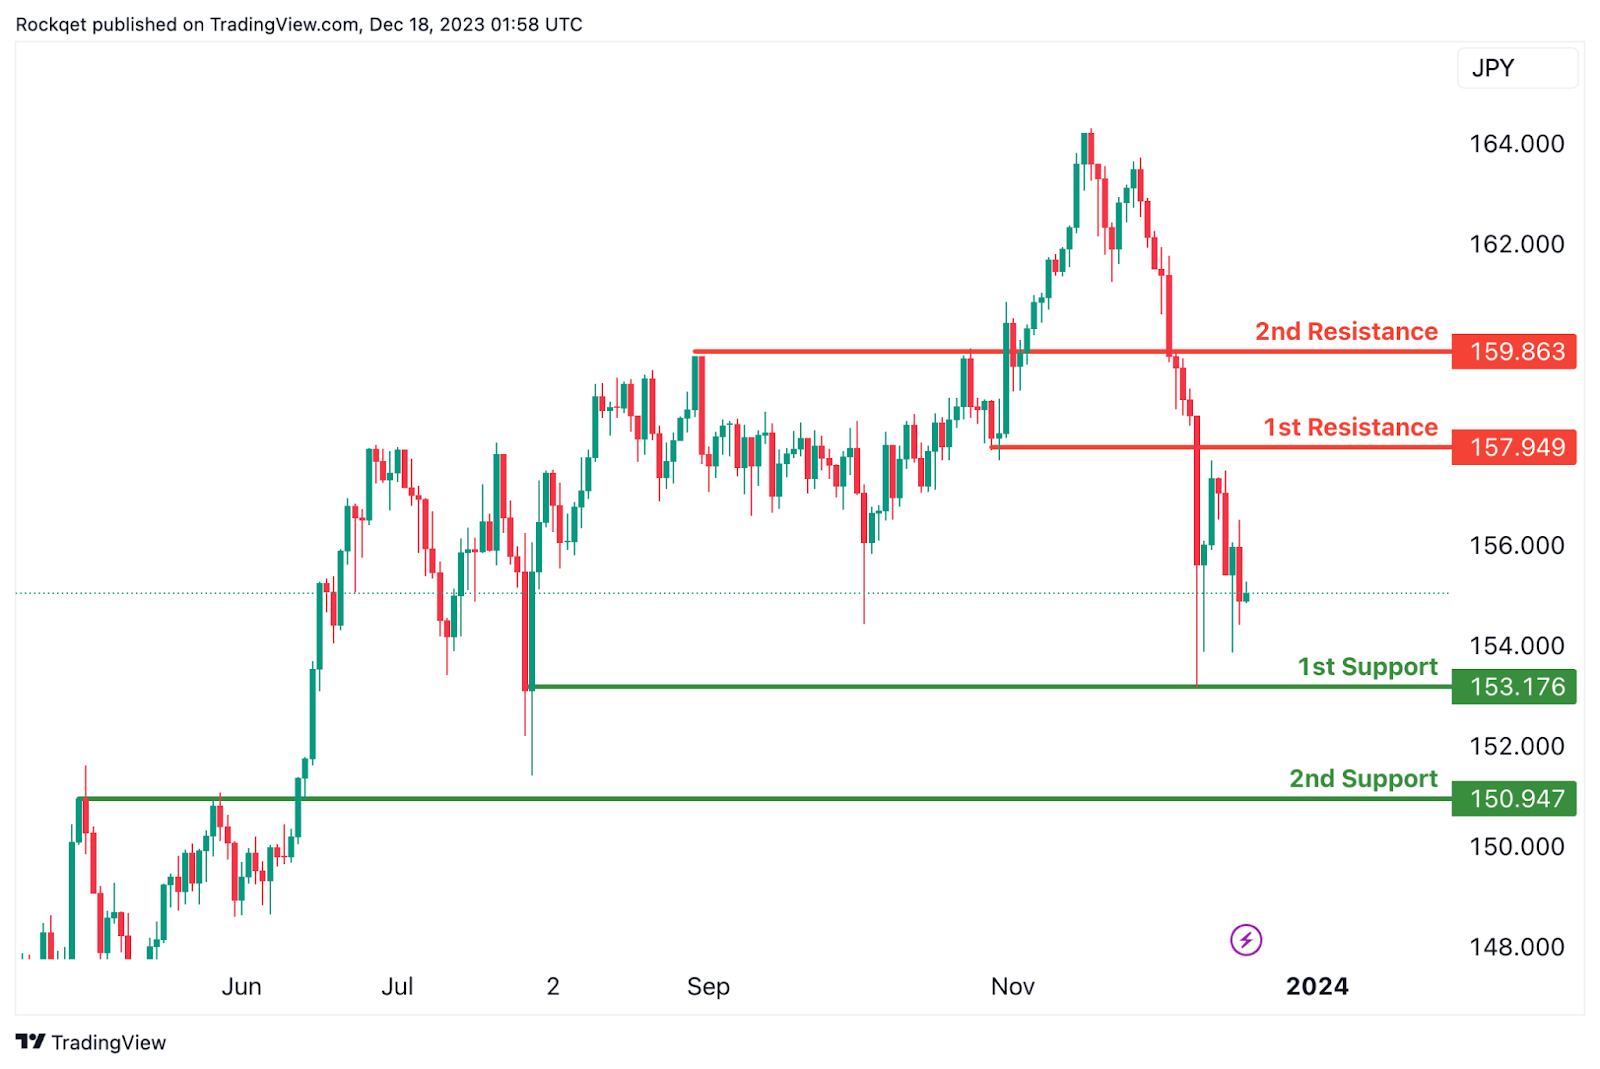
The EUR/JPY chart currently has a bearish overall momentum, and there is a potential scenario where the price could make a short-term rise towards the 1st resistance before reversing off it and dropping towards the 1st support.
The 1st support at 154.92 is considered significant as it represents a pullback support. This level indicates a potential area where buying interest may emerge after a pullback, providing support for the currency pair.
Similarly, the 2nd support at 153.98 is identified as a swing low support. This adds to the support structure, indicating another potential zone where buying interest may be present, further reinforcing the potential for a short-term rise.
On the resistance side, the 1st resistance at 156.57 is associated with a pullback resistance. This level may act as a barrier where selling interest could intensify, potentially causing a temporary pause or reversal in the bearish trend.
Furthermore, the 2nd resistance at 157.95 is characterized as a pullback resistance. This adds another layer of significance to the resistance, suggesting a potential area where selling pressure may increase, especially considering the alignment with another pullback resistance level.
EUR/GBP:
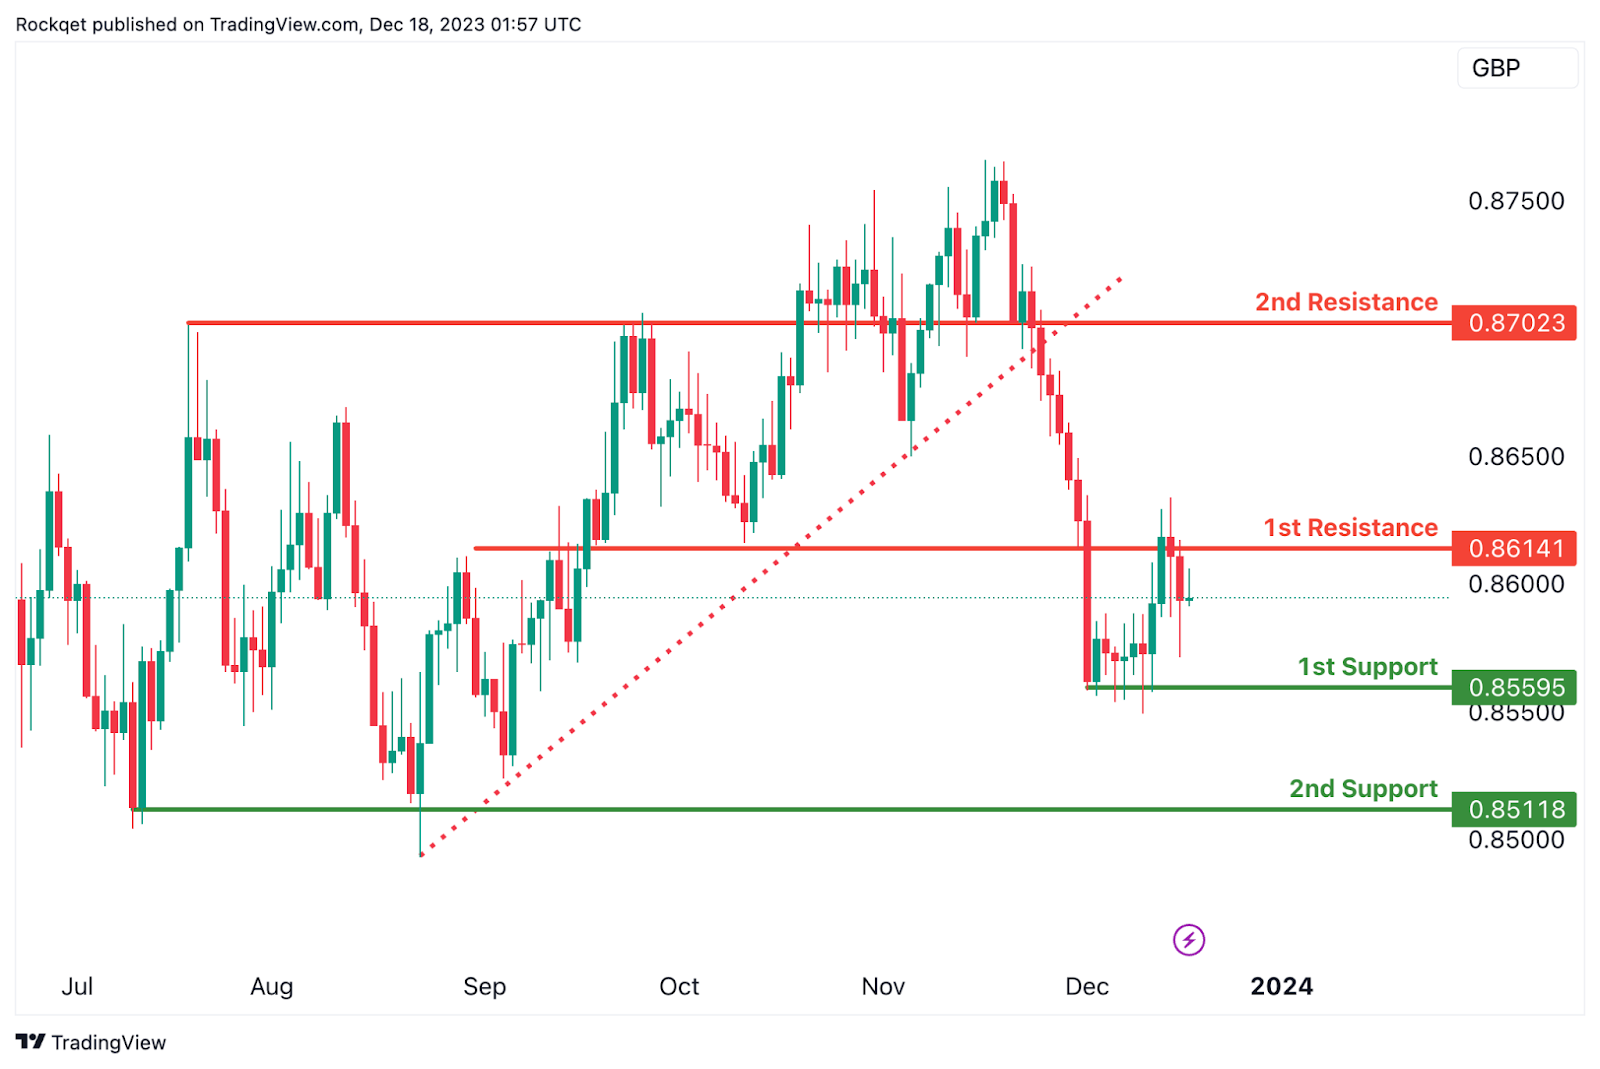
The EUR/GBP chart currently has a bearish overall momentum, suggesting a potential for a bearish continuation towards the 1st support.
The 1st support at 0.8560 is considered significant as it represents a multi-swing low support. This level indicates a historical area where buying interest has been present, reinforcing its potential as a crucial support zone.
Similarly, the 2nd support at 0.8512 is identified as a pullback support. This adds another layer of potential support for the currency pair, indicating a zone where buying interest may emerge after a pullback.
On the resistance side, the 1st resistance at 0.8614 is associated with an overlap resistance. This level may act as a barrier where selling interest could intensify, potentially causing a temporary pause or reversal in the bearish trend.
Furthermore, the 2nd resistance at 0.8702 is characterized as another overlap resistance. This adds another layer of significance to the resistance, suggesting a potential area where selling pressure may increase, especially considering its alignment with another overlap resistance level.
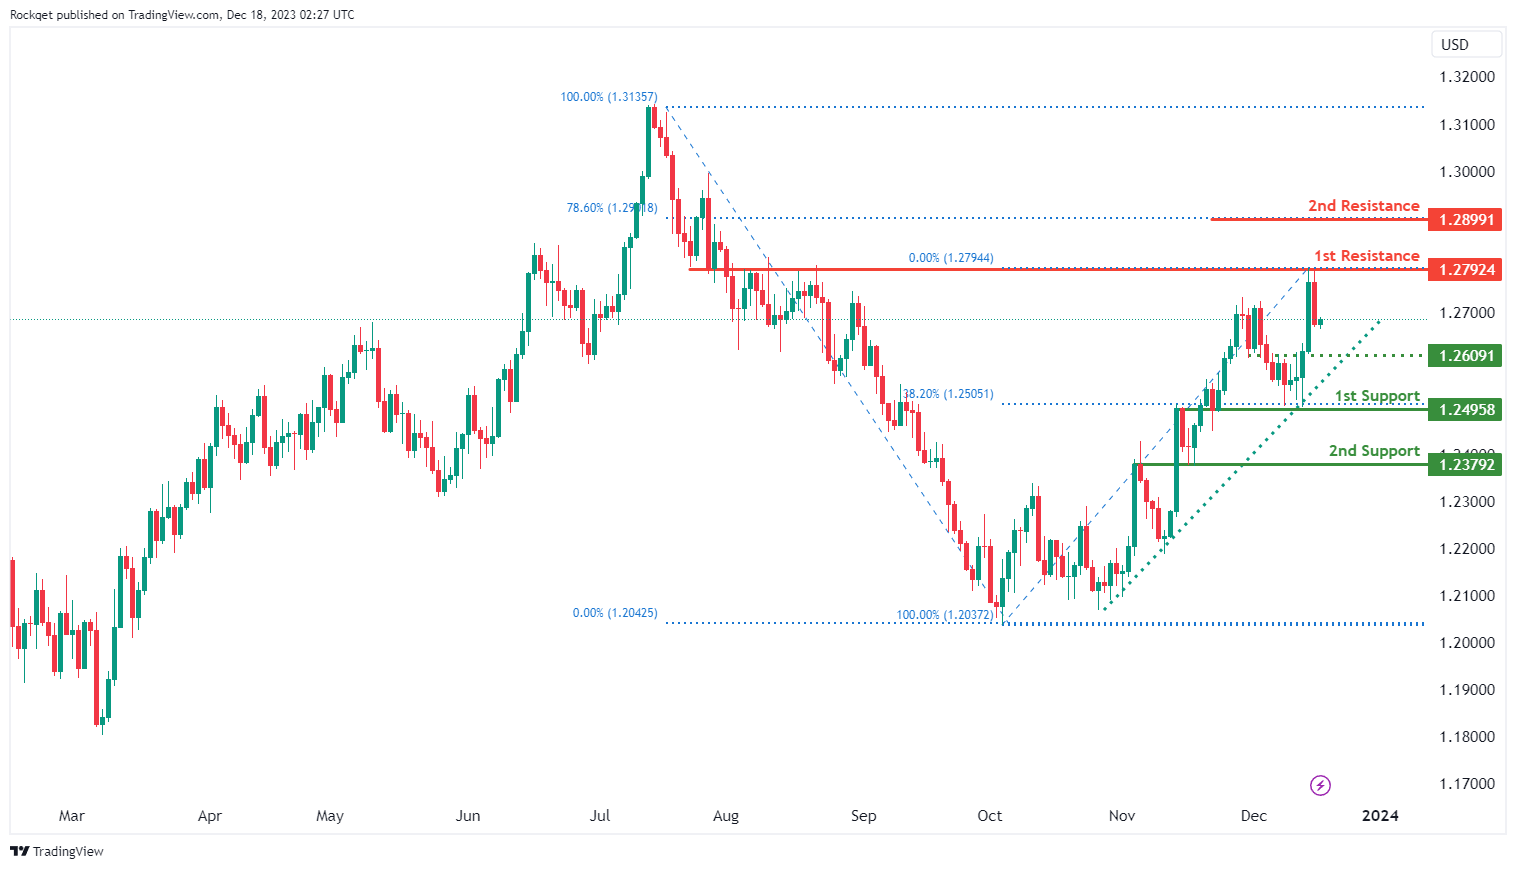
GBP/USD:
The GBP/USD chart currently exhibits an overall bullish momentum. In this context, there is a potential scenario for price to make a bullish continuation towards the 1st resistance.
The 1st resistance level at 1.2792 is identified as an overlap resistance. Higher up, the 2nd resistance level at 1.2899 is marked as a pullback resistance that aligns with the 78.60% Fibonacci retracement level, suggesting a potential barrier for further upside movement.
To the downside, the intermediate support level at 1.2609 is identified as an overlap support while the 1st support level at 1.2495 is also noted as an overlap support that aligns with the 38.20% Fibonacci retracement level. Further below, the 2nd support level at 1.2379 is marked as an overlap support, further reinforcing its importance as a potential key support level.
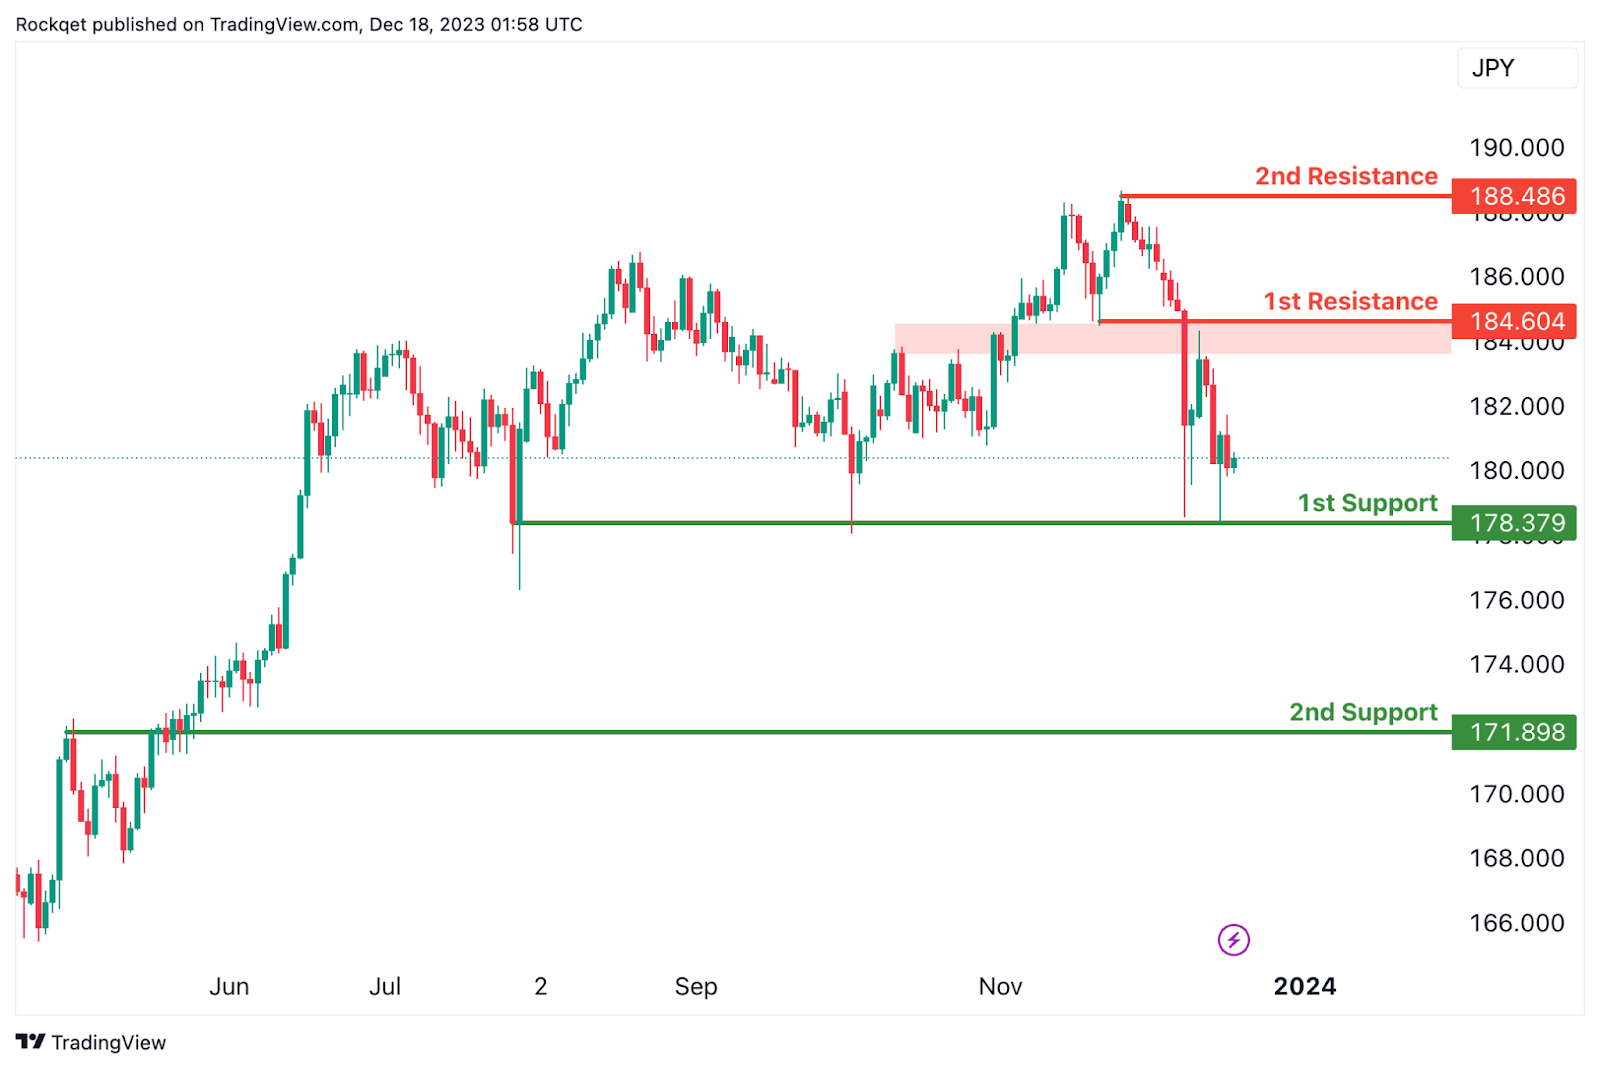
GBP/JPY:
The GBP/JPY chart currently has a bearish overall momentum, suggesting a potential for a bearish continuation towards the 1st support.
The 1st support at 178.38 is considered significant as it represents a swing low support. This level indicates a historical area where buying interest has been present, reinforcing its potential as a crucial support zone.
Similarly, the 2nd support at 171.90 is identified as an overlap support. This adds another layer of potential support for the currency pair, indicating a zone where buying interest may emerge, particularly considering its alignment with an overlap level.
On the resistance side, the intermediate resistance at 188.60 is associated with a pullback resistance. This level may act as a barrier where selling interest could intensify, potentially causing a temporary pause or reversal in the bearish trend.
Furthermore, the 1st resistance at 188.49 is characterized as a swing high resistance. This adds further significance to the resistance, suggesting a potential area where selling pressure may increase, especially considering its alignment with a previous swing high.
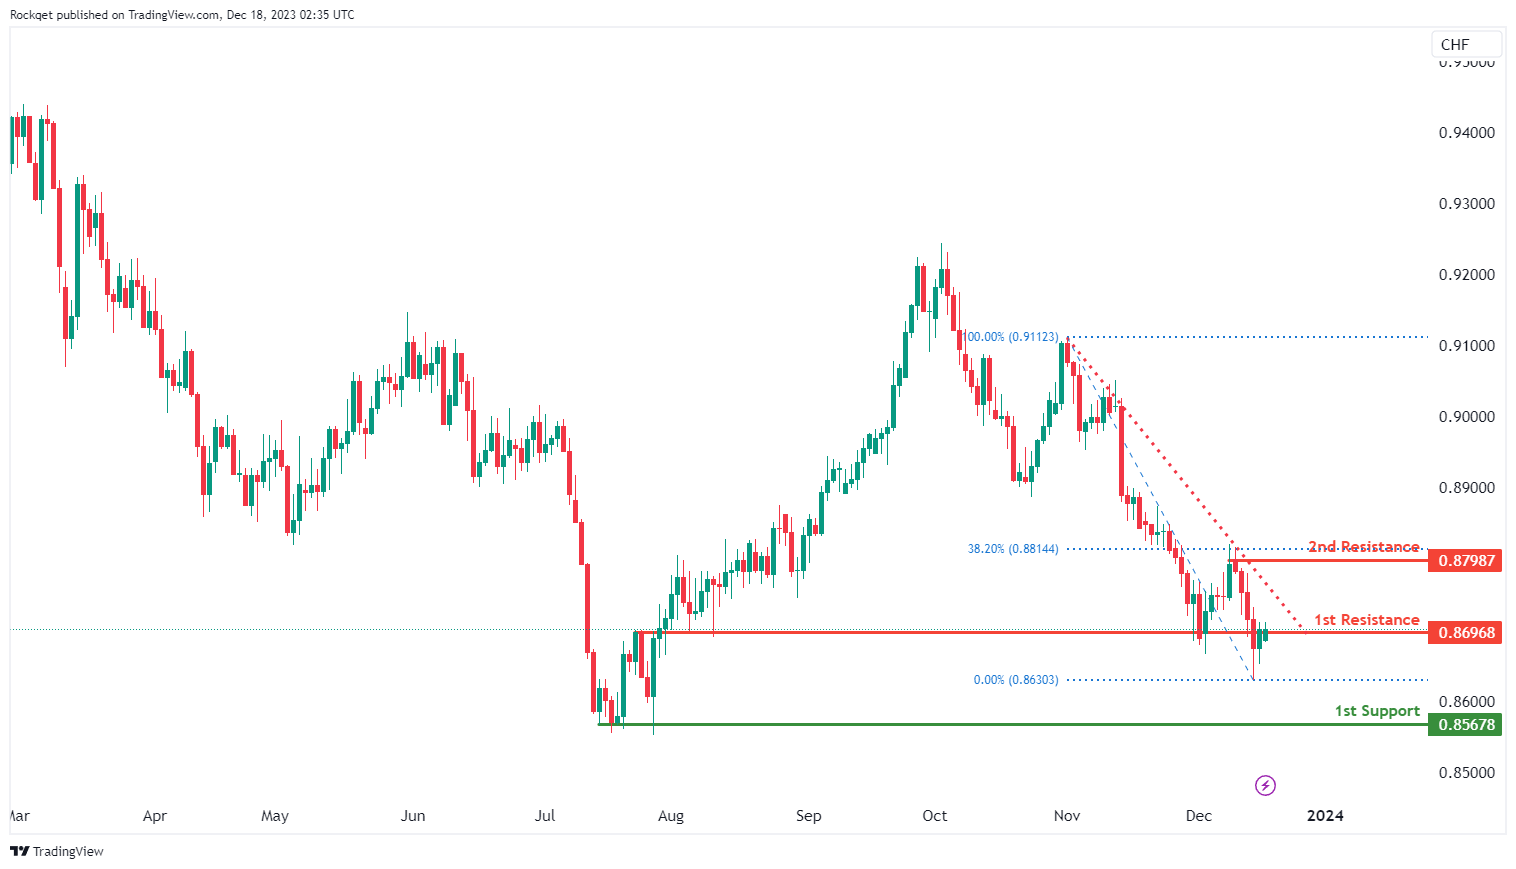
USD/CHF:
The USD/CHF chart currently exhibits an overall bearish momentum. In this context, there is a potential scenario for price to make a bearish reaction off the 1st resistance and drop towards the 1st support.
The 1st resistance level at 0.8696 is identified as an overlap resistance. Higher up, the 2nd resistance level at 0.8798 is marked as a pullback resistance that aligns close to the 38.20% Fibonacci retracement level, suggesting a potential barrier for further upside movement.
To the downside, the 1st support level at 0.8567 is identified as a swing-low support, further reinforcing its importance as a key support level.
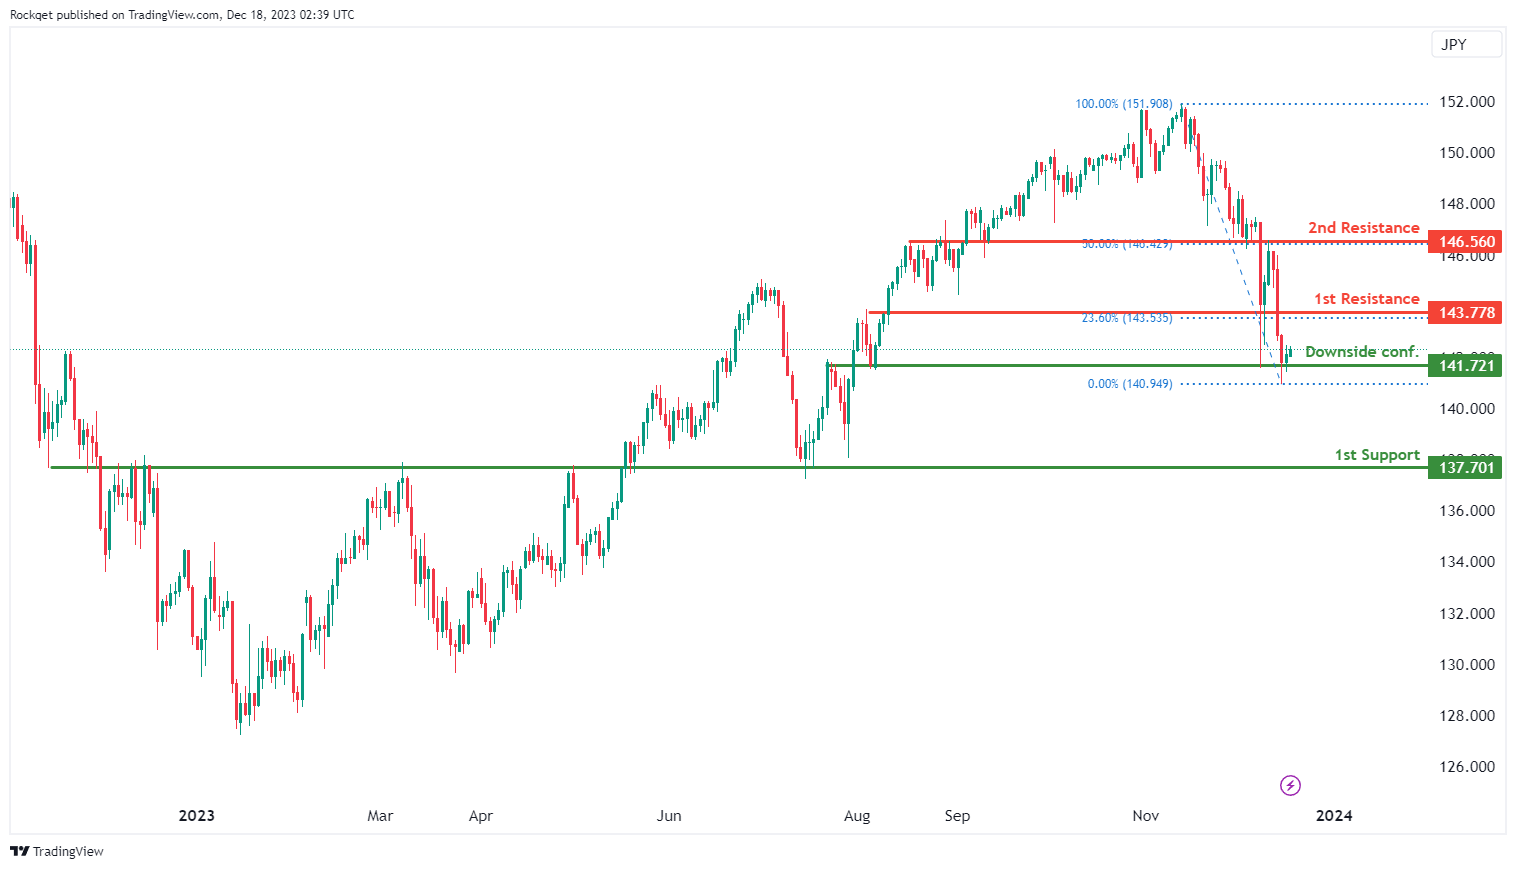
USD/JPY:
The USD/JPY chart currently exhibits an overall bearish momentum, indicating a potential for a drop towards the 1st support should price break below the downside confirmation level.
The downside confirmation level at 141.72 is identified as an overlap support. Further below, the 1st support level at 137.70 is also noted as an overlap support, further reinforcing its importance as a key support level.
To the upside, the 1st resistance level at 143.77 is identified as an overlap resistance that aligns with the 23.60% Fibonacci retracement level. Higher up, the 2nd resistance level at 146.56 is also marked as an overlap resistance that aligns with the 50.00% Fibonacci retracement level, suggesting a potential barrier for further upside movement.
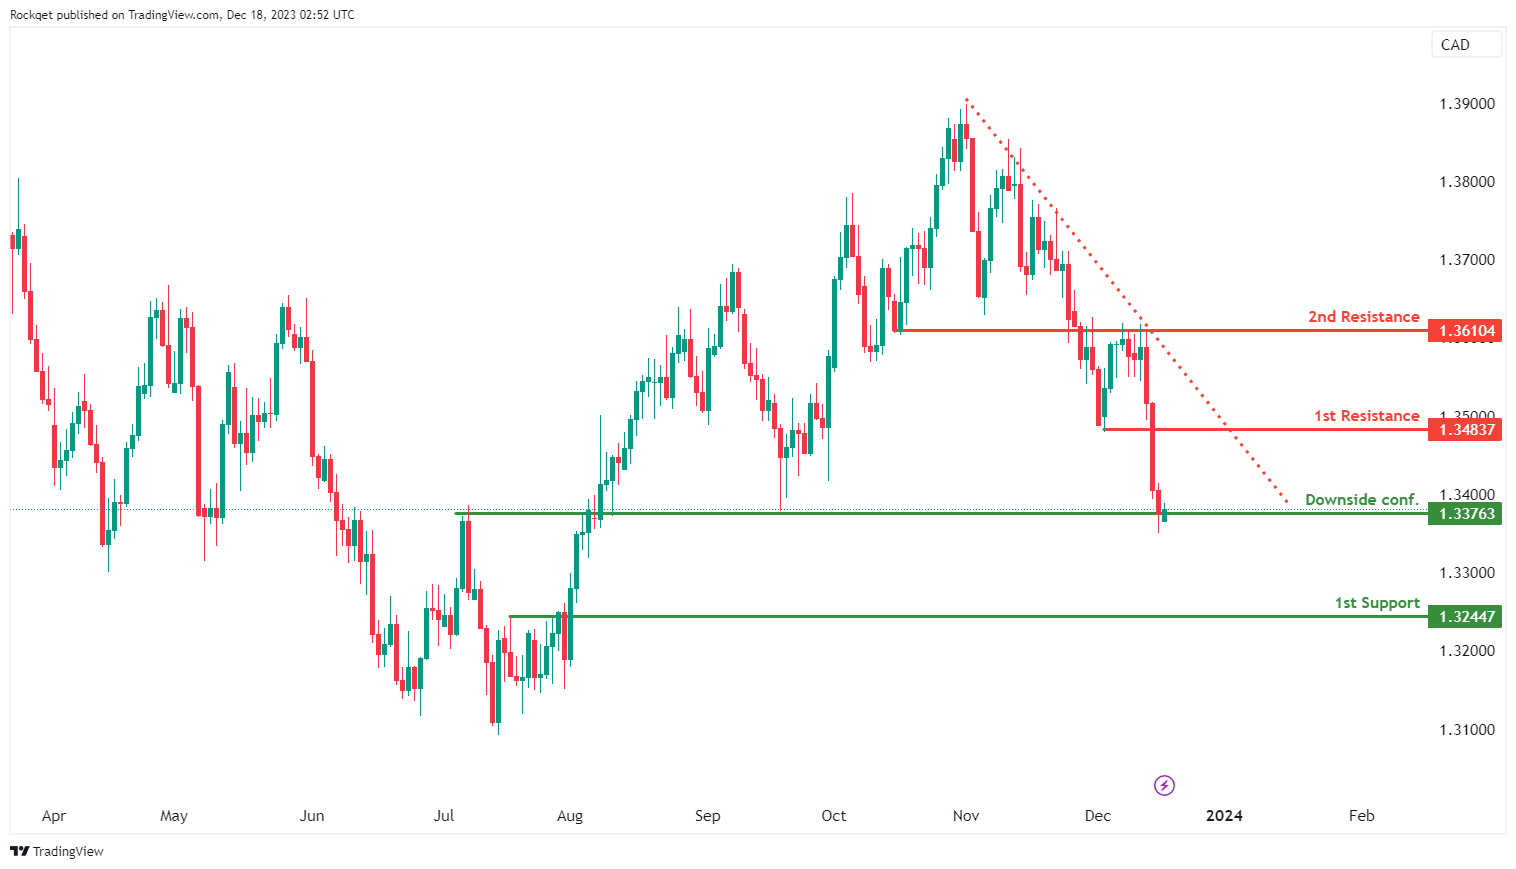
USD/CAD:
The USD/CAD chart currently exhibits an overall bearish momentum, indicating a potential for a drop towards the 1st support should price break below the downside confirmation level.
The downside confirmation level at 1.3376 is identified as an overlap support. Further below, the 1st support level at 1.3244 is noted as a pullback support, further reinforcing its importance as a key support level.
To the upside, the 1st resistance level at 1.3483 is identified as a pullback resistance while the 2nd resistance level at 1.3610 is noted as an overlap resistance, suggesting a potential barrier for further upside movement.
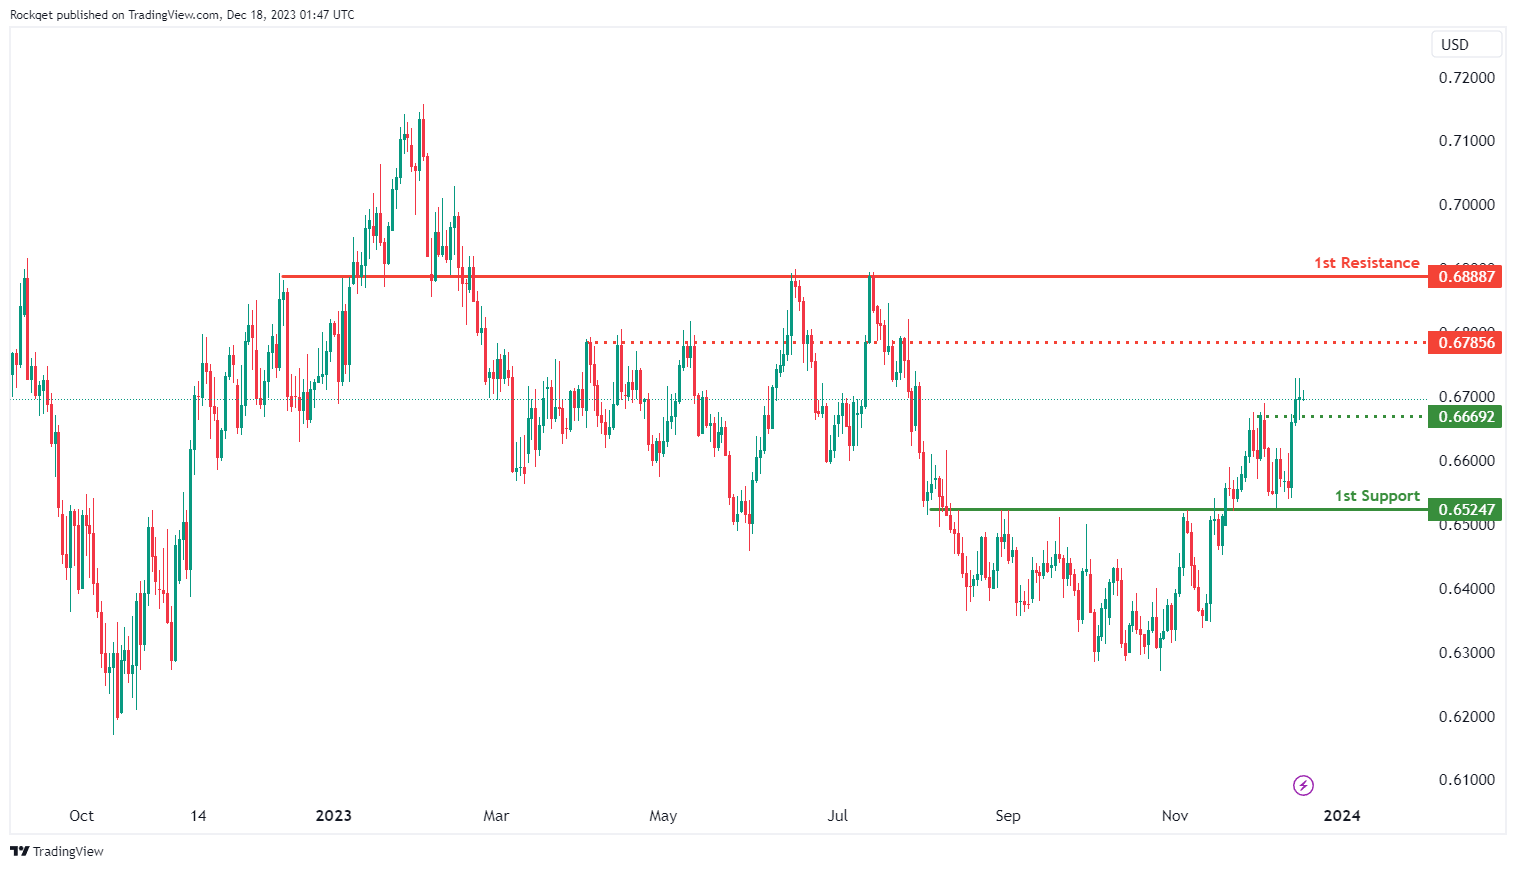
AUD/USD:
The AUD/USD chart currently exhibits an overall bullish momentum. In this context, there is a potential scenario for price to make a bullish continuation towards the intermediate resistance.
The intermediate resistance level at 0.6785 is identified as an overlap resistance. Higher up, the 1st resistance level at 0.6888 is also noted as an overlap resistance, indicating its potential significance as a barrier for further upward movement.
To the downside, the intermediate support level at 0.6669 is identified as an overlap support. Further below, the 1st support level at 0.6524 is also marked as an overlap support, further reinforcing its importance as a key support level.
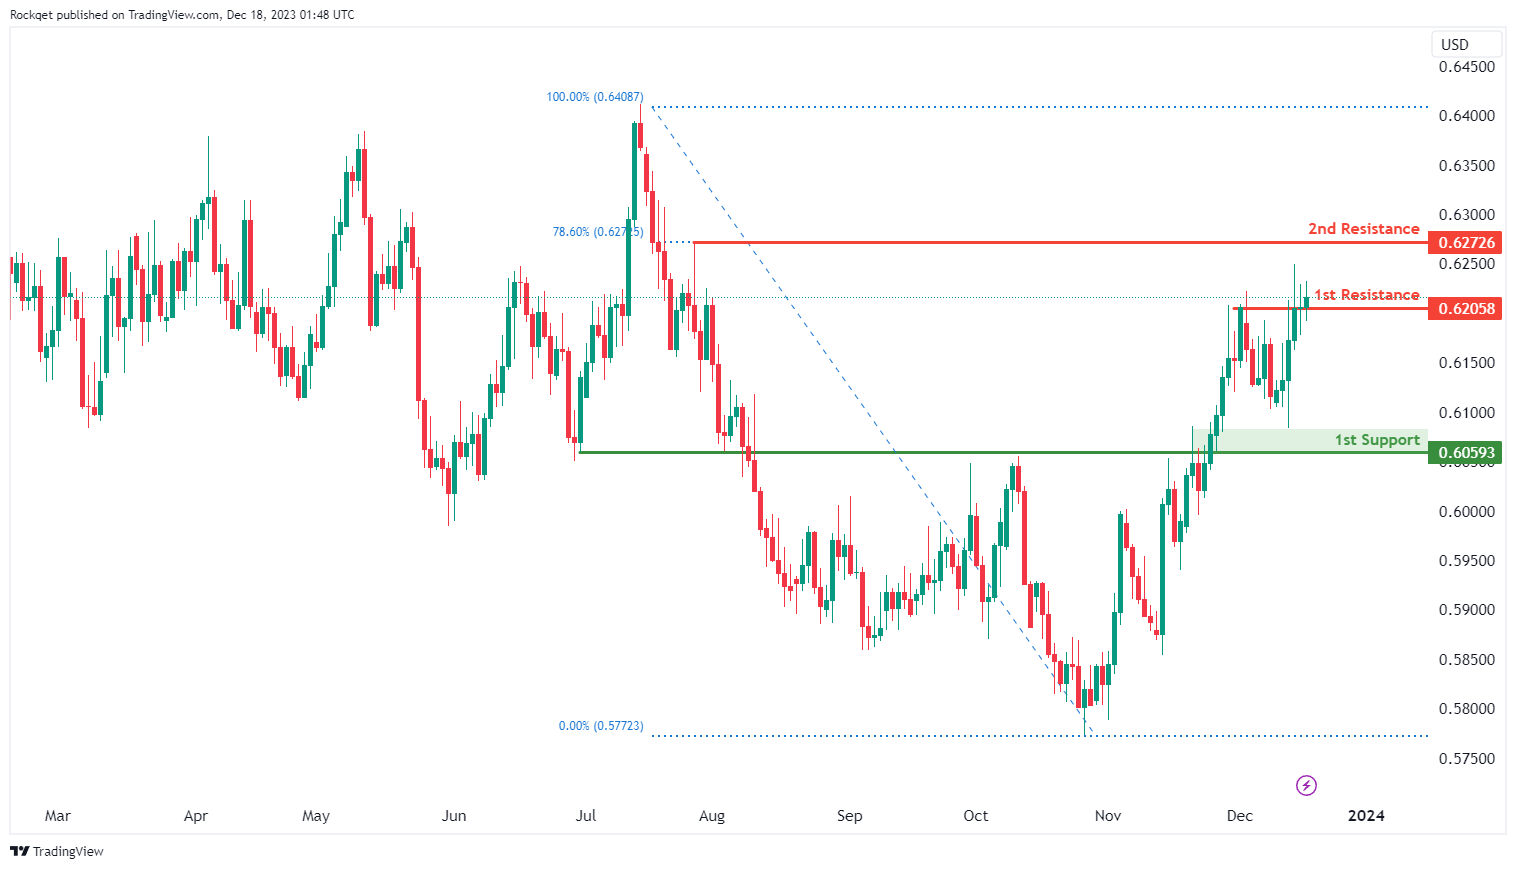
NZD/USD
The NZD/USD chart currently exhibits an overall bullish momentum. In this context, there is a potential scenario for price to break above the 1st resistance and make a bullish continuation towards the 2nd resistance.
The 1st resistance level at 0.6205 is identified as a pullback resistance. Higher up, the 2nd resistance level at 0.6272 is also marked as a pullback resistance that aligns with the 78.60% Fibonacci retracement level, indicating its potential significance as a barrier for further upward movement.
To the downside, the 1st support level at 0.6059 is identified as an overlap support, further reinforcing its importance as a key support level.
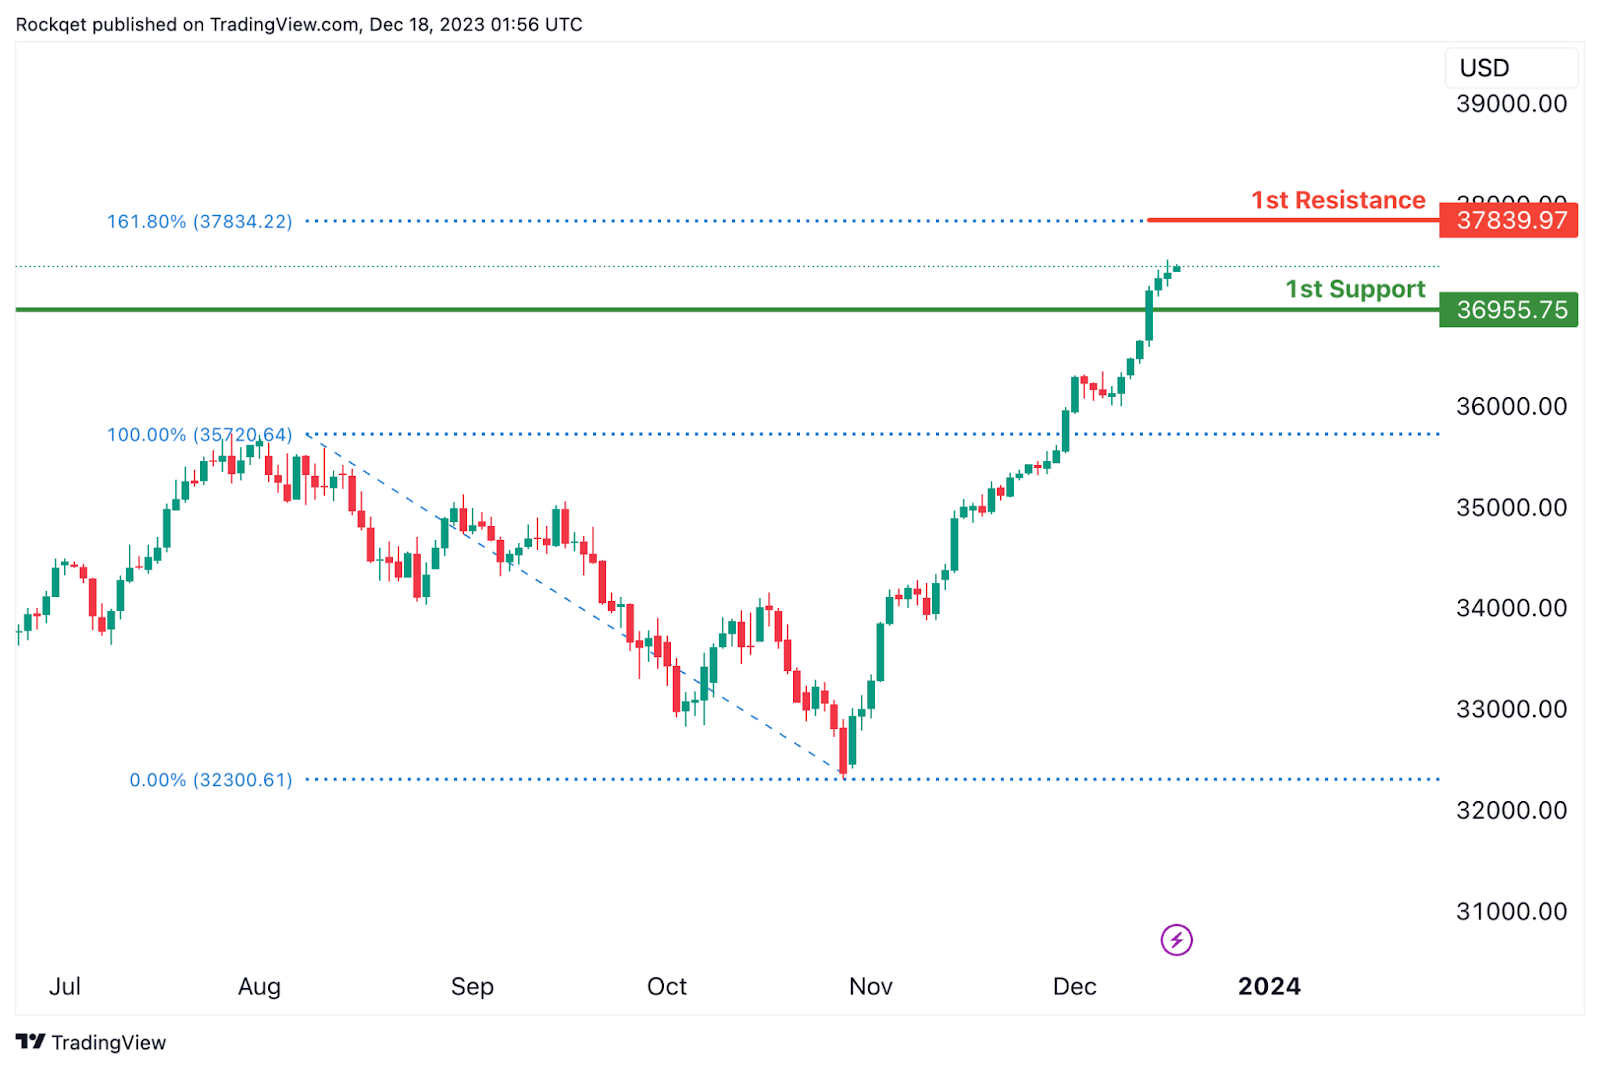
DJ30:
The DJ30 chart currently displays a bullish overall momentum, suggesting a potential for a bullish continuation towards the 1st resistance.
The 1st support at 36955.75 is considered significant as it represents a pullback support. This level indicates a potential area where buying interest may emerge after a pullback, providing support for the index.
On the resistance side, the 1st resistance at 37839.97 is associated with the 161.80% Fibonacci Extension. This Fibonacci extension level adds further significance to the resistance, suggesting a potential area where selling pressure may increase, especially considering the alignment with this extension level.
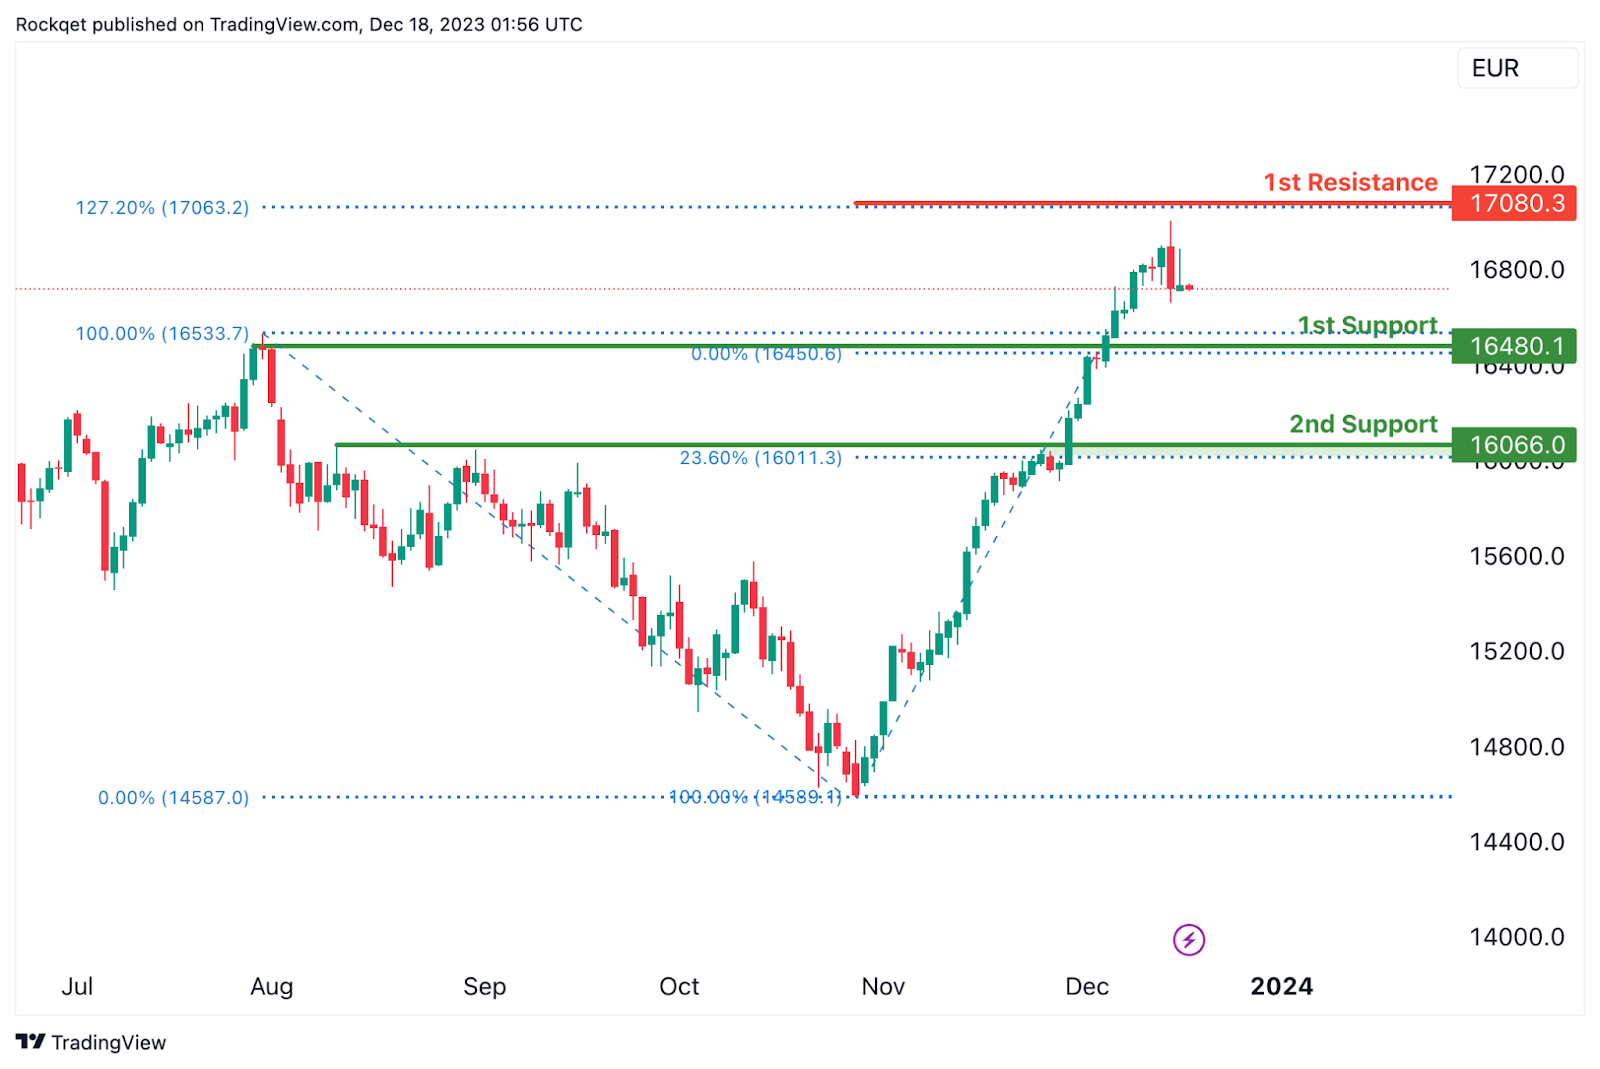
GER40:
The GER40 chart currently has a bearish overall momentum, and there is a potential scenario for a bearish continuation towards the 1st support.
The 1st support at 16480.10 is considered significant as it represents a pullback support and coincides with the 100% Fibonacci Retracement level. This level indicates a potential area where buying interest may emerge after a pullback, providing support for the index.
Similarly, the 2nd support at 16066.00 is identified as another pullback support and aligns with the 23.60% Fibonacci Retracement level. This adds another layer of potential support, indicating a zone where buying interest may be present, further reinforcing the potential for a bearish continuation.
On the resistance side, the 1st resistance at 17080.30 is associated with the 127.20% Fibonacci Extension. This Fibonacci extension level adds further significance to the resistance, suggesting a potential area where selling pressure may increase, especially considering the alignment with this extension level.
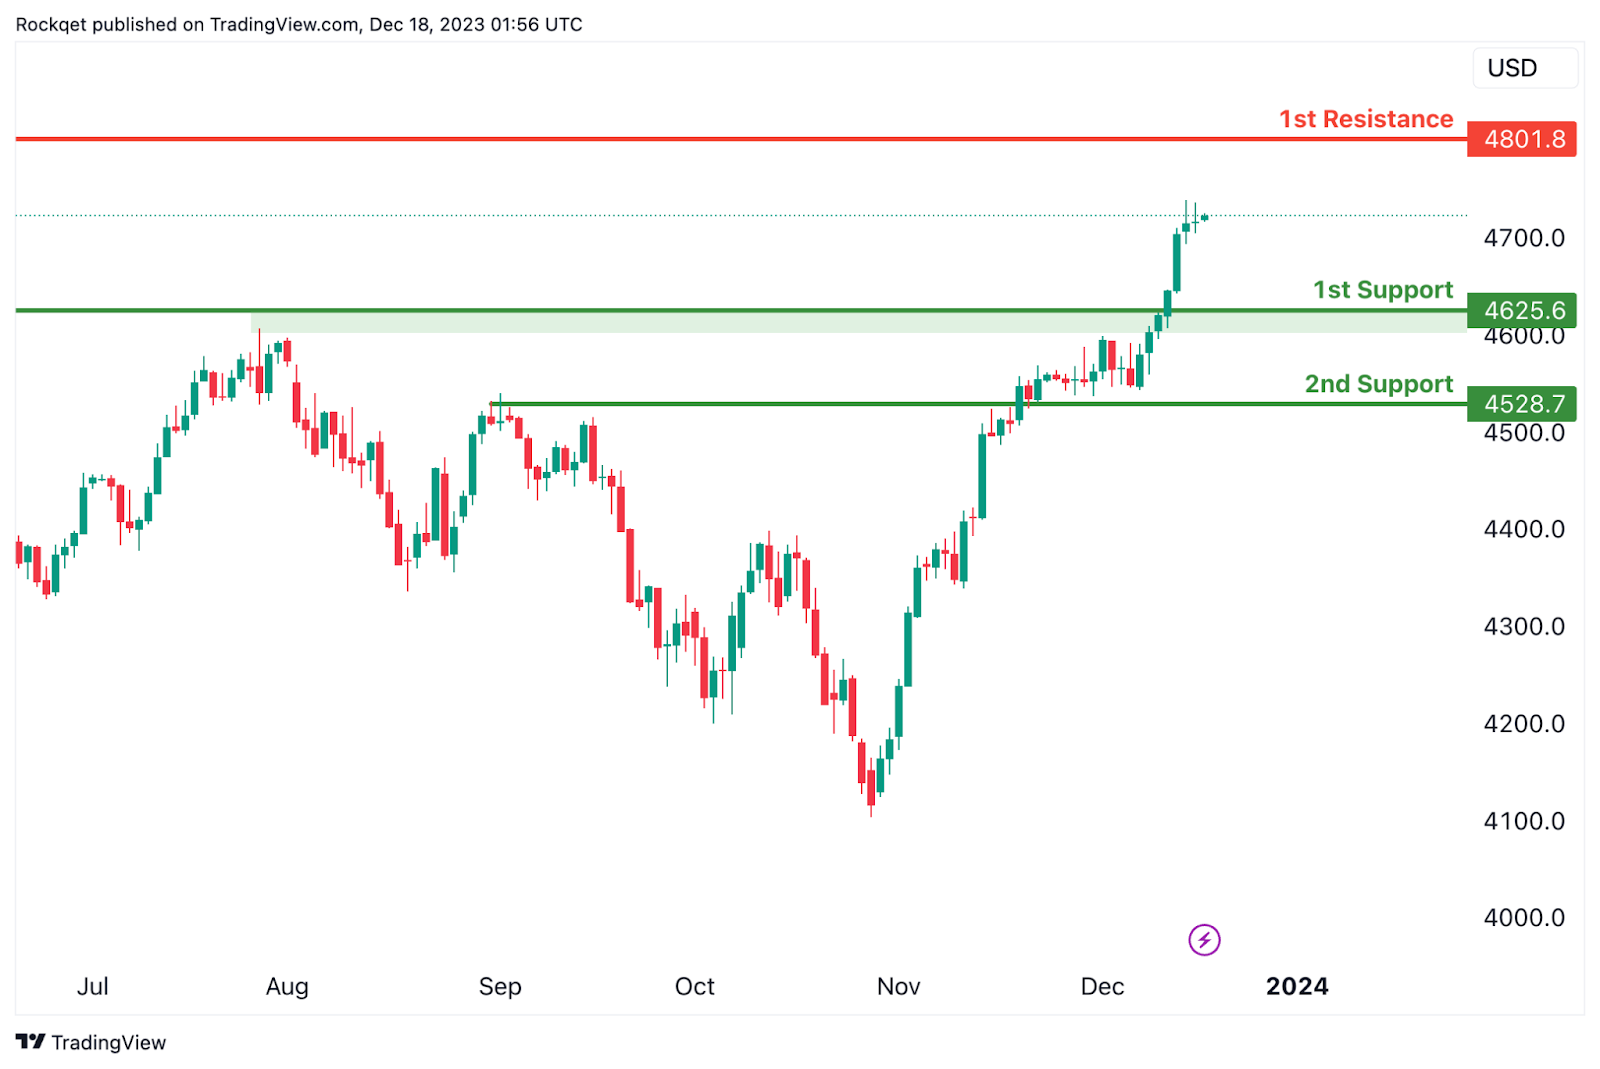
`US500:
The US500 chart currently has a bullish overall momentum, and there is a potential scenario for a short-term drop to the 1st support before bouncing from there and rising to the 1st resistance.
The 1st support at 4625.6 is considered significant as it represents a pullback support. This level indicates a potential area where buying interest may emerge after a pullback, providing support for the index.
Similarly, the 2nd support at 4528.7 is identified as an overlap support. This adds another layer of potential support, indicating a zone where buying interest may be present, further reinforcing the potential for a bounce.
On the resistance side, the 1st resistance at 4801.8 is associated with a swing high resistance. This level may act as a barrier where selling interest could intensify, potentially causing a temporary pause or reversal in the bullish trend.
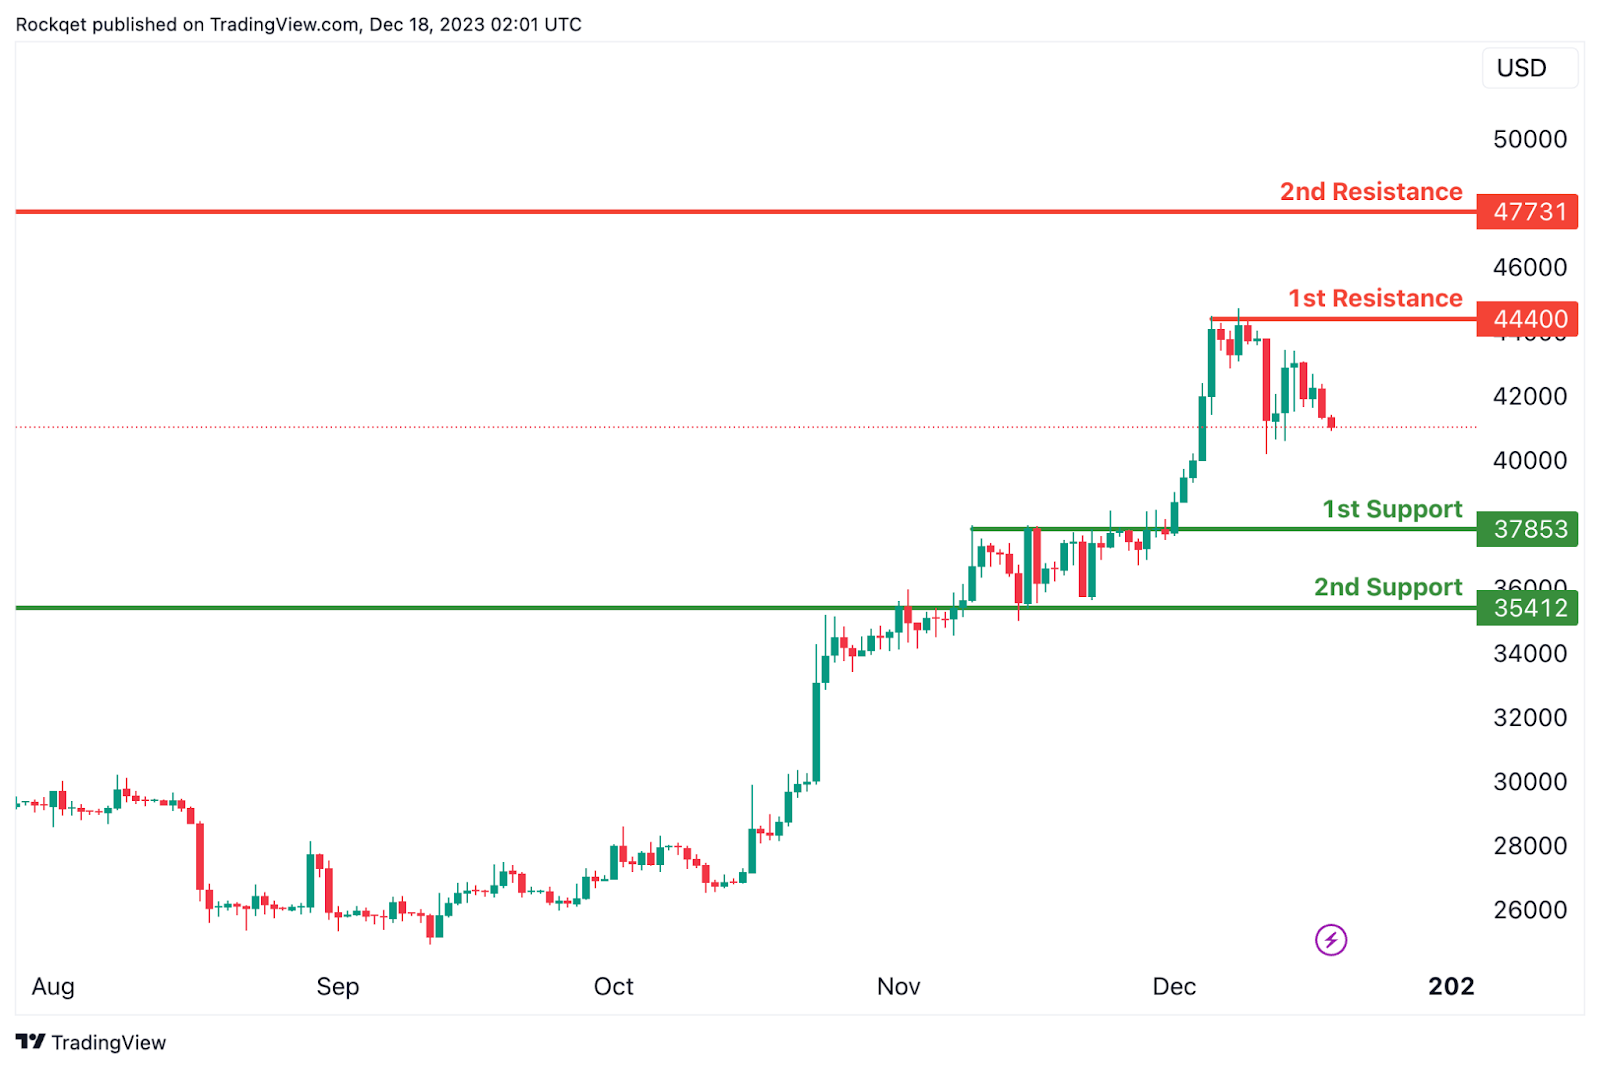
BTC/USD:
The BTC/USD chart currently exhibits a weak bearish momentum with low confidence, suggesting a potential for a bearish continuation towards the 1st support.
The 1st support at 37853 is considered significant as it represents an overlap support. This level indicates a historical area where buying interest has been present, reinforcing its potential as a crucial support zone.
Similarly, the 2nd support at 35412 is identified as another overlap support. This adds another layer of potential support for the cryptocurrency, indicating a zone where buying interest may emerge, particularly considering its alignment with an overlap level.
On the resistance side, the 1st resistance at 44400 is associated with a swing high resistance. This level may act as a barrier where selling interest could intensify, potentially causing a temporary pause or reversal in the bearish trend.
Furthermore, the 2nd resistance at 47731 is characterized as another swing high resistance. This adds further significance to the resistance, suggesting a potential area where selling pressure may increase, especially considering its alignment with a previous swing high.
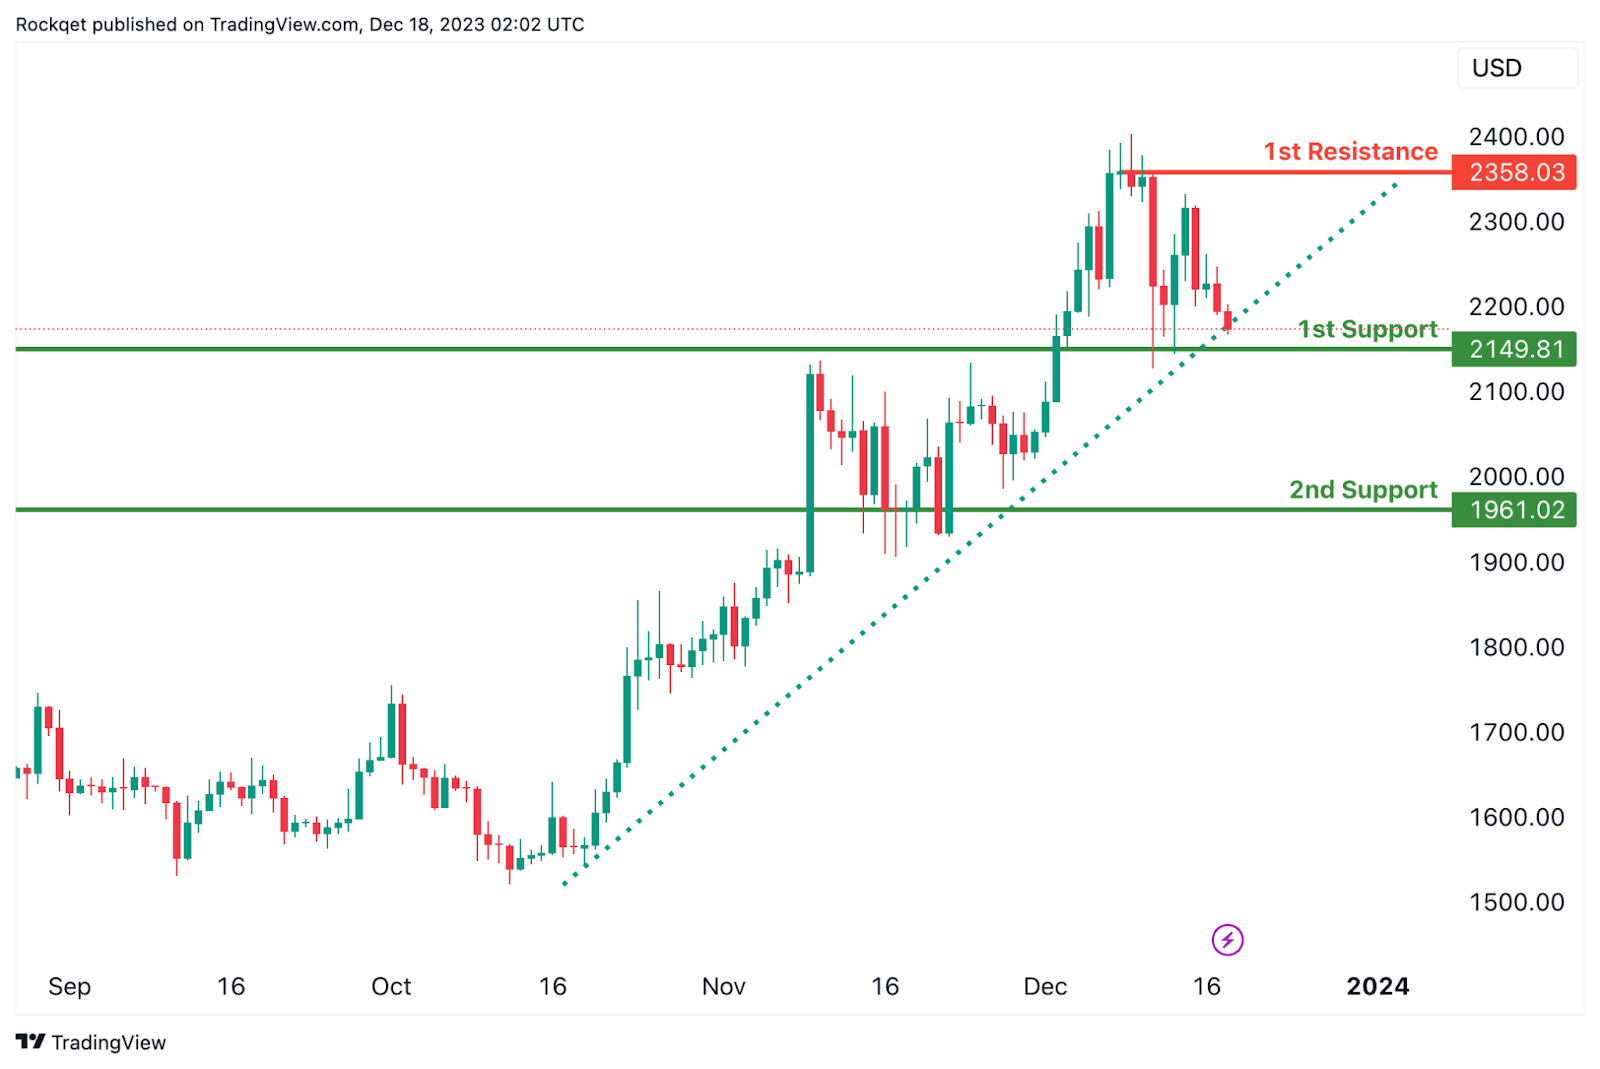
ETH/USD:
The ETH/USD chart currently has a bullish overall momentum, supported by the fact that the price is above a major ascending trend line, suggesting further bullish momentum.
There is a potential scenario for a short-term drop to the 1st support before bouncing from there and rising to the 1st resistance.
The 1st support at 2149.81 is considered significant as it represents an overlap support. This level indicates a historical area where buying interest has been present, reinforcing its potential as a crucial support zone.
Similarly, the 2nd support at 1961.02 is identified as a pullback support. This adds another layer of potential support for the cryptocurrency, indicating a zone where buying interest may emerge after a pullback.
On the resistance side, the 1st resistance at 2358.03 is associated with a swing high resistance. This level may act as a barrier where selling interest could intensify, potentially causing a temporary pause or reversal in the bullish trend.
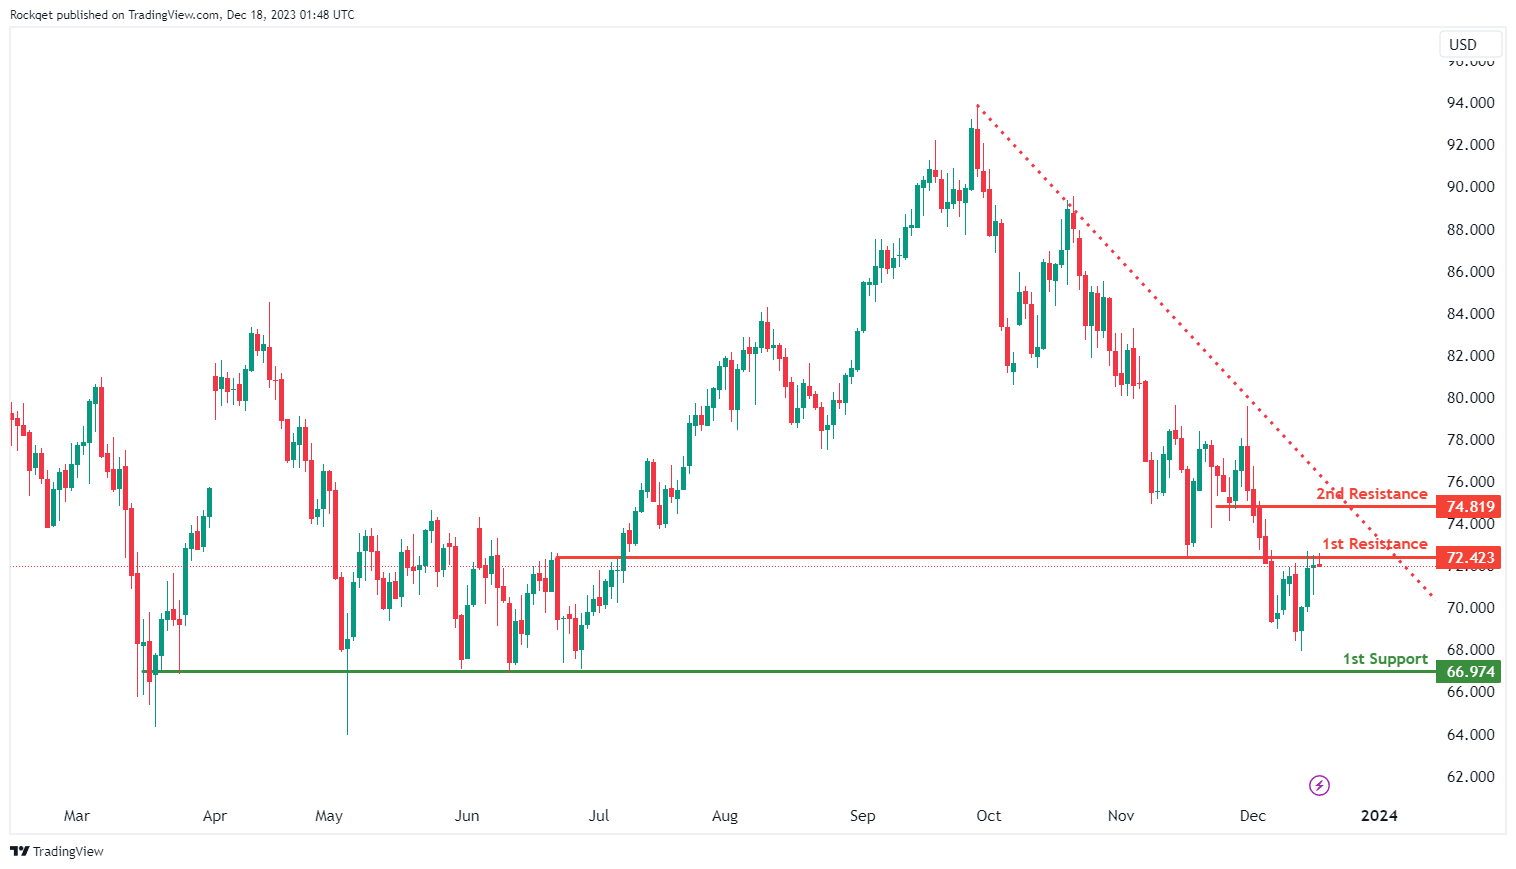
WTI/USD:
The WTI chart currently exhibits an overall bearish momentum, suggesting a prevailing downward trend. In this context, there is a potential scenario for price to make a bearish reaction off the 1st resistance before resuming the downtrend and falling towards the 1st support.
The 1st resistance level at 72.42 is identified as an overlap resistance. Higher up, the 2nd resistance level at 74.81 is marked as a pullback resistance, further indicating its potential significance as a barrier for further upward movement.
To the downside, the 1st support level at 66.97 is identified as a multi-swing-low support, reinforcing its importance as a key support level.
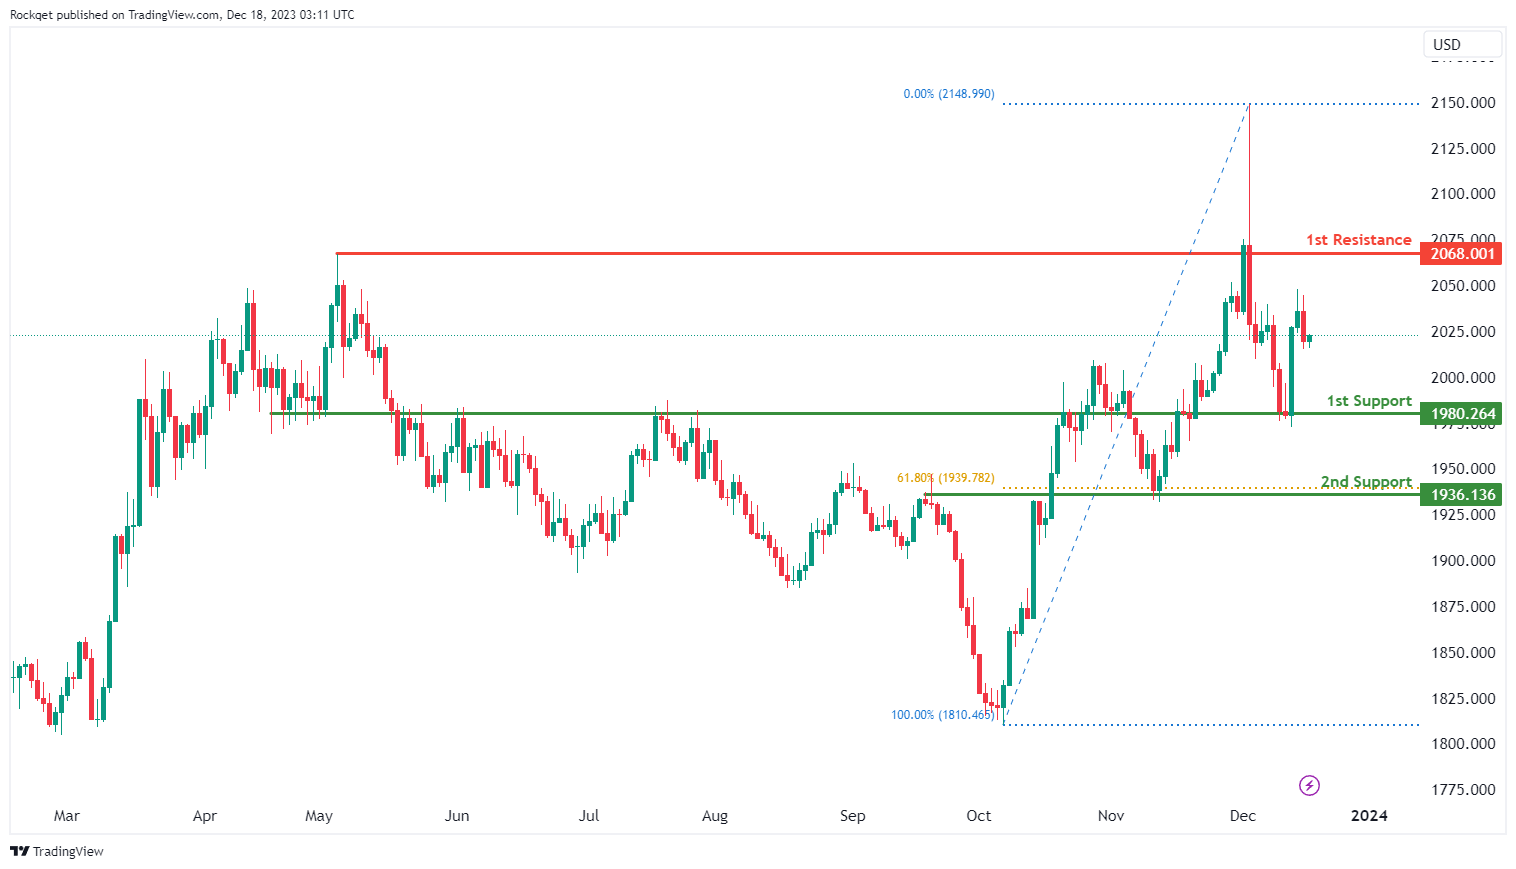
XAU/USD (GOLD):
The XAU/USD chart currently demonstrates a neutral momentum, indicating a potential for price to fluctuate between the 1st support and the 1st resistance.
The 1st support level at 1,980.26 is identified as an overlap support. Further below, the 2nd support level at 1,936.13 is also noted as an overlap support that aligns with the 61.80% Fibonacci retracement level, reinforcing its importance as a key support level.
On the resistance side, the 1st resistance level at 2,068.00 is identified as a multi-swing-high resistance, further indicating its potential significance as a barrier for further upward movement.
The accuracy, completeness and timeliness of the information contained on this site cannot be guaranteed. IC Markets does not warranty, guarantee or make any representations, or assume any liability regarding financial results based on the use of the information in the site.
News, views, opinions, recommendations and other information obtained from sources outside of www.icmarkets.com, used in this site are believed to be reliable, but we cannot guarantee their accuracy or completeness. All such information is subject to change at any time without notice. IC Markets assumes no responsibility for the content of any linked site.
The fact that such links may exist does not indicate approval or endorsement of any material contained on any linked site. IC Markets is not liable for any harm caused by the transmission, through accessing the services or information on this site, of a computer virus, or other computer code or programming device that might be used to access, delete, damage, disable, disrupt or otherwise impede in any manner, the operation of the site or of any user’s software, hardware, data or property.


