
EUR/USD:
Weekly gain/loss: -1.10%
Weekly close: 1.1206
Weekly perspective:
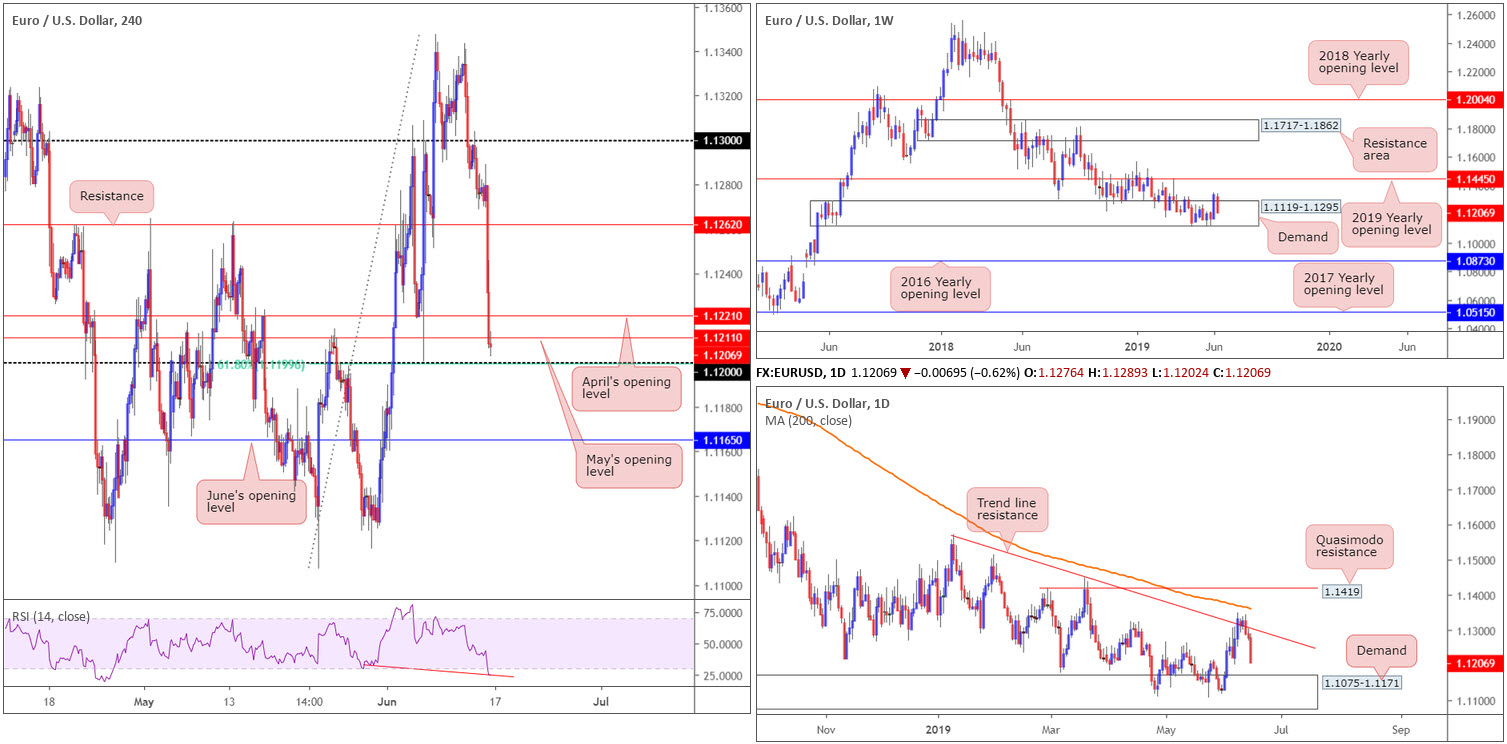
In spite of a notable offensive phase out of a long-standing demand area at 1.1119-1.1295 two weeks back, the euro declined more than 120 points against the buck last week. This – coupled with the overall trend still facing a southerly bearing since topping in early 2018 – places a bold question mark on the demand’s life expectancy.
Targets to be aware of this week on the longer-term chart can be seen at the 2019 yearly opening level at 1.1445 and the 2016 yearly opening level coming in at 1.0873.
Daily perspective:
Although price action peaked above a trend line resistance (extended from the high 1.1569) at the beginning of the week, with most traders expecting a run to the 200-day SMA to materialise, mid-week action observed a robust bearish engulfing candle form that generated strong follow-through selling into the close.
With the aforementioned trend line resistance intact, the next downside target on this timeframe to be aware of this week falls in around demand at 1.1075-1.1171 (glued to the underside of the weekly demand highlighted above).
H4 perspective:
The US dollar index, or DXY, ascended to its highest level in almost two weeks Friday following promising retail sales data in May. US retail sales came in at +0.5%, short of the 0.6% expected. The other measures surprised to the upside, however, painting a solid picture of consumer health.
The release sent the EUR/USD tumbling beneath support at 1.1262 (now acting resistance), and also April and May’s opening levels at 1.1221 and 1.1211, respectively, consequently exposing the 1.12 handle and intersecting 61.8% Fibonacci support at 1.1199.
Beyond 1.12, June’s opening level is present at 1.1165, positioned within the upper boundary of the daily demand underlined above at 1.1075-1.1171. Indicator-based traders may also find use in the RSI, currently pencilling in hidden divergence within oversold territory (red line).
Areas of consideration:
The 1.12 handle on the H4 timeframe, in spite of its connection with a 61.8% Fib support at 1.1199, emphasises a fragile tone, according to the overall technical picture, and therefore is unlikely to produce much this week. The rationale behind this notion simply falls on the higher-timeframe structure: weekly demand failing to excite buyers and daily price exhibiting scope to approach 1.1171 (the top edge of demand), which, as we already know, aligns closely with June’s opening level at 1.1165.
On account of the above, the research team are watching for the following scenarios:
- A H4 close beneath 1.12, targeting 1.1165 as the initial point of concern. Short-term traders have the option of either selling the breakout candle and positioning stop-loss orders above the upper shadow, or waiting and seeing if a retest at 1.12 as resistance develops and entering on the back of the rejection candle’s structure. The latter is considered the more conservative route.
- Long opportunity from 1.1165, considering its connection with daily demand. Bear in mind, however, this entails buying into the overall trend, so trade cautiously here.
Today’s data points: Limited.
GBP/USD:
Weekly gain/loss: -1.13%
Weekly close: 1.2588
Weekly perspective:
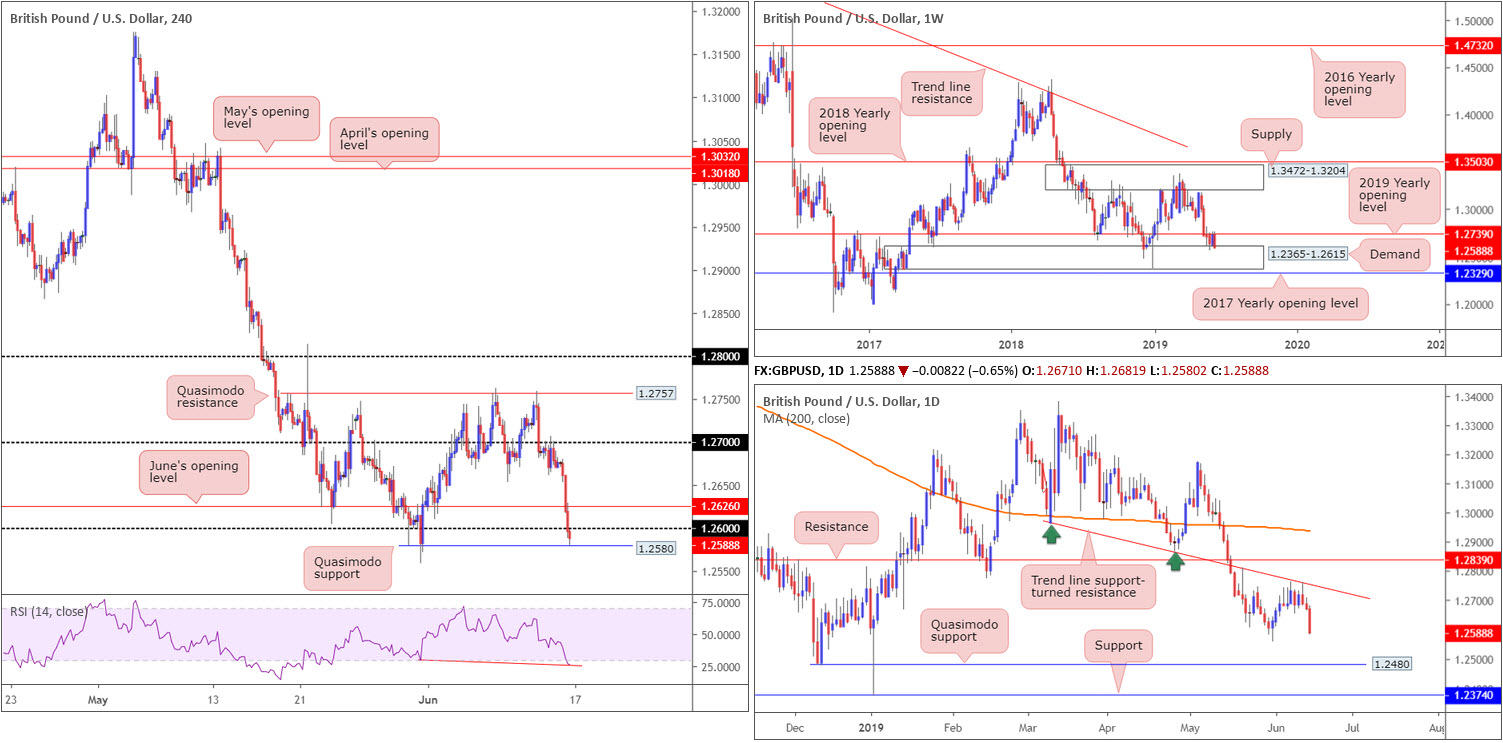
Shedding more than 140 points on the week by way of a near-full-bodied bearish candle, price action reconnected with long-standing demand at 1.2365-1.2615 after failing to sustain gains above the 2019 yearly opening level at 1.2739.
Failure to overthrow 1.2739 brings into question the validity of the current demand. For that reason, it may be an idea to pencil in the 2017 yearly opening level at 1.2329, in the event we press for lower ground this week.
Daily perspective:
In conjunction with the 2019 yearly opening level on the weekly timeframe, additional resistance entered the fold last week in the shape of a daily trend line support-turned resistance extended from the low 1.2960.
Aside from the 1.2558 May 31 low, the next point of calling in terms of support can be found at a Quasimodo formation drawn from 1.2480, closely shadowed by support at 1.2374.
H4 perspective:
Demand for the greenback, largely on upbeat retail sales data in May, alongside the pound continuing to feel the impact of Boris Johnson leading the race to become Prime Minister, saw the GBP/USD lose 0.65% Friday.
For folks who have been reading recent reports on cable you may recall the research team wrote about the following technical setup:
The H4 Quasimodo resistance at 1.2757 is a somewhat appealing sell zone to have eyes on, due to its convergence with the daily trend line support-turned resistance, and also because weekly selling interest may develop a little lower on the curve around 1.2739.
Well done to any of our readers who managed to jump aboard the move from 1.2757 earlier this week. There was also another chance to join the selling, for those who missed 1.2757, at the retest of 1.27. As is evident from the chart, the pair concluded the week nudging beneath 1.26 and testing a Quasimodo support at 1.2580. Beneath 1.2580, the research team notes limited support until 1.25, followed closely by daily Quasimodo support mentioned above at 1.2480.
Areas of consideration:
Seeing the top edge of weekly demand enter the fray at 1.2615, and possible support emerging from the 1.2558 May 31 low highlighted on the daily timeframe as well as the H4 Quasimodo support at 1.2580, a recovery may take shape today, potentially reclaiming 1.26 and targeting June’s opening level at 1.2626. It might also be worth noting the RSI indicator on the H4 chart is currently chalking up a hidden divergence reading within oversold waters (red line).
Given the strength of Friday’s move and potentially fragile weekly demand, as well as the UK’s current political situation, however, this is a difficult market to buy with any confidence.
Should the market punch beneath 1.2580 on a H4 closing basis, best if we also take out the low at 1.2558 as well, nevertheless, selling this market is certainly something worth considering, either on the breakout candle or conservatively shorting any retest motion.
Today’s data points: Limited.
AUD/USD:
Weekly gain/loss: -1.84%
Weekly close: 0.6869
Weekly perspective:
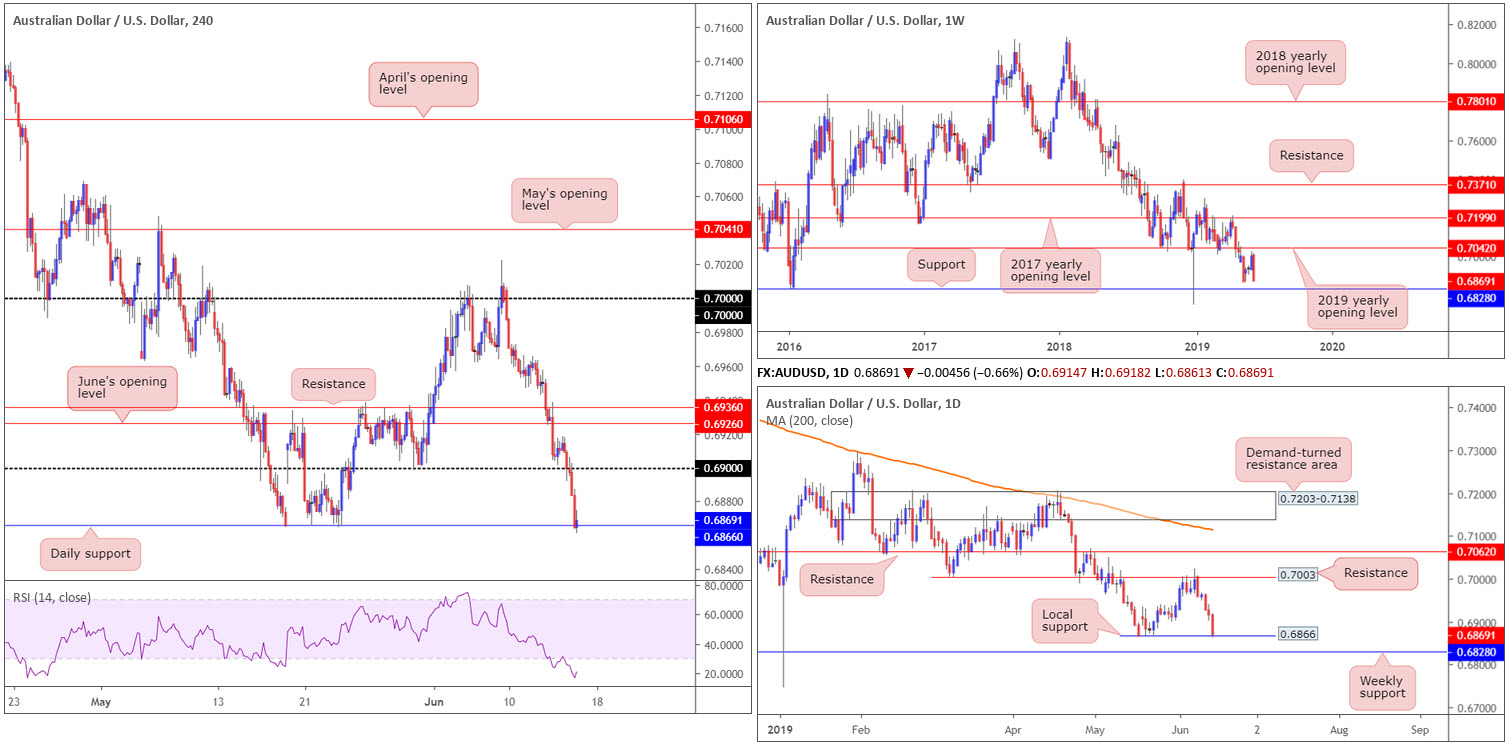
In the mould of a near-full-bodied bearish formation, the Australian dollar plummeted 130 points vs. its US counterpart last week. This, as is shown on the weekly chart, places the unit within striking distance of notable support pencilled in at 0.6828, a level offering history as far back as mid-2003.
Daily perspective:
Resistance at 0.7003 held beautifully, setting a clear bearish tone at the beginning of the week, which landed price action at local support carved from 0.6866. As a result, before the market crosses swords with weekly support at 0.6828, daily flow will have to dethrone 0.6866.
H4 perspective:
Broad-based USD bidding, influenced by optimistic retail sales for May, along with disappointing data out of China, collectively weighed on the commodity-linked currency Friday, down 0.66% on the session against the US dollar.
US retail sales news drove price action sub 0.69, consequently encouraging a run towards daily support highlighted above at 0.6866, which, as you can see, held into the close. Beyond 0.6866, we see limited support until crossing paths with the 0.68 handle.
Areas of consideration:
According to our technical studies, focus is on the weekly support level at 0.6828 this week for a possible countertrend trade. The daily support at 0.6866 is likely of interest to some traders on the lower timeframes for a bounce higher, though higher-timeframe flows usually take precedence over its lower counterparts.
Should 0.6828 enter the fight and produce a notable H4 bullish candlestick configuration, the odds of price developing at least a healthy bounce is high, targeting the underside of 0.6866 as the initial upside objective (entry and risk elements can be determined according to the bullish candlestick’s structure).
Today’s data points: Limited.
USD/JPY:
Weekly gain/loss: +0.37%
Weekly close: 108.56
Weekly perspective:
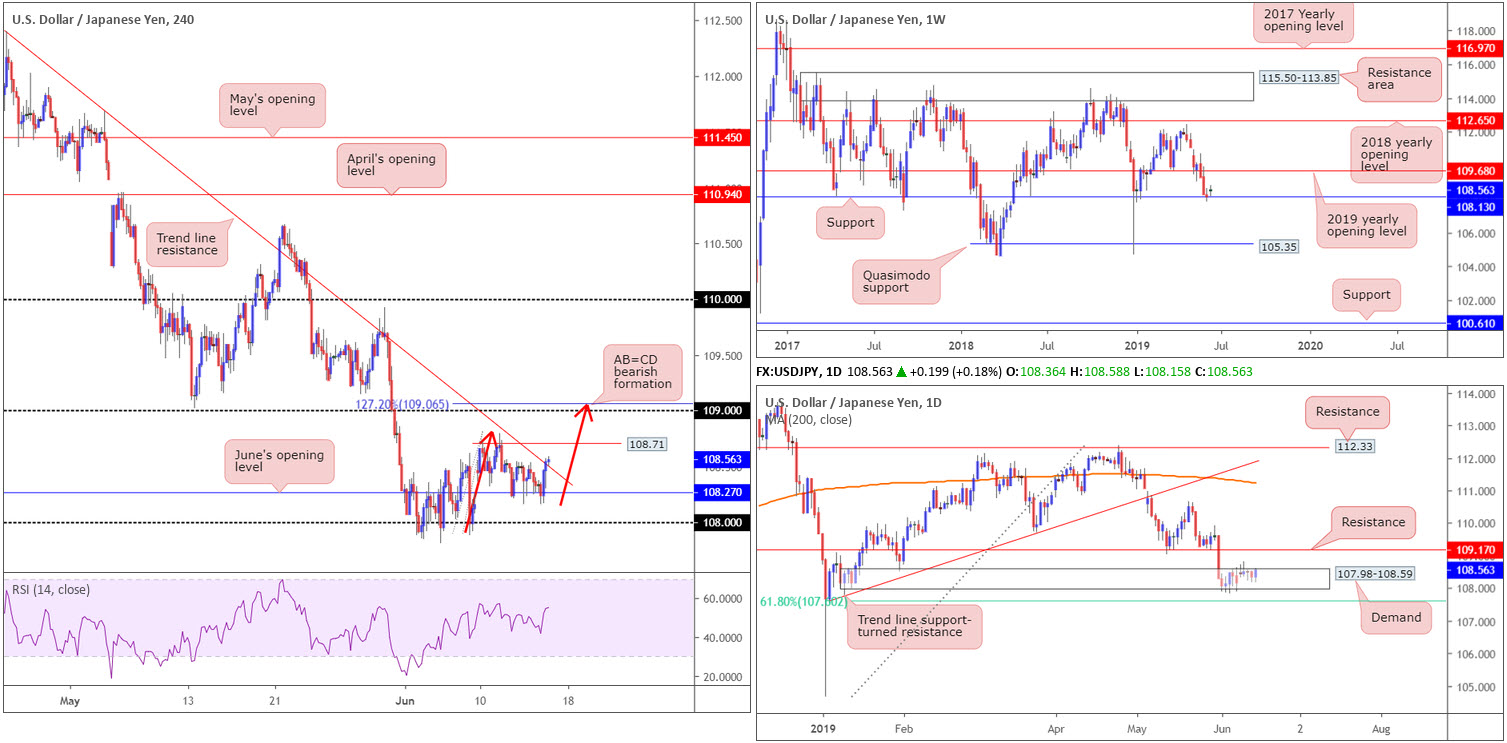
Over the course of the past two weeks, longer-term flows have been engaging with support at 108.13. Although the level remains unbroken and could eventually encourage a run towards the 2019 yearly opening level at 109.68, the lack of enthusiasm off this barrier casts uncertainty. With that in mind, traders may want to acknowledge Quasimodo support at 105.35 in the event price action explores lower ground in the weeks to come.
Daily perspective:
Demand at 107.98-108.59, despite price action clipping the lower edge of the base the week prior, remains intact. Interestingly, Friday’s upside movement produced a reasonably nice-looking bullish engulfing formation, which if acted upon, may call for a run towards resistance at 109.17.
Failure to advance from current price, nonetheless, opens up the possibility of a move materialising towards a 61.8% Fibonacci support value at 107.60.
H4 perspective:
Friday’s upbeat macroeconomic data releases out of the US provided the greenback fresh impetus, allowing the USD/JPY to advance to a session top of 108.58.
June’s opening level at 108.27 survived a barrage of downside attempts since Wednesday, and concluded the week marginally breaking through trend line resistance extended from the high 112.40. The next upside hurdle can be seen nearby at 108.71 (Quasimodo resistance), though the 109 handle may also enter the fold as resistance this week as it converges with a 127.2% AB=CD (red arrows) bearish formation at 109.06.
Areas of consideration:
This week’s attention, although the market may not reach this high, is around the 109 handle for shorting opportunities. The research team favour this zone due to the H4 AB=CD connection and daily price establishing resistance overhead at 109.17. Therefore, conservative stop-loss placement is best above this daily barrier. The first downside target will likely be around 108.71, followed by June’s opening level at 108.27 (though do remember daily support could potentially enter the mix around 108.59 [the top edge of daily demand]). Timed right, this trade could produce favourable risk/reward.
Today’s data points: Limited.
USD/CAD:
Weekly gain/loss: +1.08%
Weekly close: 1.3408
Weekly perspective:
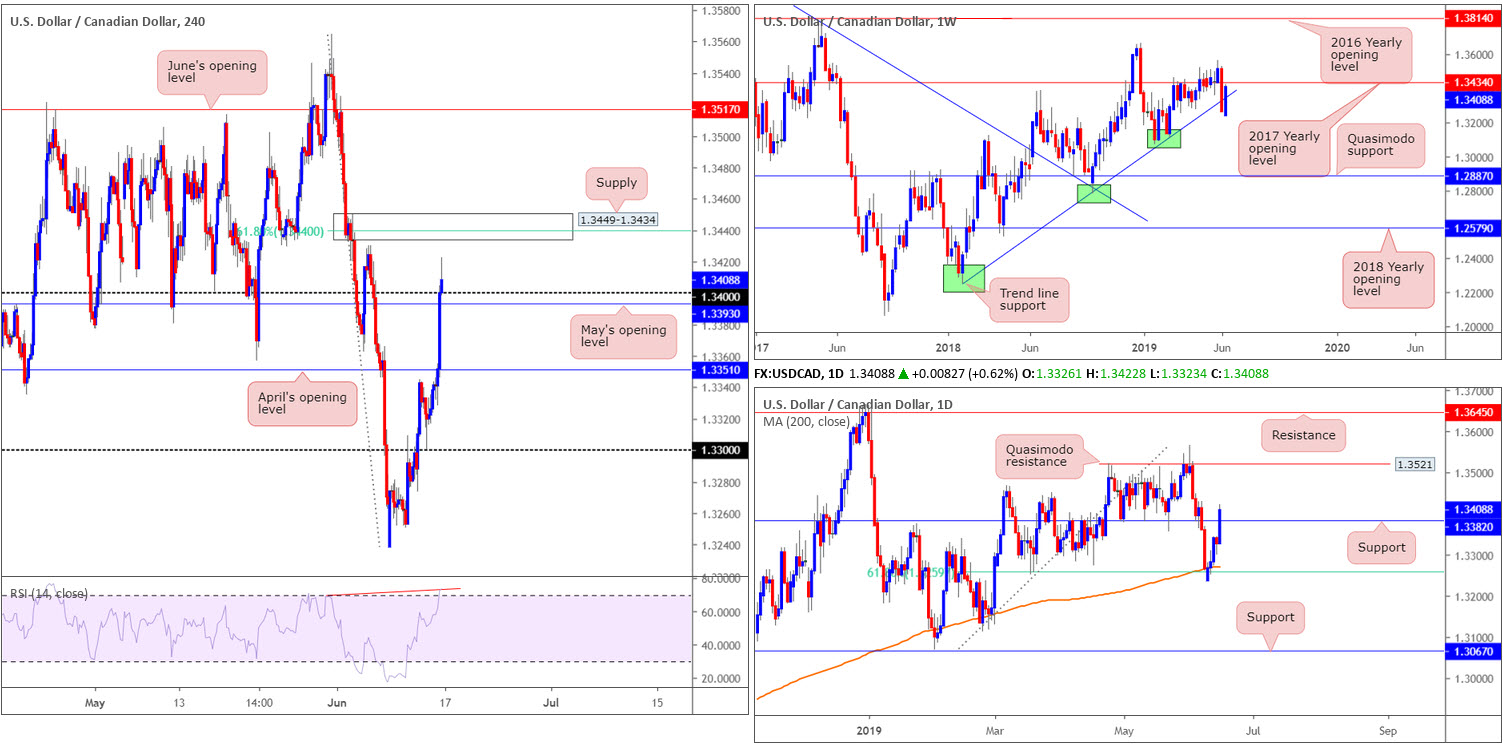
A stronger-than-expected rebound from 1.3238 emerged last week, reclaiming trend line support extended from the low 1.2247 and closing within close proximity to the underside of the 2017 yearly opening level at 1.3434. Given yearly opening levels often hold price there’s a strong chance a selloff may develop should the level enter the fight this week.
Daily perspective:
A closer reading of price action on the daily timeframe shows the pair remains on a northerly trajectory following the rebound from the 200-day SMA and merging 61.8% Fibonacci support value at 1.3260 at the beginning of last week. Friday witnessed a strong break above resistance at 1.3382 (now acting support), potentially setting the stage for a move towards Quasimodo resistance at 1.3521.
H4 perspective:
Friday observed the US dollar gain traction against its Canadian counterpart amid promising retail sales data in May. A number of technical resistances were engulfed in the process, including the 1.34 handle, which has perhaps unlocked upside to supply coming in at 1.3449-1.3434 (merges with a 61.8% Fibonacci resistance value at 1.3440). Traders who follow indicators may also wish to note the RSI is currently pencilling in a hidden divergence reading within overbought terrain (red line).
Areas of consideration:
The H4 supply mentioned above at 1.3449-1.3434 is of interest for possible shorting opportunities this week, having seen the base merge with a 61.8% Fibonacci resistance at 1.3440, possibly align with an RSI divergence/overbought reading and merge with the 2019 yearly opening level on the weekly timeframe at 1.3434 (represents the lower edge of the H4 supply). The only drawback to this is daily flow suggesting a move to Quasimodo resistance at 1.3521.
Conservative traders may wish to wait and see how H4 action behaves before pulling the trigger (preferably wait for a H4 bearish candlestick signal to form and enter based on its structure), as this will help avoid being whipsawed out of a position. Another alternative is to simply position stop-loss orders above the upper edge of the supply (1.3449) and enter at 1.3434, with the first downside target set at 1.34.
Today’s data points: Limited.
USD/CHF:
Weekly gain/loss: +1.11%
Weekly close: 0.9984
Weekly perspective:
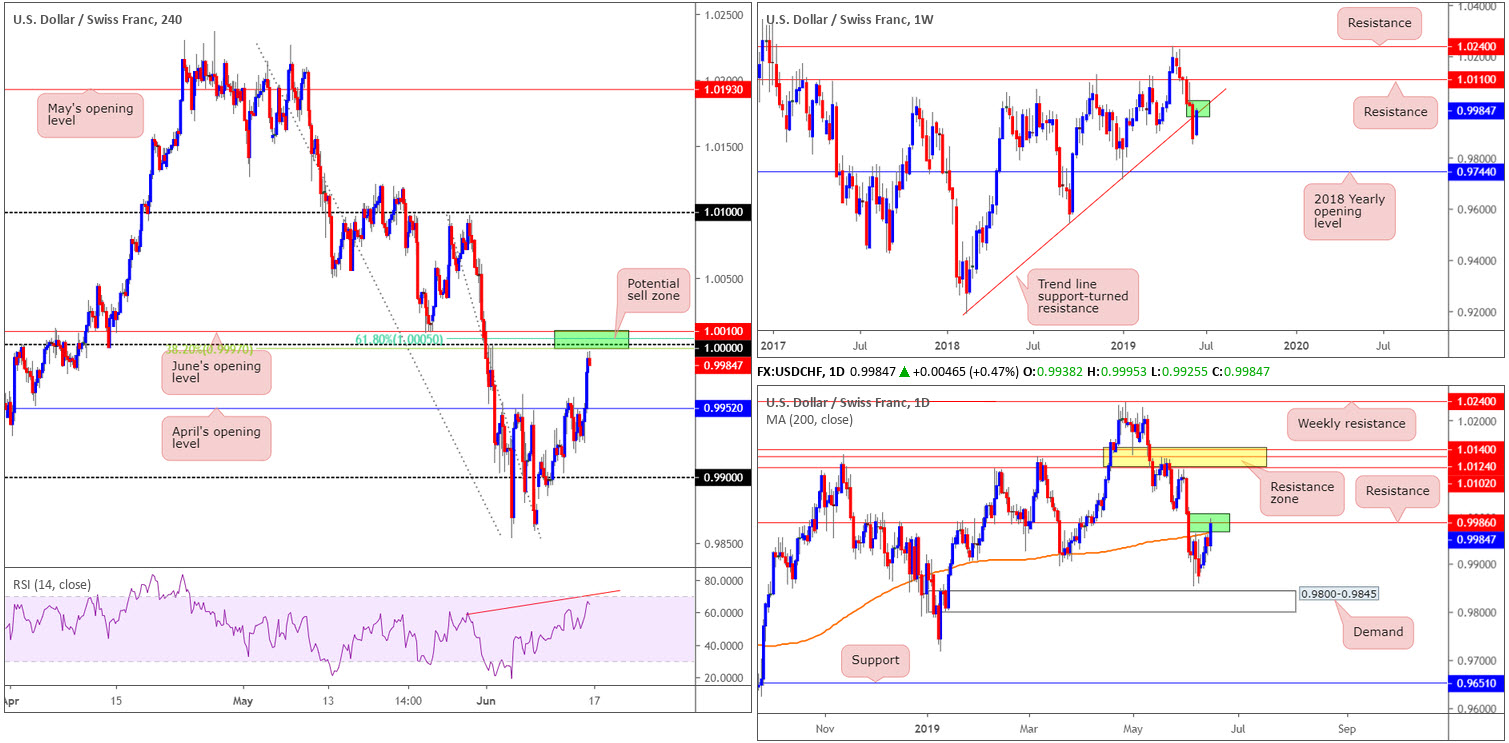
Snapping a six-week long bearish phase, the USD/CHF recovered in reasonably strong fashion last week, adding more than 100 points. What this move also accomplished was a retest of trend line support-turned resistance extended from the low 0.9187. Assuming this line holds its ground, the pair may witness a resurgence of selling emerge this week, with the next obvious downside target seen at 0.9744: the 2018 yearly opening level.
Daily perspective:
In tandem with weekly structure, daily movement overthrew its 200-day SMA and shook hands with resistance coming in at 0.9986 in recent trading. A rejection from this figure this week may call for a test of demand seen at 0.9800-0.9845. In the event we continue higher, however, focus is on the resistance area marked in yellow at 1.0140/1.0102.
H4 perspective:
Across the board, the US dollar rose higher vs. major counterparts, hauling the USD/CHF H4 candles through April’s opening level at 0.9952 to within touching distance of 1.0000 (parity), closely merging with June’s opening level at 1.0010 and a 61.8% Fibonacci resistance value at 1.0005 as well as a 38.2% Fibonacci resistance at 0.9997. In addition, we can also see the RSI indicator fast approaching overbought territory which should also offer hidden divergence (red line).
Areas of consideration:
As a result of current structure, the research team has labelled 1.0000 as a prime location to consider shorts from today/early week. This is largely due to the surrounding H4, daily and weekly confluence present around 1.0000.
Despite this, round numbers, particularly key levels such as 1.0000, are prone to sizeable whipsaws, or stop runs. Traders are, therefore, recommended to wait and see how H4 price responds from 1.0000 before initiating a position. Depending on the confirmation technique employed, this should help identify seller intent and also maybe set entry and risk levels to trade with.
Today’s data points: Limited.
Dow Jones Industrial Average:
Weekly gain/loss: +0.40%
Weekly close: 26134
Weekly perspective:
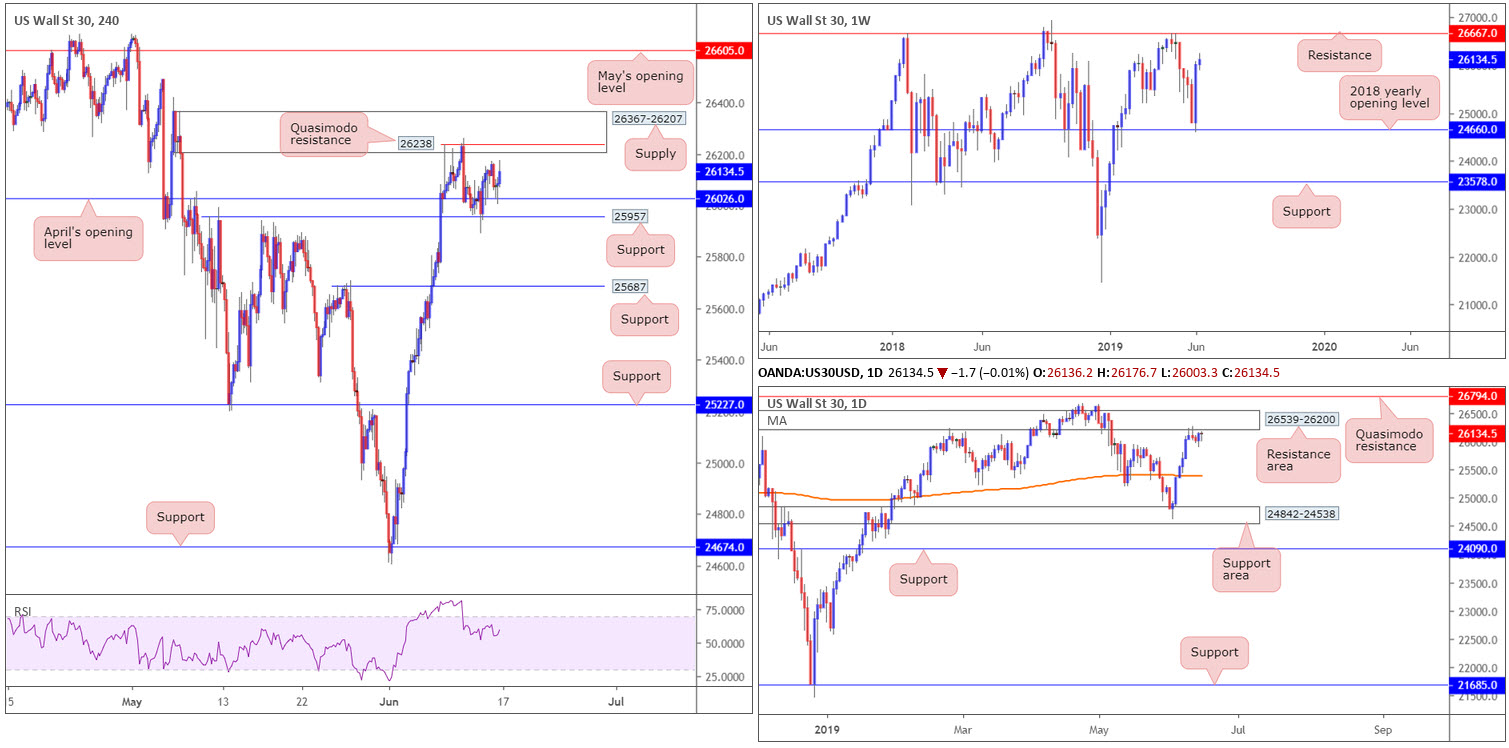
In robust fashion, US equities snapped back more than three weeks’ worth of losses the week prior off its 2018 yearly opening level at 24660, consequently producing a bullish engulfing pattern. Additional upside formed last week, though was narrow in comparison. Further buying this week has resistance in view at 26667.
Daily perspective:
The run higher last week failed to do much damage to a resistance area coming in at 26539-26200, unable to penetrate the inside range. Although weekly structure suggests price action may be headed for resistance at 26667, the odds of additional selling evolving from here beforehand is extremely high, targeting a run towards the 200-day SMA around 25411.
H4 perspective:
Despite ranging more than 170 points Friday, direction was limited and remained above April’s opening level at 26026. The Dow Jones Industrial Average closed lower by 0.07%; the S&P 500 also declined 0.16%, along with the tech-heavy Nasdaq 100 losing 0.42%.
The supply at 26367-26207, which converges with the lower edge of the daily resistance area mentioned above at 26539-26200, remains of interest this week for possible shorting opportunities. However, given the zone has already welcomed a test last week, waiting for notable bearish confirmation is worth considering before taking the plunge. This could be anything from a H4 or H1 bearish candlestick configuration, a lower-timeframe MA crossover or even drilling down to the lower timeframes and attempting to trade local (price action) structure within the zone.
Areas of consideration:
With sell orders likely consumed around the lower edge of the current H4 supply, traders may witness a move higher into the area before turning lower. The Quasimodo resistance at 26238 is a possible sell zone, for example.
Today’s data points: Limited.
XAU/USD (GOLD):
Weekly gain/loss: +0.07%
Weekly close: 1341.2
Weekly perspective:
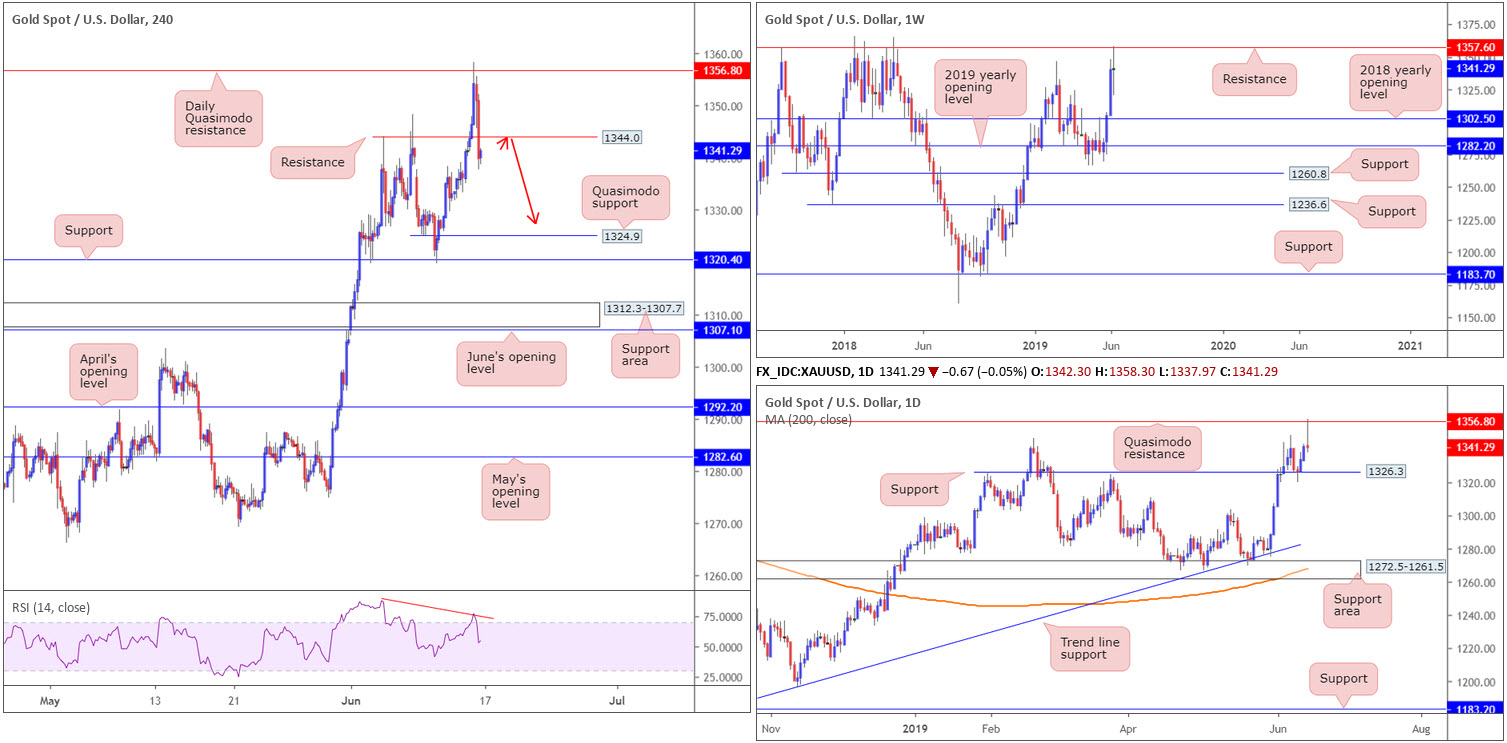
Although boasting a healthy range of more than $38 last week, bullion finished by way of a clear-cut indecision candle. What is interesting from a technical perspective, though, is resistance at 1357.6 entered the mix, which happens to boast strong historical significance. This, technically speaking, may entice sellers into the market this week, with an eventual test possibly seen at support drawn from the 2018 yearly opening level at 1302.5.
Daily perspective:
Together with weekly resistance mentioned above at 1357.6, daily activity engaged with Quasimodo resistance at 1356.8 Friday and chalked up a shooting star formation: a typical bearish signal for a candlestick trader.
Downside from current price, however, is somewhat limited with nearby support seen at 1326.3.
H4 perspective:
For folks who held on to their long from 1320.4 last week and targeted weekly resistance mentioned above at 1357.6, great work!
Going forward, the research team sees limited support on the H4 scale until reaching a Quasimodo formation at 1324.9 (positioned just south of the daily support mentioned above at 1326.3), closely followed by key support at 1320.4. Therefore, according to the H4 timeframe, there is room for the daily shooting star formation to generate some downside this week. It might also interest some traders to note the RSI indicator recently chalked up a negative divergence reading (red line).
Areas of consideration:
As of current price, the only area of resistance available on the H4 timeframe at the moment is 1344.0, an old Quasimodo left shoulder formation. A retest of this beauty in the shape of either a H1 or H4 bearish candlestick pattern (entry and risk can be calculated according to the pattern’s structure) would, in light of the overall technical picture, likely be sufficient enough to draw in selling, targeting daily support at 1326.3 as the initial downside objective, followed by Quasimodo support on the H4 timeframe at 1324.9 and H4 support at 1320.4.
The accuracy, completeness and timeliness of the information contained on this site cannot be guaranteed. IC Markets does not warranty, guarantee or make any representations, or assume any liability with regard to financial results based on the use of the information in the site.
News, views, opinions, recommendations and other information obtained from sources outside of www.icmarkets.com.au, used in this site are believed to be reliable, but we cannot guarantee their accuracy or completeness. All such information is subject to change at any time without notice. IC Markets assumes no responsibility for the content of any linked site. The fact that such links may exist does not indicate approval or endorsement of any material contained on any linked site.
IC Markets is not liable for any harm caused by the transmission, through accessing the services or information on this site, of a computer virus, or other computer code or programming device that might be used to access, delete, damage, disable, disrupt or otherwise impede in any manner, the operation of the site or of any user’s software, hardware, data or property.


