
Key risk events today:
US banks are closed in observance of Presidents’ Day.
(Previous analysis as well as outside sources – italics).
EUR/USD:
Weekly gain/loss: -1.07%
Weekly close: 1.0829
Weekly perspective:
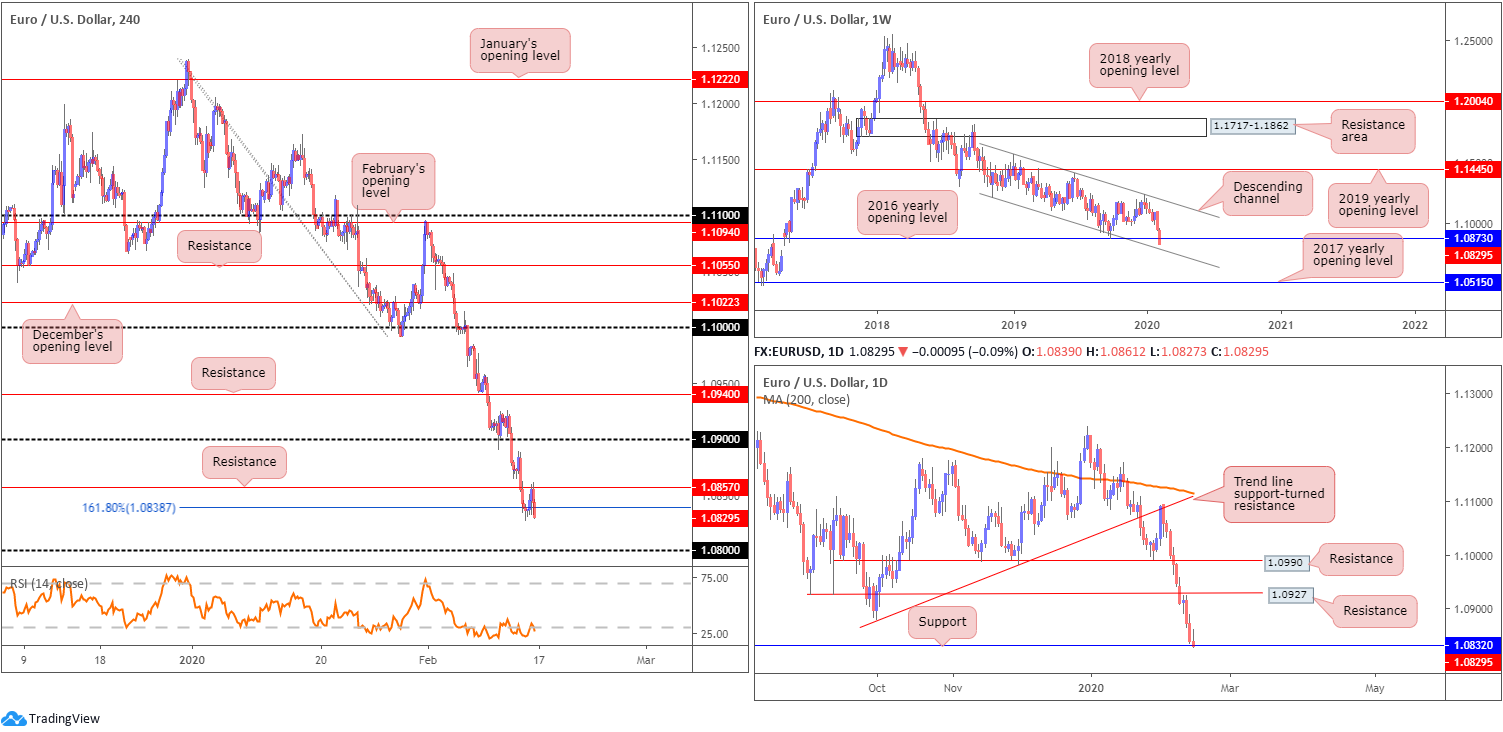
EUR/USD held on to the bulk of its losses last week, down more than 1.00% at the close of trade. The 2016 yearly opening level from 1.0873 ceded ground, consequently exposing channel support, taken from the low 1.1109. Further supporting sellers is the primary trend, down since topping in early 2018, at 1.2555.
Daily perspective:
Following a near-retest at resistance drawn from 1.0927 on Wednesday, the pair retained a strong underlying offer into the week’s end. Support at 1.0832 entered the fight Friday, though failed to chalk up anything meaningful to the upside. Failure to hold off 1.0832 provides an early cue we’re likely heading for weekly channel support (1.1109) and, on the daily scale, invites an approach to a support level at 1.0612.
H4 perspective:
Friday’s flash Q4 GDP reading in Germany reported lower-than-expected figures, though failed to provoke much movement. Later, US Retail Sales expanded in line with expectations in January, providing fresh impetus to EUR/USD towards resistance at 1.0857 off a 161.8% Fibonacci extension point at 1.0838. Finally, the University of Michigan’s preliminary gauge of US Consumer Sentiment for the current month rose to 100.9, beating the 99.5 consensus. The market, however, largely ignored the release.
The US dollar index continues to firm north of 99.00, retesting the round number to-the-point during Friday’s US morning session.
Indicator-based traders might also be interested to note the EUR/USD’s relative strength index (RSI) has remained within oversold waters since February 6th.
Areas of consideration:
With price crossing the 2016 yearly opening level at 1.0873, increased selling on the weekly timeframe is certainly a possibility, at least until we reach channel support around the 1.0780 region.
Daily support at 1.0832 could spark some interest this week, but given the euro’s softness over previous sessions, it’s a questionable level. The same can be said for the 161.8% H4 Fibonacci extension at 1.0838. H4 resistance at 1.0857 held firm into the close, forcing a mild close south of the Fib level.
Traders may look for intraday bearish scenarios south of daily support 1.0832, in the event we push for lower ground this week, targeting the 1.08 handle on the H4. 1.08, while a downside target, is also a potential barrier of support, having seen channel support on the weekly timeframe coincide closely with the round number (1.0780).
GBP/USD:
Weekly gain/loss: +1.22%
Weekly close: 1.3043
Weekly perspective:
Sterling regained a large portion of the prior week’s losses in recent trade, adding more than 150 points into the close.
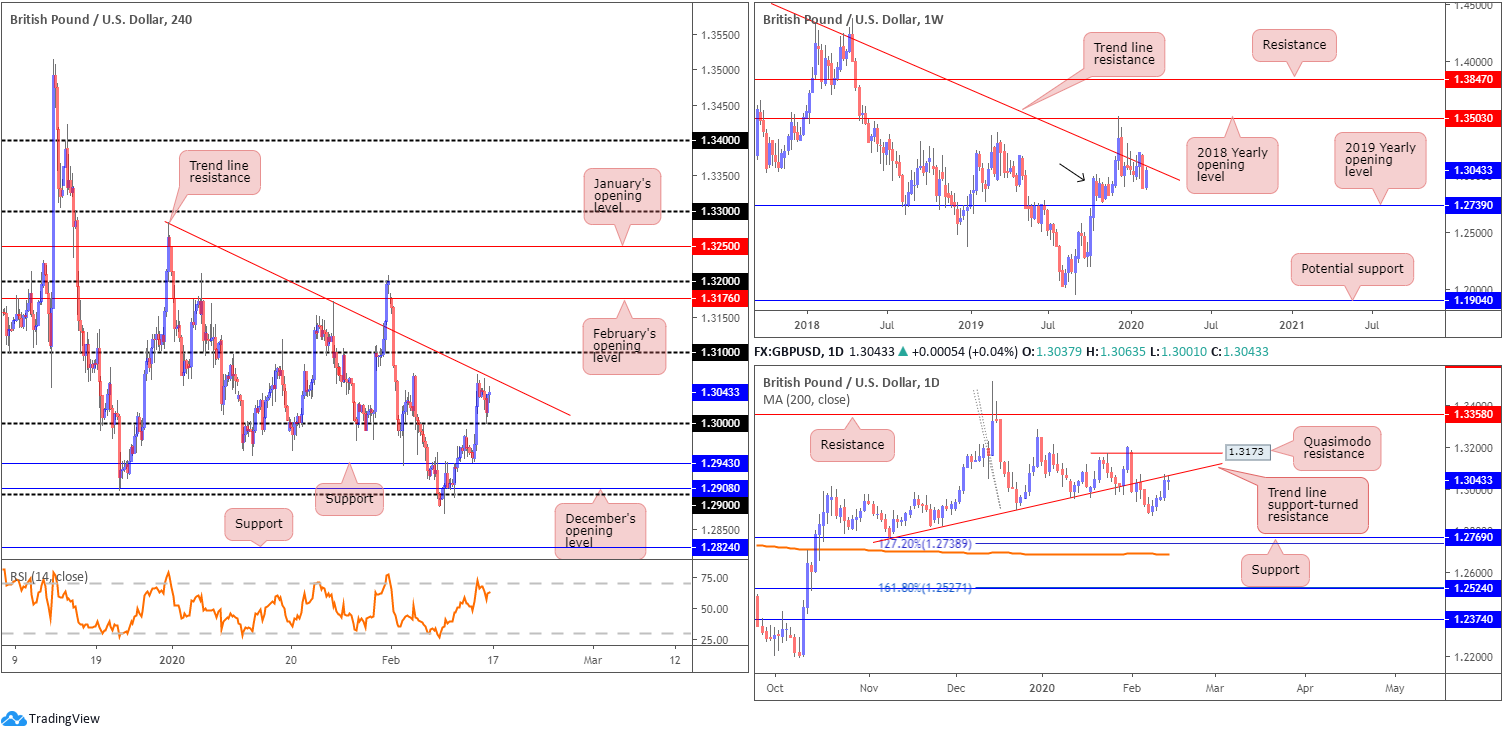
Price action on the weekly timeframe trades beneath long-standing trend line resistance, pencilled in from the high 1.5930, though demand around the 1.2939 region is also still in motion (black arrow). Continued downside may imply a break of the said demand, tripping sell stops and testing the 2019 yearly opening level at 1.2739. A break higher, on the other hand, could see the 2018 yearly opening level enter the fight at 1.3503.
Daily perspective:
Last week’s movement on the daily timeframe ended at the underside of a trend line support-turned resistance, extended from the low 1.2768, largely thanks to Thursday’s politically-driven bid higher.
A break above the said trend line resistance this week highlights Quasimodo resistance at 1.3173, whereas a notable rejection may set the stage for a run to support fixed at 1.2769, a 127.2% Fibonacci extension at 1.2738 and the 200-day SMA (1.2688). Note the said SMA has been flattening since mid-October 2019.
H4 perspective:
A quick recap of Friday’s movement on the H4 timeframe revealed the pair failed to extend Thursday’s gains. A modestly strong US dollar and mixed US retail sales data capped upside.
Technically speaking, GBP/USD pulled back to lows just shy of the key figure 1.30 before turning higher into the close. Trend line resistance, taken from the high 1.3284, provides a potential ceiling this week, with a break drawing the 1.31 handle to surface. Beyond 1.30, nevertheless, key levels of support this week fall in at 1.2943, December’s opening level at 1.2908 and the 1.29 handle.
The relative strength index (RSI) is also seen fading overbought values.
Areas of consideration:
The trend line resistance based on the H4 timeframe may entice selling, in the event of a test this week, knowing we’re trading nearby weekly and daily trend line resistances. In view of the higher-timeframe’s confluence here, a move beneath 1.30 this week is in the offing, with potential to test the H4 supports highlighted above.
Although trader dependent, waiting for additional H4 candlestick confirmation to form off the trend line resistance is an option. This helps recognise seller intent and offers entry/risk levels to trade, but there’s clearly a risk of missing the trade entirely should a bearish candlestick signal not form. That’s generally the trade-off when looking for additional confirmation.
AUD/USD:
Weekly gain/loss: +0.52%
Weekly close: 0.6712
Weekly perspective:
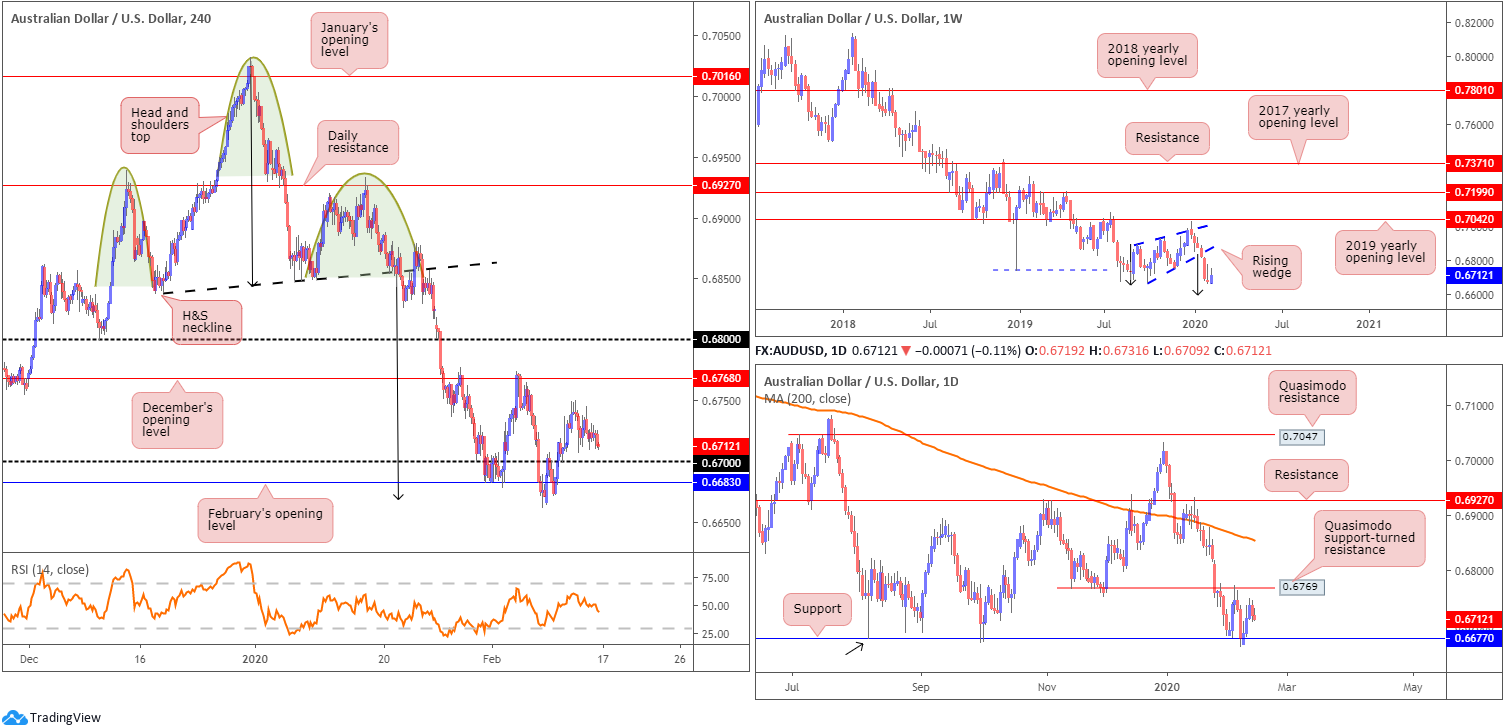
Since registering a bottom in late September at 0.6670 (2019), price carved out a rising wedge formation, typically considered a continuation pattern within a trending environment. The past six weeks witnessed price decline back into the rising wedge and extend beyond the lower boundary. With the primary downtrend having been in full force since topping at 0.8135, in early 2018, further downside is possible, despite last week’s modest recovery.
Assuming a close beneath the 0.6670 September 30th low, the rising wedge take-profit (black arrows – calculated by taking the height of the base and adding it to the breakout point) is seen at 0.6599, followed by support at 0.6359 (not visible on the screen).
Daily perspective:
The daily timeframe has buyers and sellers squaring off between support from 0.6677 and Quasimodo support-turned resistance at 0.6769. The next support target beyond 0.6677, in the event of further selling, falls in around 0.6508 (not visible on the screen). Traders may also want to note the 200-day SMA (orange – 0.6855), should we push for higher levels (trading lower since April 2018).
H4 perspective:
The H4 head and shoulders top in January finally hit the H&S take-profit target at 0.6668 (black arrows – calculated by taking the distance between the head and the neckline and adding it to the breakout point) on February 7th. It took nearly three weeks to complete. Well done to any readers who held tight.
Since Wednesday, AUD/USD struggled to generate much noteworthy price movement, fluctuating within a reasonably tight range ahead of the 0.67 handle and now faced with the possibility of a run to December’s opening level at 0.6768 this week.
Areas of consideration:
Weekly price invites further selling, according to our chart studies. Daily price could, nonetheless, pop to 0.6769 before we navigate lower ground, as could H4 price to 0.6768.
Focus, therefore, remains around the 0.6768 region for potential shorting opportunities this week. The combination of H4 and daily resistance is likely to prompt a move lower, with the 0.67 handle on the H4 open as an initial downside target. Conservative traders may wish to explore an alternative entry approach, in order to help avoid being taken out on a whipsaw. This could be something as simple as a bearish candlestick signal, though this, of course, is trader dependent.
USD/JPY:
Weekly gain/loss: +0.01%
Weekly close: 109.77
Weekly perspective:
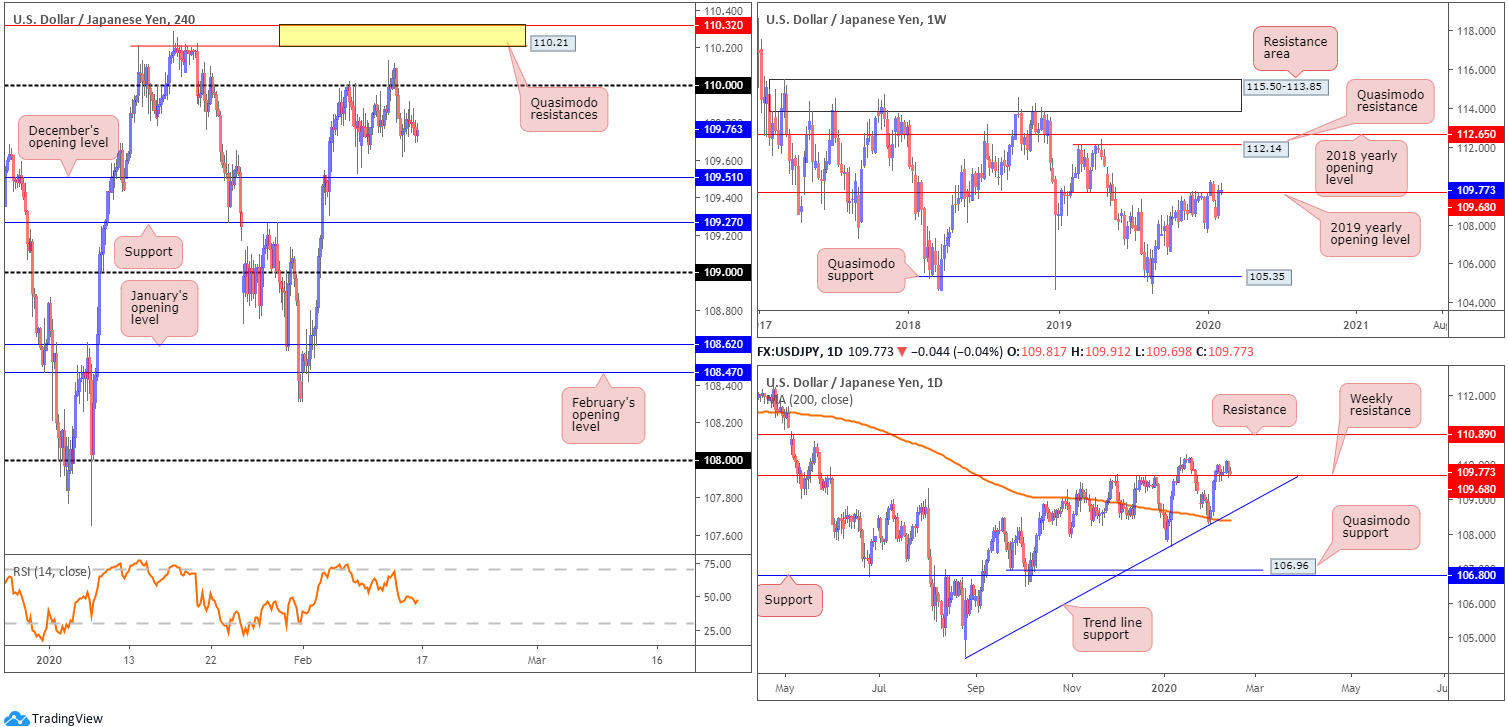
After scoring a low of 108.31, USD/JPY bulls entered a bullish phase, marginally breaking through the 2019 yearly opening level at 109.68. As evident from the weekly chart, though, buyers lacked enthusiasm last week.
A decisive push above the said barrier underlines a possible approach towards Quasimodo resistance at 112.14, closely followed by the 2018 yearly opening level at 112.65, over the coming weeks. A significant rejection, however, could entice moves to the 107.65 January 6th low this week. Beneath the aforementioned low, limited support is evident until reaching the 106.48 September 30th low, followed by Quasimodo support coming in at 105.35.
Daily perspective:
Price continued to retest the current weekly resistance as support on the daily timeframe last week. Failure to hold has trend line support, extended from the low 104.44, in view, followed by the 200-day SMA (orange – 108.38). Moves higher, on the other hand, could have resistance at 110.89 enter the mix.
So far, we’ve yet to see much from price action suggesting buyer intent.
H4 perspective:
Following uninspiring US retail sales figures, Friday had the USD/JPY entrenched within a relatively tight range between 109.91/109.69. The 110 handle features as possible resistance this week, as do two layers of Quasimodo resistances at 110.32 and 110.21 (yellow). Downside supports remain located at December’s opening level drawn from 109.51, support at 109.27 and the 109 handle.
Areas of consideration:
Based on the weekly timeframe’s structure, the 2019 yearly opening level at 109.68 remains a probable resistance. Recent movement above the aforementioned level is not a cause for concern (for those with long-term shorts, that is) on the weekly timeframe given the close above the level is less than 10 points, and unlikely sufficient to excite breakout buying.
Daily price shows the unit retesting the weekly level as support, but has yet to pencil in anything of note to the upside, therefore pushing buyers to the sidelines for now.
This leaves H4 movement, which, as highlighted above, trades south of 110, down from Wednesday’s peak of 110.13.
According to the technical studies presented here, neither a long nor short seems attractive right now, due to uncertain direction on the higher timeframes.
USD/CAD:
Weekly gain/loss: -0.40%
Weekly close: 1.3247
Weekly perspective:
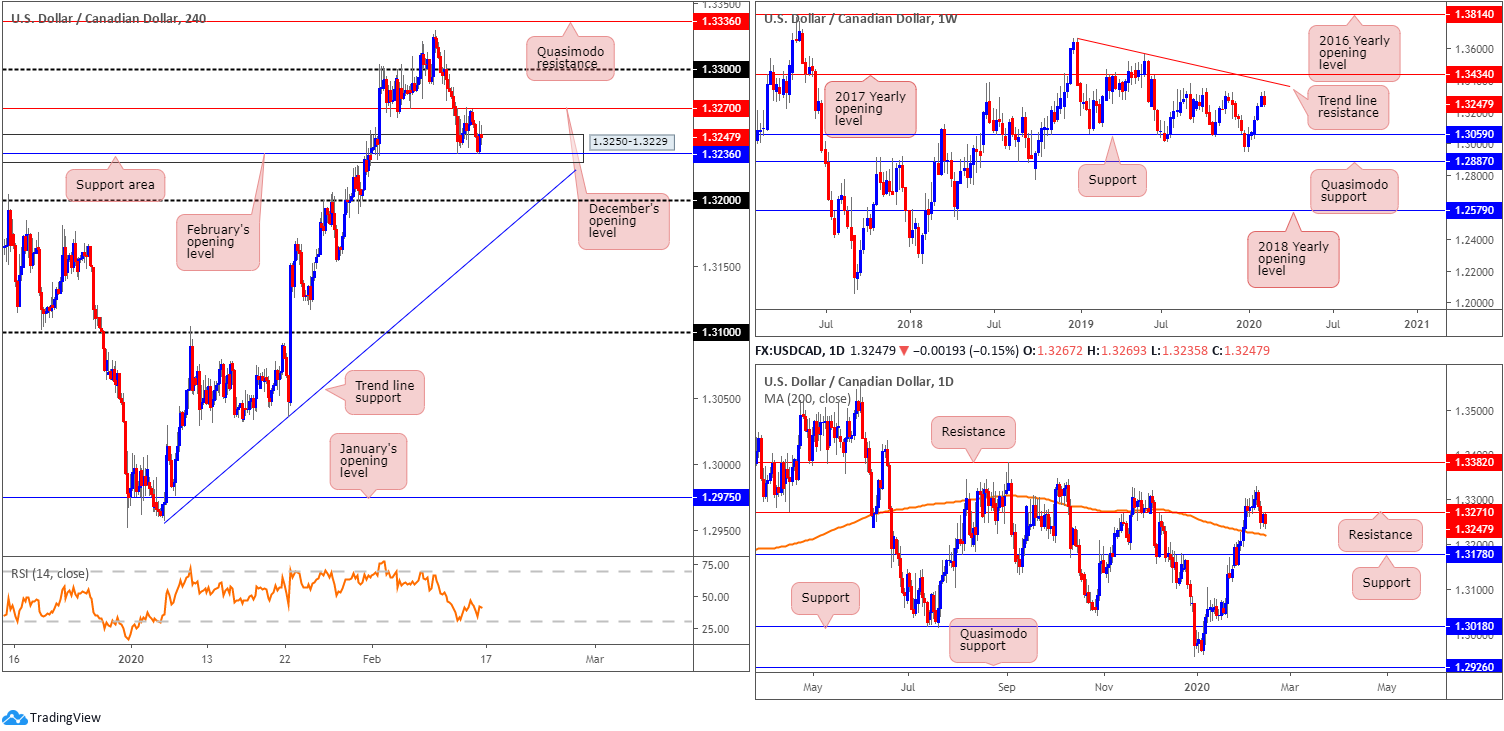
Price on the weekly timeframe halted just south of tops around 1.3340 last week, consequently snapping a five-week bullish phase. Additional resistance resides at a trend line formation (1.3661) and the 2017 yearly opening level at 1.3434. Support, in contrast, can be found around the 1.3059 neighbourhood.
Daily perspective:
In conjunction with weekly flow, the daily timeframe recently overthrew support at 1.3271 and retested the level to-the-point as resistance on Thursday. Downside has the 200-day SMA (orange – 1.3221) as potential support, with a break perhaps unlocking the trapdoor to a well-rounded support from 1.3178.
H4 perspective:
The US dollar modestly declined vs. the Canadian dollar Friday, scoring a session low at 1.3235 amid early US trade, before mildly paring losses into the close. WTI prices advanced Friday, providing a modest lift to the Canadian dollar, though was seemingly negated due to the US dollar index exploring higher ground.
Technical structure on the H4 scale has a support area at 1.3250-1.3229 in sight, reinforced by February’s opening level at 1.3236. To the upside, resistance remains at 1.3270, in the shape of December’s opening level.
For traders who read Friday’s technical briefing you may recall the following piece:
Going off the presented chart studies, sellers appear to have the upper hand right now. December’s opening level at 1.3270 on the H4, along with daily price fading resistance at 1.3271 and weekly price coming within a whisker of weekly tops at 1.3340, is likely enough evidence to encourage additional selling today and possibly next week.
Areas of consideration:
Well done to any readers short December’s opening level at 1.3270. Take-profit targets reside around the 200-day SMA (1.3221), shadowed by the 1.32 handle on the H4, followed by trend line support, pencilled in from the low 1.2957.
USD/CHF:
Weekly gain/loss: +0.43%
Weekly close: 0.9818
Weekly perspective:
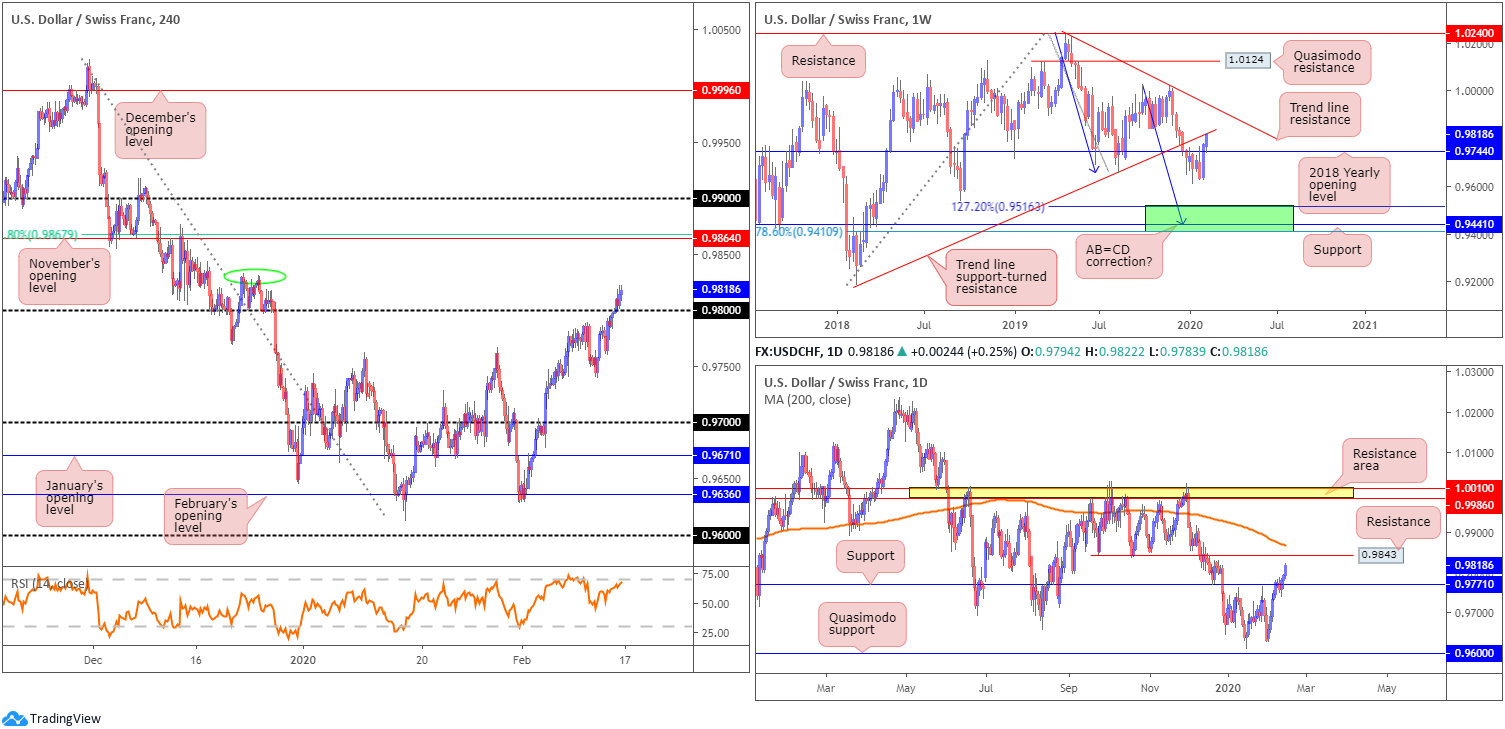
After a stronger-than-expected recovery that brushed aside the 2018 yearly opening level at 0.9744, last week’s activity retested the broken level as support and extended gains into the close. Adding more than 39 points, trend line resistance, etched from the high 1.0236, is next in line in terms of long-term targets this week.
On the other side of the coin, nonetheless, trend line support-turned resistance, drawn from the low 0.9187, could hamper upside this week, perhaps prompting an additional retest at 0.9744.
Daily perspective:
In recent sessions, USD/CHF buyers entered a strong offensive phase north of support at 0.9771, positioning the candles within striking distance of resistance at 0.9843 and the 200-day SMA (orange – 0.9867).
Continued bidding through the said resistances may encourage more US dollar upside to a resistance area coming in at 1.0010/0.9986.
H4 perspective:
It was highlighted in Friday’s technical briefing a H4 close above the 0.98 handle was a possibility, due to the higher timeframes, at the time, showing passage for a move higher.
The violation of the 0.98 has local tops to contend with around 0.9830 (green oval), with a break possibly setting the path for a run to November’s opening level at 0.9864. What’s interesting here is this level also comes with a 61.8% Fibonacci retracement at 0.9867. The said 200-day SMA also converges with the monthly opening level.
Areas of consideration:
Breakout buyers above 0.98 (likely filled at 0.9810, with a protective stop loss order positioned just beneath the breakout candle’s lower shadow at 0.9797) end the week in green territory, whereas conservative traders requiring a retest at 0.98 to form missed the long opportunity. A retest may still occur early week, though it will need to take shape prior to testing the H4 tops around 0.9830 and certainly before testing daily resistance at 0.9843.
In the event a retest materialises, conservative players may seek candlestick confirmation, such as a hammer pattern or an engulfing formation (entry and risk can be set according to this pattern) before committing. This is likely due to the fact round numbers are prone to whipsaws.
XAU/USD (GOLD):
Weekly gain/loss: +0.86%
Weekly close: 1583.6
Weekly perspective:
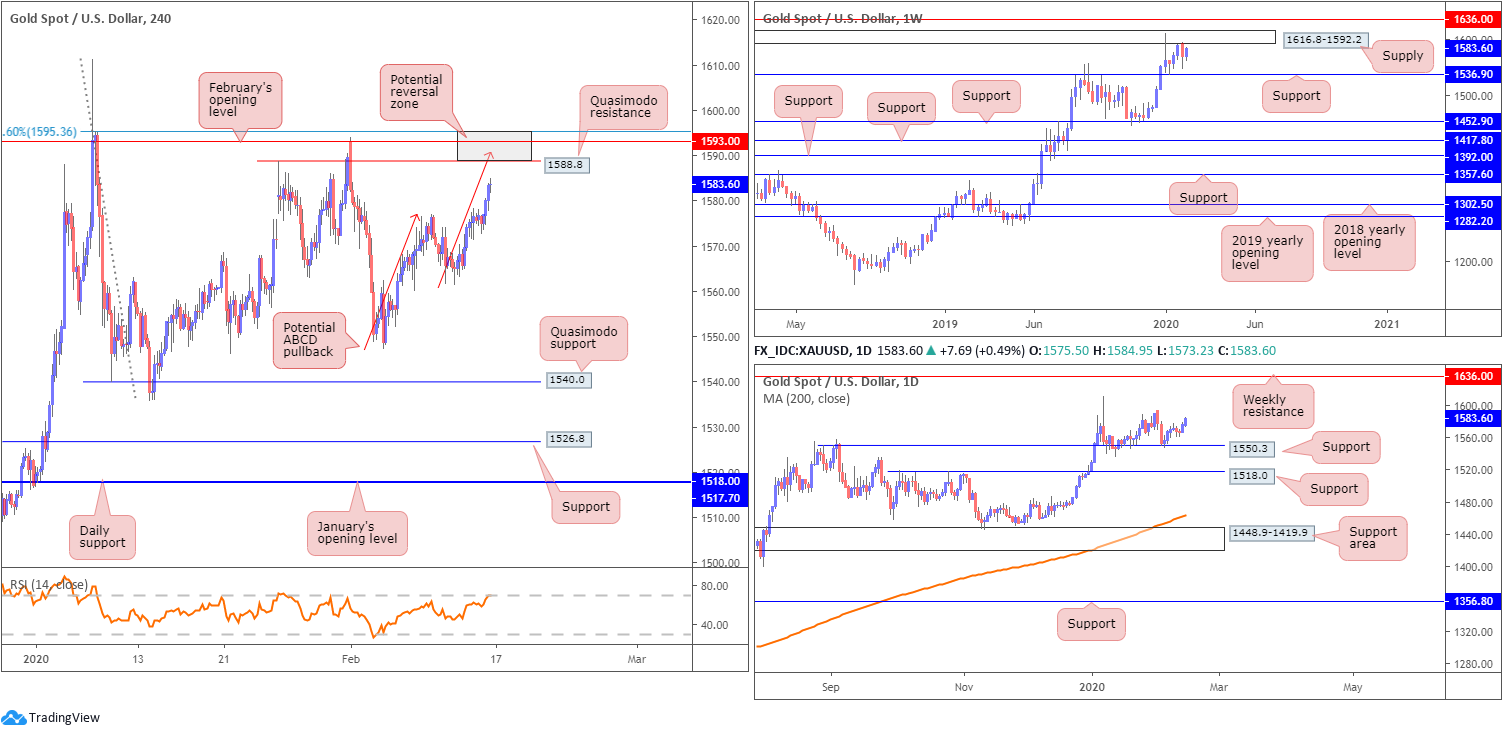
Since the beginning of the year, longer-term candles have been confined to a range between supply drawn from 1616.8-1592.2 and support at 1536.9. Areas outside of this consolidation can be seen at resistance from 1636.0 and support fixed at 1452.9.
Daily perspective:
A closer reading of price action on the daily timeframe has the unit extending recovery gains off support at 1550.3, fixed north of another layer of support at 1518.0.
Aside from the 1611.3 January 8th high, held by an area of supply drawn from mid-February 2013, the next level of resistance falls in on the weekly timeframe mentioned above at 1636.0.
H4 perspective:
XAU/USD, in $ terms, added more than $7, or 0.49%, Friday, extending Thursday’s recovery from 1565.6.
Thanks to Friday’s upside, the H4 candles are poised to complete an ABCD pullback (red arrows) just north of Quasimodo resistance at 1588.8. What’s also noteworthy from a technical stance is a 78.6% Fibonacci retracement value resides close by at 1595.3.
Collectively, we therefore have a potential reversal zone to work with this week between 1595.3/1588.8. Further supporting this zone, we can see the lower border of weekly supply at 1592.2 is stationed within our H4 resistance base.
Areas of consideration:
Keeping things simple this week, the research team feels 1595.3/1588.8 is worthy of attention and may cap upside in the event of a test this week. Aggressive traders will enter as per the structure of the reversal zone, with protective stop-loss orders likely sited a few points above 1595.3; conservative traders, however, may opt to wait for additional confirmation to form before pulling the trigger.
As for downside targets, traditional ABCD patterns usually favour the 38.2% and 61.8% Fibonacci retracements of legs A-D. Plotting this is only possible once the ABCD formation completes.
The accuracy, completeness and timeliness of the information contained on this site cannot be guaranteed. IC Markets does not warranty, guarantee or make any representations, or assume any liability regarding financial results based on the use of the information in the site.
News, views, opinions, recommendations and other information obtained from sources outside of www.icmarkets.com.au, used in this site are believed to be reliable, but we cannot guarantee their accuracy or completeness. All such information is subject to change at any time without notice. IC Markets assumes no responsibility for the content of any linked site.
The fact that such links may exist does not indicate approval or endorsement of any material contained on any linked site. IC Markets is not liable for any harm caused by the transmission, through accessing the services or information on this site, of a computer virus, or other computer code or programming device that might be used to access, delete, damage, disable, disrupt or otherwise impede in any manner, the operation of the site or of any user’s software, hardware, data or property.


