
EUR/USD:
Weekly Gain/Loss: -0.77%
Weekly Close: 1.1303
Weekly perspective:
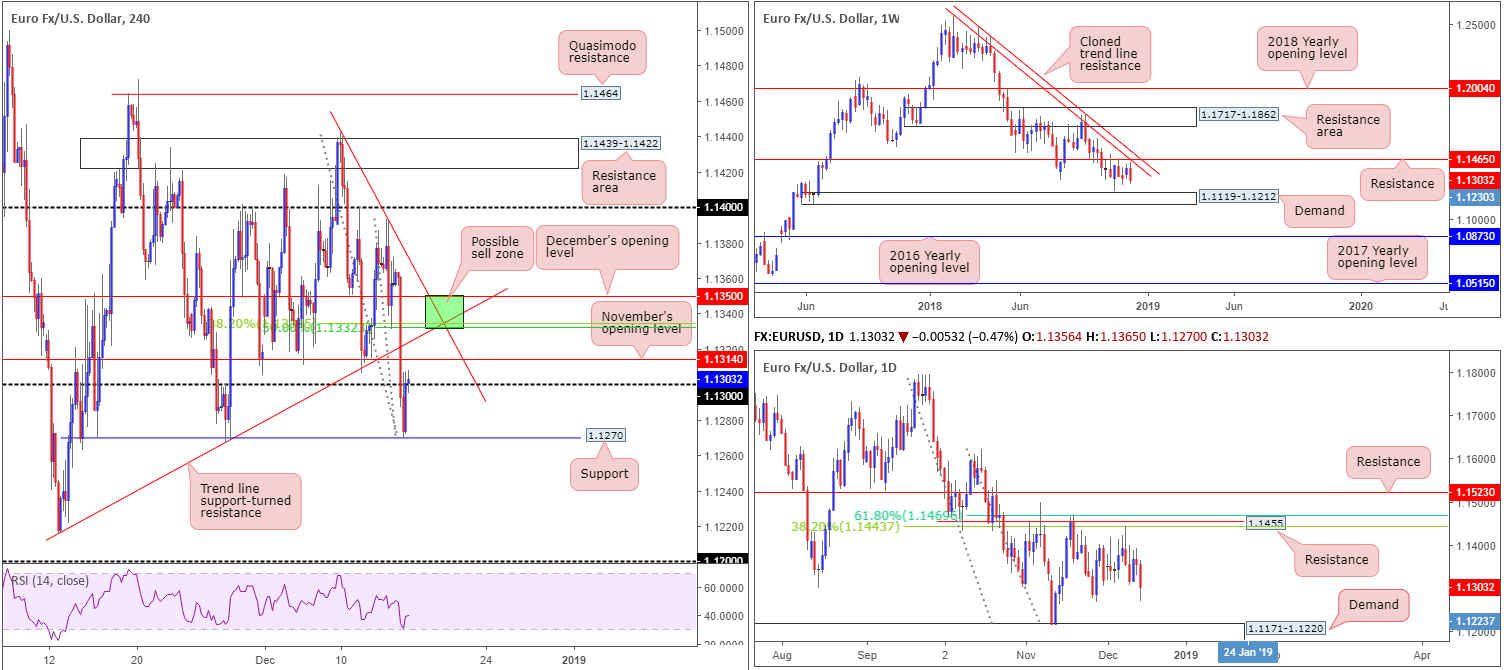
By way of a reasonably strong-looking bearish engulfing configuration forming just south of resistance priced in at 1.1465 (brings with it a nearby cloned trend line resistance [extended from the high 1.2413]), the EUR/USD concluded the week in negative territory. Should further downside surface this week, demand plotted at 1.1119-1.1212 is the next area in the firing range.
Daily perspective:
Closer inspection on the daily timeframe adds a proven base of resistance circulating around the 1.1455 region, which happens to closely converge with two Fibonacci resistances: a 61.8% and a 38.2% at 1.1469 and 1.1443, respectively.
As can be seen on the chart, the area capped upside three times in November and also held firm last Monday. Scope for additional selling is visible, targeting demand seen at 1.1171-1.1220 (glued to the top edge of the aforementioned weekly demand zone).
H4 perspective:
Led by Friday’s dismal Eurozone PMI readings, the pair overthrew its 1.13 handle in strong fashion. Fuelled by relatively upbeat US retail sales data, the euro ceded further ground to its US counterpart in early US hours, consequently testing nearby support coming in at 1.1270. Although price action mildly pared losses from this region and marginally reclaimed 1.13 to the upside, the day finished at -0.47%.
Directly above 1.13, our technical studies observe nearby resistance in the form of November’s opening level at 1.1314. Above here, we also have two merging trend line resistances (extended from 1.1255/1.1442) close by, which fuse with a 38.2% Fibonacci resistance at 1.1335 and a 50.0% resistance at 1.1332. In addition to this, it is also worth penciling in another layer of resistance seen nearby at 1.1350 in the shape of December’s opening level.
Areas of consideration:
Having seen both weekly and daily timeframes emphasize the possibility of additional selling this week, the research team notes possible shorting opportunities on the H4 timeframe between December’s opening level at 1.1350 and the two aforesaid converging trend line resistances/Fibonacci resistances (green – 1.1350/1.1332). A sell from here with stop-loss orders tucked a couple of pips beyond the zone is, according to the overall technical picture, a high-probability setup. Despite nearby H4 supports, the ultimate downside target from here falls in around the top edge of daily demand at 1.1220.
Today’s data points: Limited.
GBP/USD:
Weekly Gain/Loss: -0.95%
Weekly Close: 1.2583
Weekly perspective:
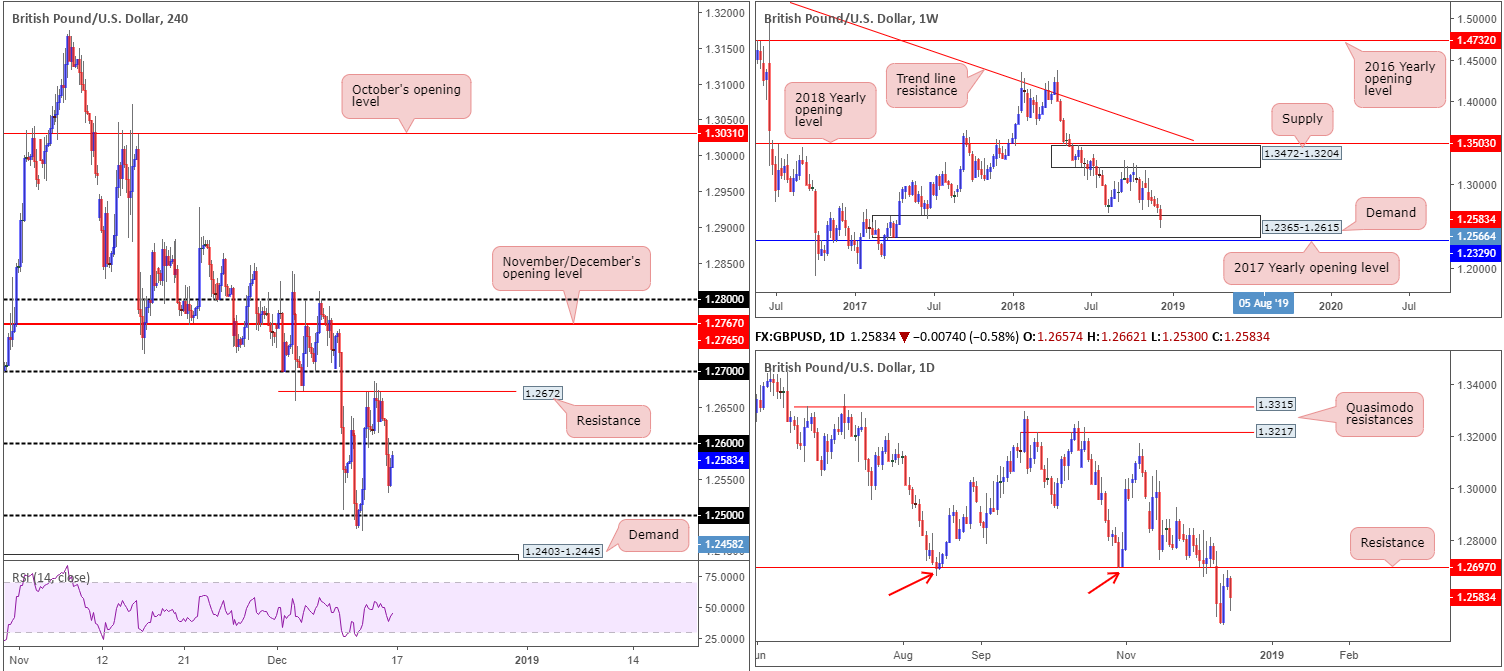
Registering its sixth consecutive weekly loss last week, cable firmly entered the walls of demand at 1.2365-1.2615 which happens to be positioned just north of the 2017 yearly opening level at 1.2329. While the current demand may offer some respite this week, traders might want to pencil in the possibility of a fakeout through this area to bring in buyers from 1.2329.
Daily perspective:
The story on the daily timeframe, however, reveals price action turned lower just south of notable resistance at 1.2697 at the closing stages of last week. Not only does this barrier hold significant history, room to push lower is seen towards support drawn from 1.2374 (not visible on the screen – located within the lower limits of the said weekly demand area).
H4 perspective:
Following Thursday’s failure to sustain gains beyond resistance at 1.2672, the GBP/USD fell sharply Friday.
Optimism over UK PM May’s leadership victory Wednesday (winning the vote by 200 – 117) waned, as the PM clearly struggles to find compromise between the EU and Parliament. The H4 candles, as is evident from the chart, reclaimed 1.26 to the downside in recent trade. Though price action found intraday support off lows of 1.2530, it was not enough to regain control of 1.26 into the close.
To the downside, traders likely have their crosshairs fixed on 1.25, followed closely by demand printed at 1.2403-1.2445. Note both the round number and demand are sited within the confines of the current weekly demand area.
Areas of consideration:
In regard to the higher timeframes the current trend is clear: DOWN. However, with respect to structure, conflicting signals are present: we have weekly price trading from demand, though at the same time we also have daily price attempting to selloff just south of resistance.
Medium term (H4), a retest of 1.26 is likely to be observed today. A rejection off this number has 1.25 to target, though a break above could witness further buying take shape towards resistance at 1.2672, shadowed closely by 1.27.
According to our research team, a sell from 1.26 or a buy on the break beyond the number are both viable scenarios going forward. To help avoid an unnecessary loss, nevertheless, traders are urged to wait and see how H4 action behaves before pulling the trigger. A H4 candlestick pattern, for example, not only provides buyer/seller intent, it also offers levels for entry and stop-loss placement.
Today’s data points: Limited.
AUD/USD:
Weekly Gain/Loss: -0.14%
Weekly Close: 0.7175
Weekly perspective:
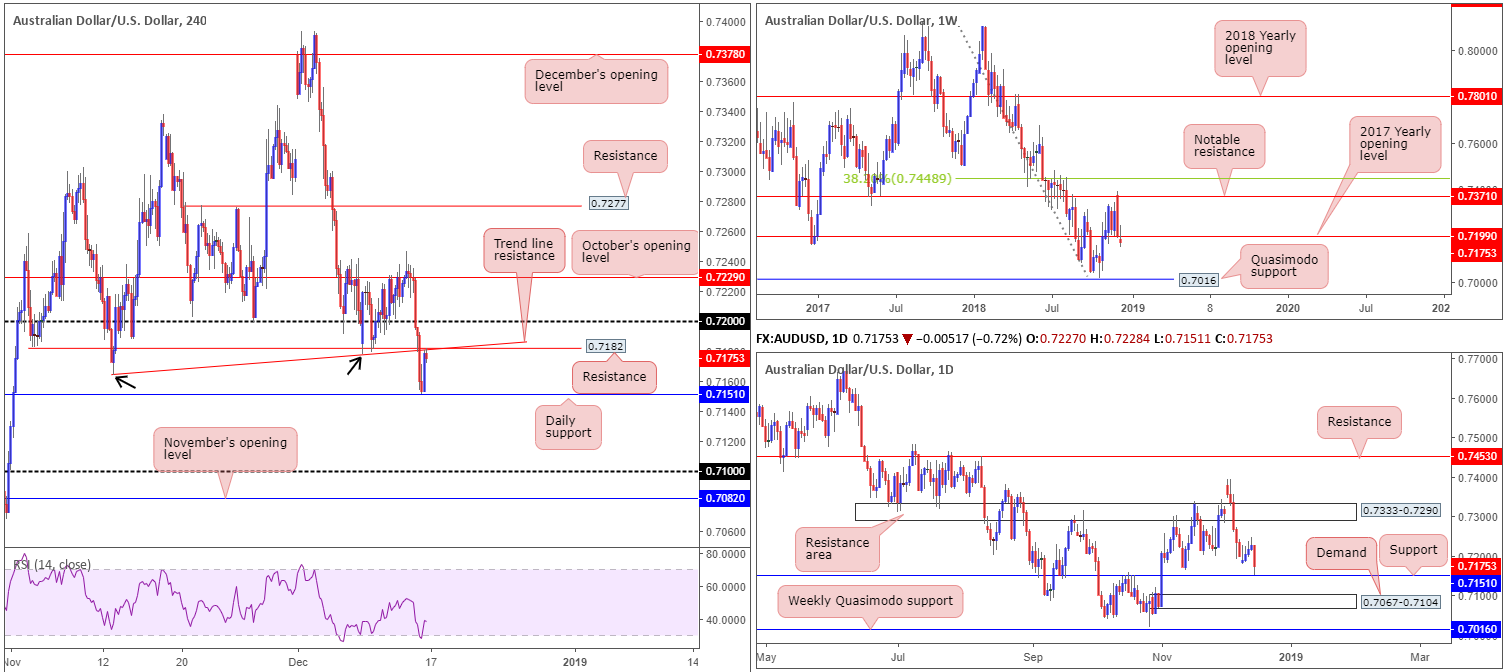
Despite an earnest effort to regain control of the 2017 yearly opening level at 0.7199 last week, upward momentum fizzled out around 0.7246ish and ended the week closing in the shape of a bearish pin-bar formation beneath 0.7199.
Candlestick enthusiasts will likely be drawn to this pattern this week, particularly given room is seen for the unit to trade as far south as a Quasimodo support priced in at 0.7016.
Daily perspective:
On closer examination, the research team notes daily price rebounded from support at 0.7151 Friday. Boasting reasonably attractive history, traders might want to consider the possibility of an advance taking shape from here towards a resistance area coming in at 0.7333-0.7290. In the event we do push for lower ground this week, however, as the weekly timeframe suggests, demand at 0.7067-0.7104 is in view.
H4 perspective:
Strong USD buying across the board, bolstered by relatively upbeat US retail sales data, weighed on the commodity currency Friday. Cleanly sweeping below 0.72 and support coming in at 0.7182, the pair landed around daily support mentioned above at 0.7151. From here, the market witnessed a mild end-of-day correction to retest the underside of 0.7182 as resistance. Note this level also merges nicely with a trend line support-turned resistance (taken from the low 0.7164).
Areas of consideration:
The retest of 0.7182 as resistance on the H4 timeframe is interesting. Not only because of its convergence with a H4 trend line, but also due to the fact weekly price suggests lower levels may be on the cards. The only caveat to this concept, of course, is the daily timeframe seen trading from support.
Should H4 price chalk up a notable bearish candlestick configuration off 0.7182 today (entry/stop parameters can be defined according to this pattern), this would potentially be sufficient enough to draw in sellers and overthrow daily support.
In the matter of take-profit targets from 0.7182, the top edge of daily demand at 0.7104 would be first in line, followed by the 0.71 handle on the H4 timeframe and then November’s opening level drawn from 0.7082. Traders are also urged to consider reducing risk to breakeven once/if H4 price closes under the current daily support.
Today’s data points: Limited.
USD/JPY:
Weekly Gain/Loss: +0.69%
Weekly Close: 113.37
Weekly perspective:
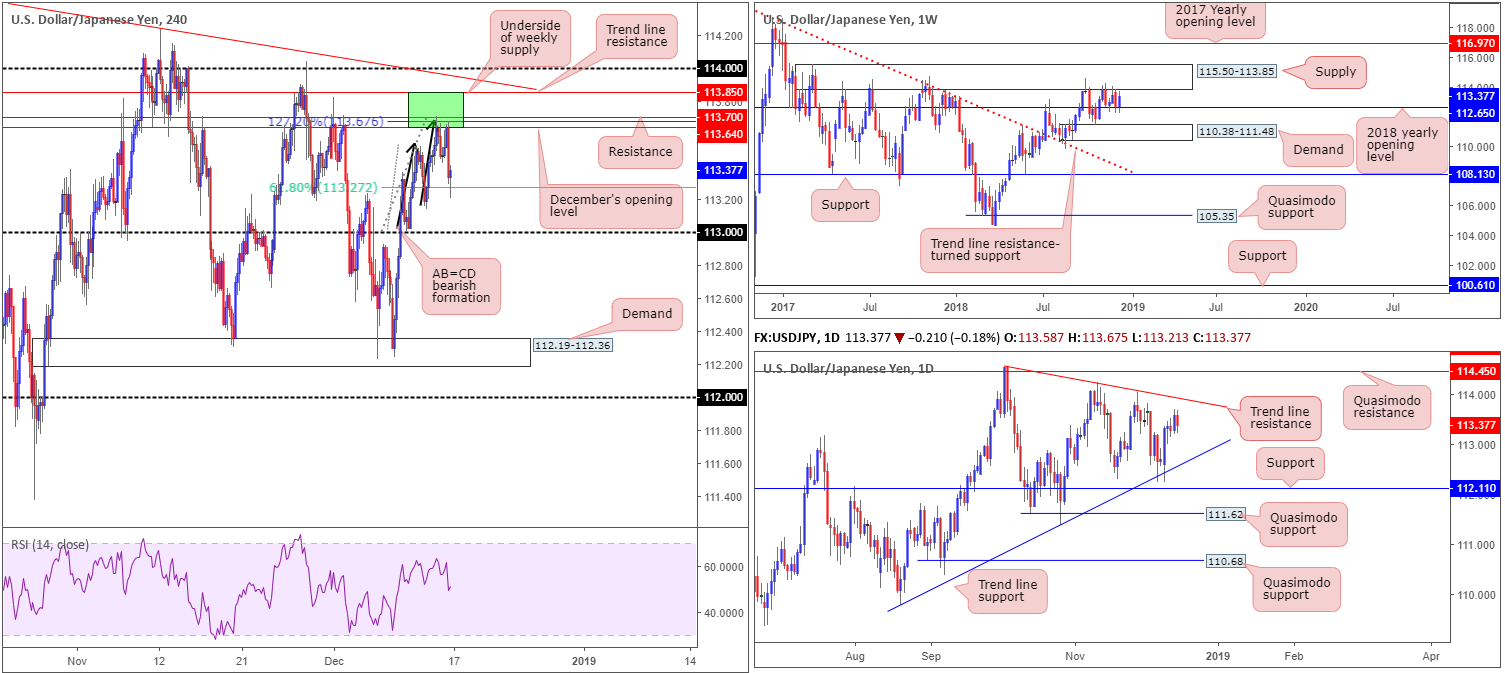
Since the beginning of November, the weekly candles have been capped between supply at 115.50-113.85 and the 2018 yearly opening level at 112.65. Beyond this level, demand coming in at 110.38-111.48 is on the radar, whereas a break above the current supply has the 2017 yearly opening level to target at 116.97.
Traders may also want to acknowledge the pair concluded last week’s trade within striking distance of the noted weekly supply.
Daily perspective:
Against the backdrop of weekly movement, daily flow remains compressed between two converging trend lines (109.77/114.55). Outside of this structure, Quasimodo resistance rests at 114.45 and support comes in at 112.11.
H4 perspective:
For folks who read Friday’s briefing you may recall the piece highlighted a rather interesting area of resistance at 113.85/113.64. Shaded in green, the zone consisted of the underside of a weekly supply at 113.85, a H4 resistance level at 113.70, December’s opening level at 113.64 and a H4 AB=CD (black arrows) 127.2% bearish completion at 113.67.
Well done to any of our readers who managed to take advantage of the move out of this area Friday, as price concluded the session testing the 61.8% Fibonacci support value at 113.27, derived from legs A-D of the H4 AB=CD pattern: the initial take-profit target.
Areas of consideration:
Those who sold 113.85/113.64 likely ended the week taking partial profits and reducing risk to breakeven. This leaves room for additional profits should the market decide to continue pressing south towards 113 this week. At the same time this approach guards against turning a winning trade into a losing trade as weekly price may still want to test the underside of its supply at 113.85, which happens to closely converge with the aforesaid daily trend line resistance.
Today’s data points: Limited.
USD/CAD:
Weekly Gain/Loss: +0.37%
Weekly Close: 1.3382
Weekly perspective:
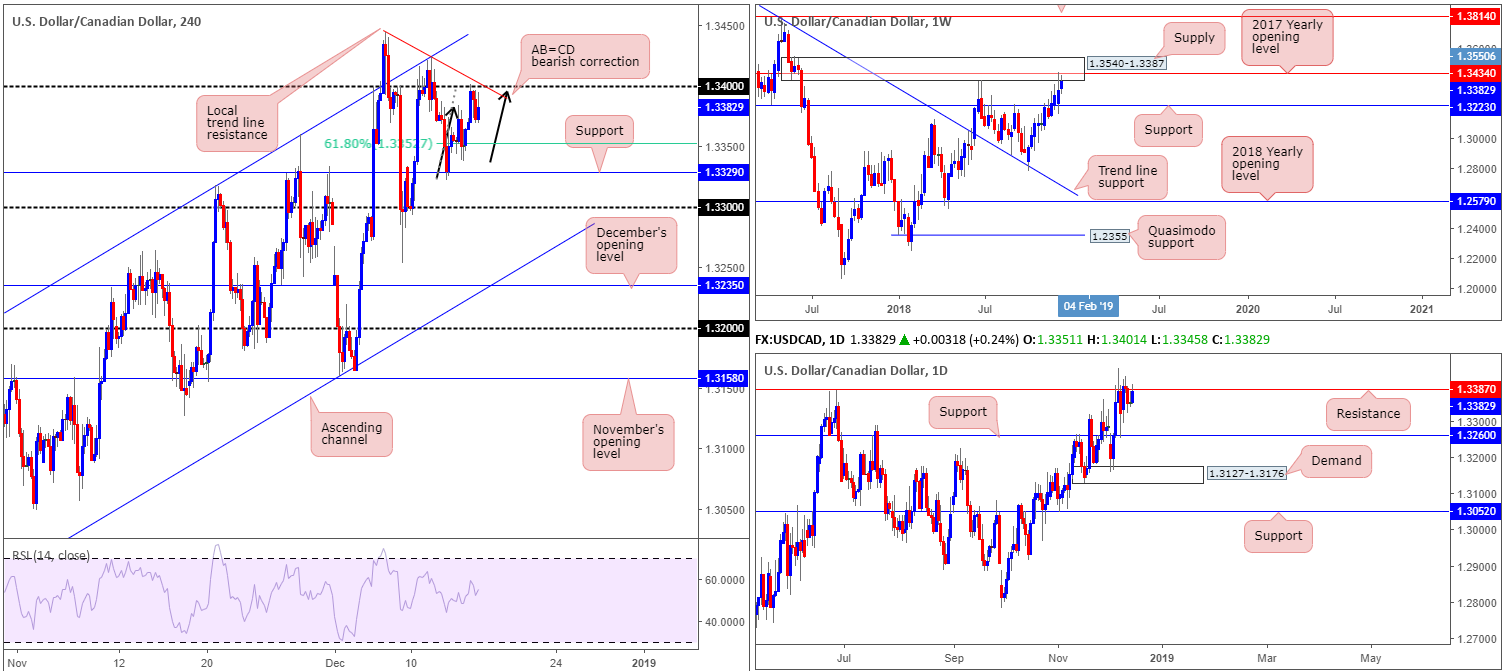
USD/CAD bulls remained on the offensive last week, though supply at 1.3540-1.3387 (houses the 2017 yearly opening level within at 1.3434) also remains in the fold. This, as you can probably see from the chart, is a notable supply zone that could eventually prove troublesome for buyers. A move lower from this point will likely target support coming in at 1.3223.
Daily perspective:
Similar to weekly structure, daily price is visibly capped between resistance coming in at 1.3387 (essentially represents the underside of weekly supply) and support drawn from 1.3260. A decisive push above the aforesaid resistance likely unlocks the door towards resistance priced in at 1.3533 (not seen on the screen), whereas a breach of the current support level has demand at 1.3127-1.3176 in sight.
H4 perspective:
A quick recap of Friday’s activity on the H4 timeframe reveals the candles shook hands with the underside of 1.34 in early London trade and turned lower. Closely supporting this number as resistance was a nearby local trend line resistance (etched from the high 1.3444) and a H4 AB=CD (black arrows) bearish pattern that completed five pips shy of 1.34.
Further selling today has the 61.8% Fibonacci support value at 1.3352 to target (derived from legs A-D of the AB=CD pattern), followed closely by support at 1.3329 and then the 1.33 handle.
Areas of consideration:
As we have weekly supply in play at 1.3540-1.3387, along with the 2017 yearly opening level at 1.3434 and a daily resistance at 1.3387, further selling from 1.34 on the H4 timeframe is a strong possibility today/early week.
A short at current price (1.3382) with a stop-loss order positioned around 1.3407, along with the first take-profit target set at the H4 61.8% Fibonacci support value at 1.3352, could be an option today. This setup offers in excess of 1:1 risk/reward to the first support target, and therefore, is certainly worthy of consideration. Beyond 1.3352, as highlighted above, we have H4 support at 1.3329 and then the 1.33 handle in view as additional downside targets.
Today’s data points: Limited.
USD/CHF:
Weekly Gain/Loss: +0.70%
Weekly Close: 0.9977
Weekly perspective:
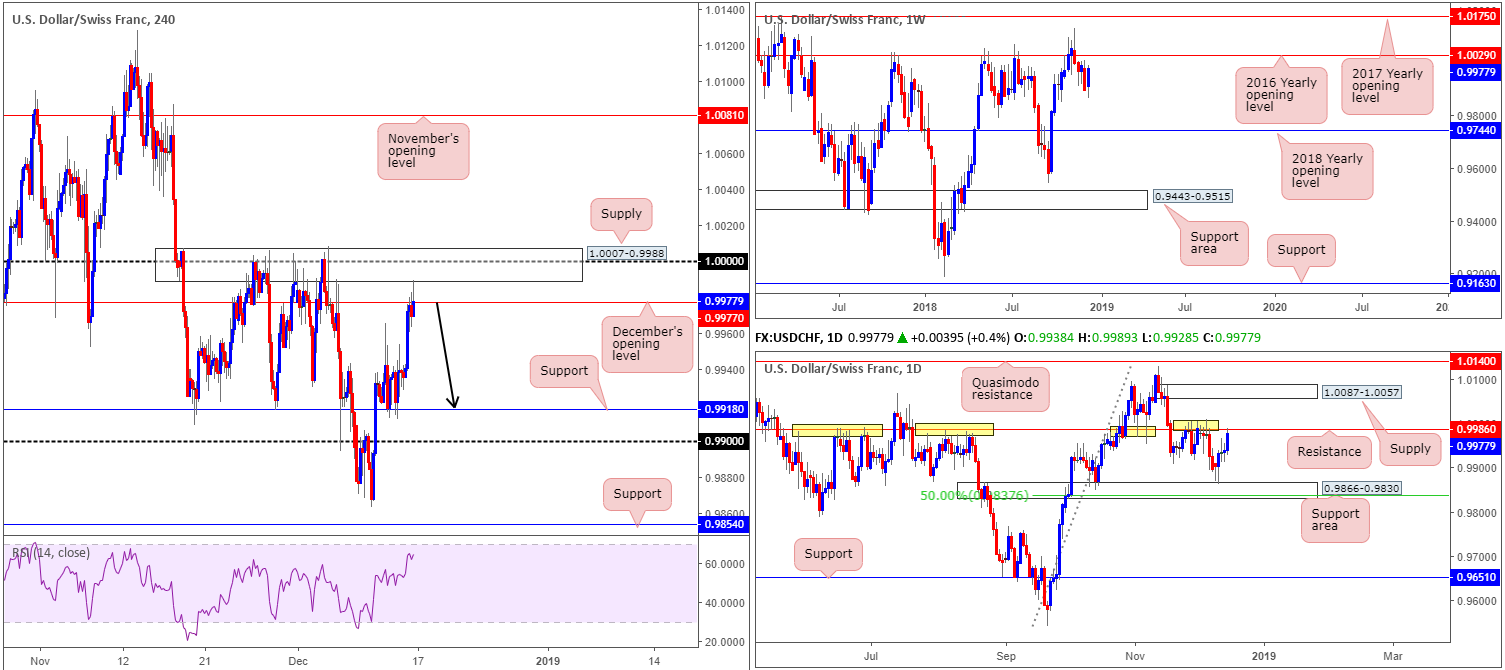
Over the course of last week, the USD/CHF staged a stronger-than-expected recovery off lows of 0.9863. Eroding all of the prior week’s losses, recent movement positioned the pair back within reasonably close proximity to the 2016 yearly opening level at 1.0029. Note from late 2017, this barrier has delivered a tough resistance.
Daily perspective:
Although further buying could be on the cards this week, according to weekly structure, daily resistance at 0.9986 entered the mix at the closing stages of the week. As you can see, this level (yellow) boasts incredibly strong historical significance.
In the event we reject 0.9986 this week, the support area priced in at 0.9866-0.9830 will likely enter the spotlight. Conversely, should the pair head for higher ground, supply at 1.0087-1.0057 will be back in view.
H4 perspective:
Friday’s Eurozone PMI figures revealed a significant slowdown in both the manufacturing and services sector, causing the EUR/USD to fall in early London hours, and in turn the USD/CHF to rise. Further buying materialized following relatively upbeat US retail sales data hitting the wires during early US trade, eventually lifting the H4 candles beyond December’s opening level at 0.9977 to supply coming in at 1.0007-0.9988. This area has withstood numerous bullish assaults over the past month and remains sturdy. This could have something to do with the area housing 1.0000 (parity) and being positioned two pips north of daily resistance mentioned above at 0.9986.
Areas of consideration:
Ultimately, the research team feels a move lower is likely in store today/early week. H4 price reacted firmly from supply at 1.0007-0.9988 in the later stages of last week and closed around December’s opening level at 0.9977, forming a relatively attractive selling wick. This – coupled with notable daily resistance in play at 0.9986 – indicates a selloff from current price is high probability.
Shorting from current price (0.9977) with stop-loss orders located above the H4 supply offers traders ample room to secure reasonable risk/reward to the first downside target on the H4: support at 0.9918.
Today’s data points: Limited.
Dow Jones Industrial Average:
Weekly Gain/Loss: -1.51%
Weekly Close: 24602
Weekly perspective:
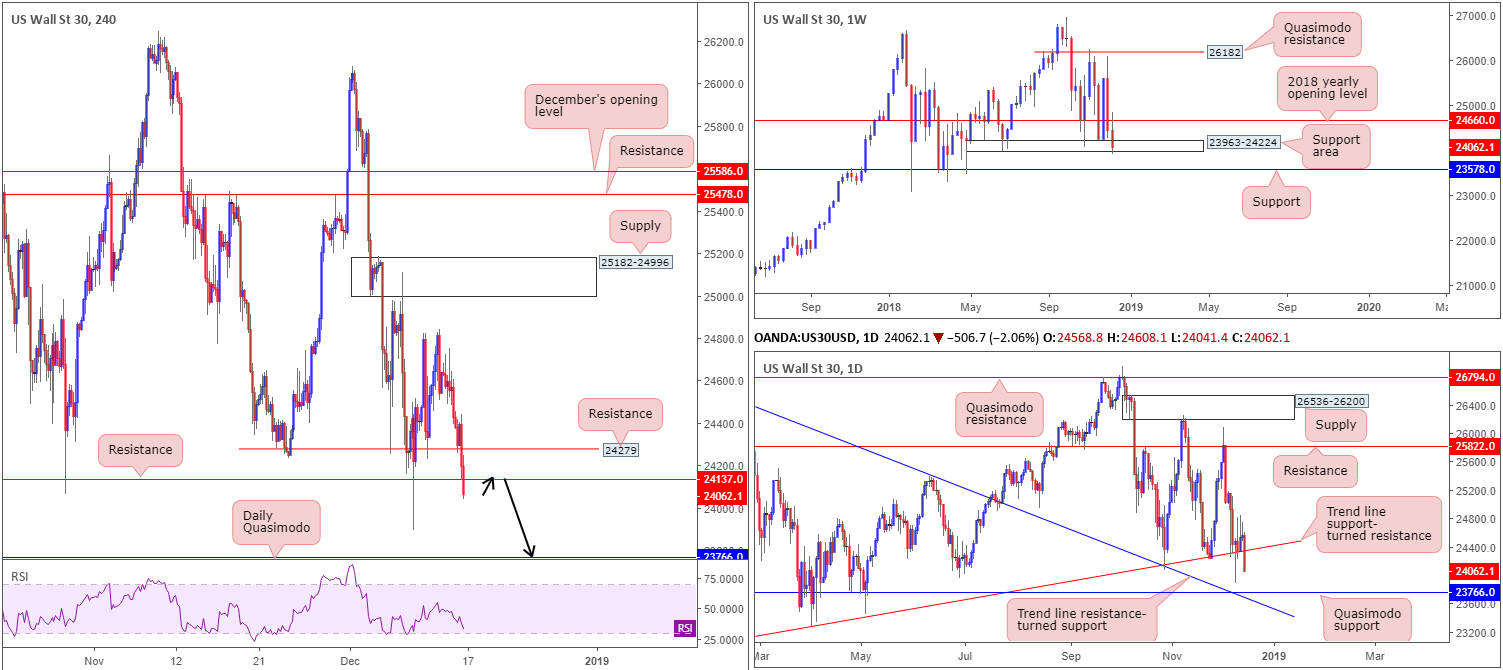
US equities sustained additional loss over the course of last week, despite an earnest attempt to reclaim control of the 2018 yearly opening level at 24660. Recording its second consecutive week in the red, the index concluded the week closing within the walls of a narrow support area coming in at 23963-24224. Given the strength behind the close, the current support area is likely fragile and could lead to a move south materializing this week towards support at 23578.
Daily perspective:
Recent selling, most prominent in Friday’s session shaped by a near-full-bodied bearish candle, has positioned price action just ahead of a Quasimodo support fixed at 23766 (taken from late April 2018). What’s appealing here is it fuses closely with a trend line resistance-turned support (extended from the high 26670).
H4 perspective:
The Dow Jones Industrial Average fell 506 points Friday, hitting its lowest level since early May, led lower by declines in Apple and Johnson & Johnson. The selloff was exacerbated after weaker-than-expected data in China and Europe aggravated concerns of a global economic slowdown.
H4 action crossed beneath support at 24279 and eventually reclaimed another layer of support drawn from 24137. The close beneath these two levels has, according to our technical studies, cleaned the pathway south towards the daily Quasimodo support mentioned above at 23766.
Areas of consideration:
With the exception of weekly price trading within a support area, albeit of a fragile presence, the market suggests further downside could be seen this week, at least until we reach the daily Quasimodo support level. A retest to the underside of 24137 on the H4 timeframe (black arrows) followed up with a H4 bearish candlestick structure (entry/stop parameters can be defined according to this pattern) would likely prompt a selloff towards 23766.
Today’s data points: Limited.
XAU/USD (Gold):
Weekly Gain/Loss: -0.80%
Weekly Close: 1238.1
Weekly perspective:
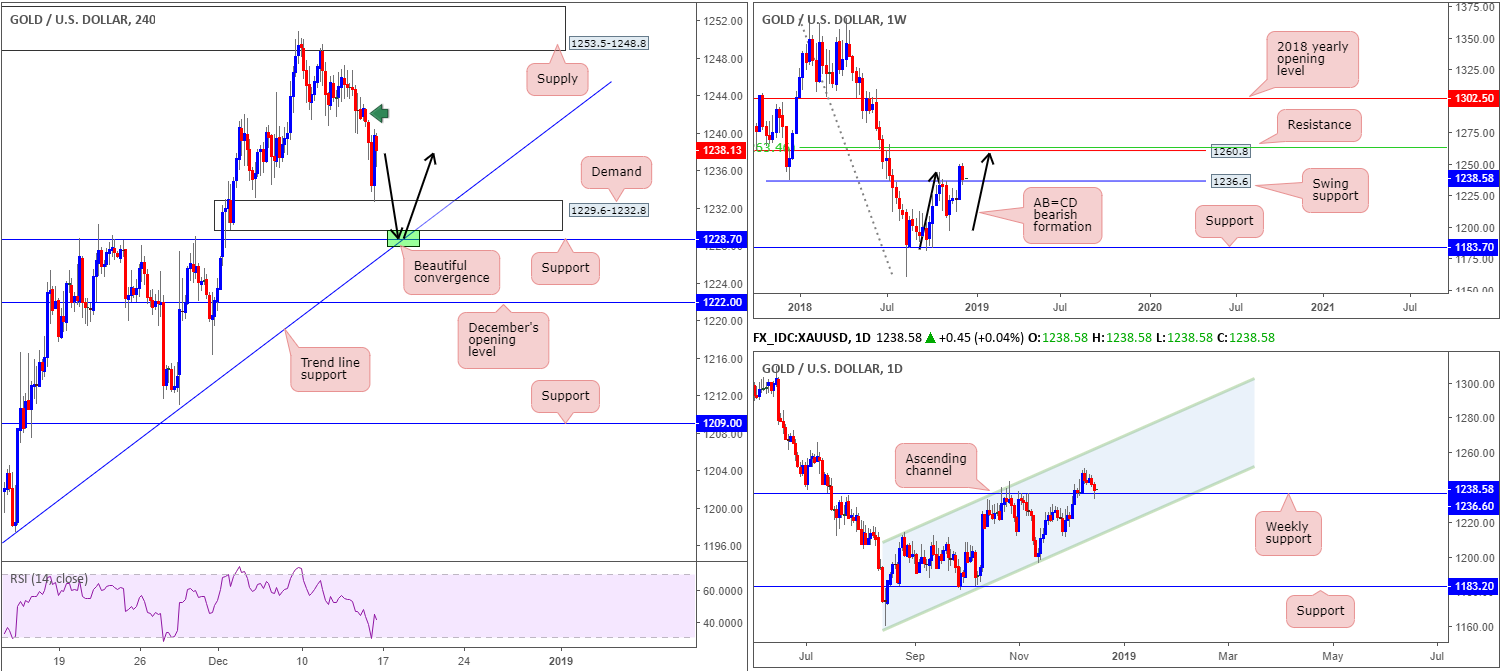
As the greenback discovered higher ground and firmly reclaimed 97.00+ status (US dollar index), the price of gold subsided last week. In consequence to this, weekly flow retested swing support priced in at 1236.6. Should price action find ground off of this level this week, resistance seen at 1260.8 is likely the next hurdle in view. What’s also interesting about this line from a technical perspective is it converges closely with an AB=CD bearish completion point (black arrows) and a 50.0% resistance value at 1263.4 (green).
Daily perspective:
In similar form to weekly structure, daily price is seen rebounding from the aforesaid weekly support level. The difference here is upside structure on this timeframe falls in at a channel resistance (etched from the high 1214.3).
H4 perspective:
A closer read on the H4 timeframe brings in demand at 1229.6-1232.8, which, as you can see, was tested to the pip Friday and held firm. Beneath this area it might also be worth pointing out potential resistance-turned support at 1228.7 that merges with a trend line support (extended from the low 1196.0). The point at which the two structures fuse together (green) is interesting for a possible long.
Overhead, the research team identifies supply at 1253.5-1248.8. Supply areas seen plotted south of this zone, apart from the area marked with a green arrow at 1243.0-1241.3, are likely consumed.
Areas of consideration:
As highlighted above, the point at which the H4 support at 1228.7 and noted H4 trend line support merge is interesting for a possible long this week. Stop-loss orders tucked beneath the current H4 demand area will be tripped and, therefore, likely draw in bigger players to drive price action higher given the available liquidity.
To avoid being whipsawed out of a trade on a fakeout from 1228.7, however, traders are urged to consider waiting for additional bullish candlestick confirmation to form prior to pulling the trigger (entry/stop parameters can be defined according to this pattern). The ultimate targets from 1228.7 falls in at the H4 supply mentioned above at 1253.5- 1248.8, followed then by weekly resistance plotted at 1260.8.
The use of the site is agreement that the site is for informational and educational purposes only and does not constitute advice in any form in the furtherance of any trade or trading decisions.
The accuracy, completeness and timeliness of the information contained on this site cannot be guaranteed. IC Markets does not warranty, guarantee or make any representations, or assume any liability with regard to financial results based on the use of the information in the site.
News, views, opinions, recommendations and other information obtained from sources outside of www.icmarkets.com.au, used in this site are believed to be reliable, but we cannot guarantee their accuracy or completeness. All such information is subject to change at any time without notice. IC Markets assumes no responsibility for the content of any linked site. The fact that such links may exist does not indicate approval or endorsement of any material contained on any linked site.
IC Markets is not liable for any harm caused by the transmission, through accessing the services or information on this site, of a computer virus, or other computer code or programming device that might be used to access, delete, damage, disable, disrupt or otherwise impede in any manner, the operation of the site or of any user’s software, hardware, data or property.


