
Key risk events today:
Limited.
(Previous analysis as well as outside sources – italics).
EUR/USD:
Weekly gain/loss: +0.49%
Weekly close: 1.1840
Weekly perspective:
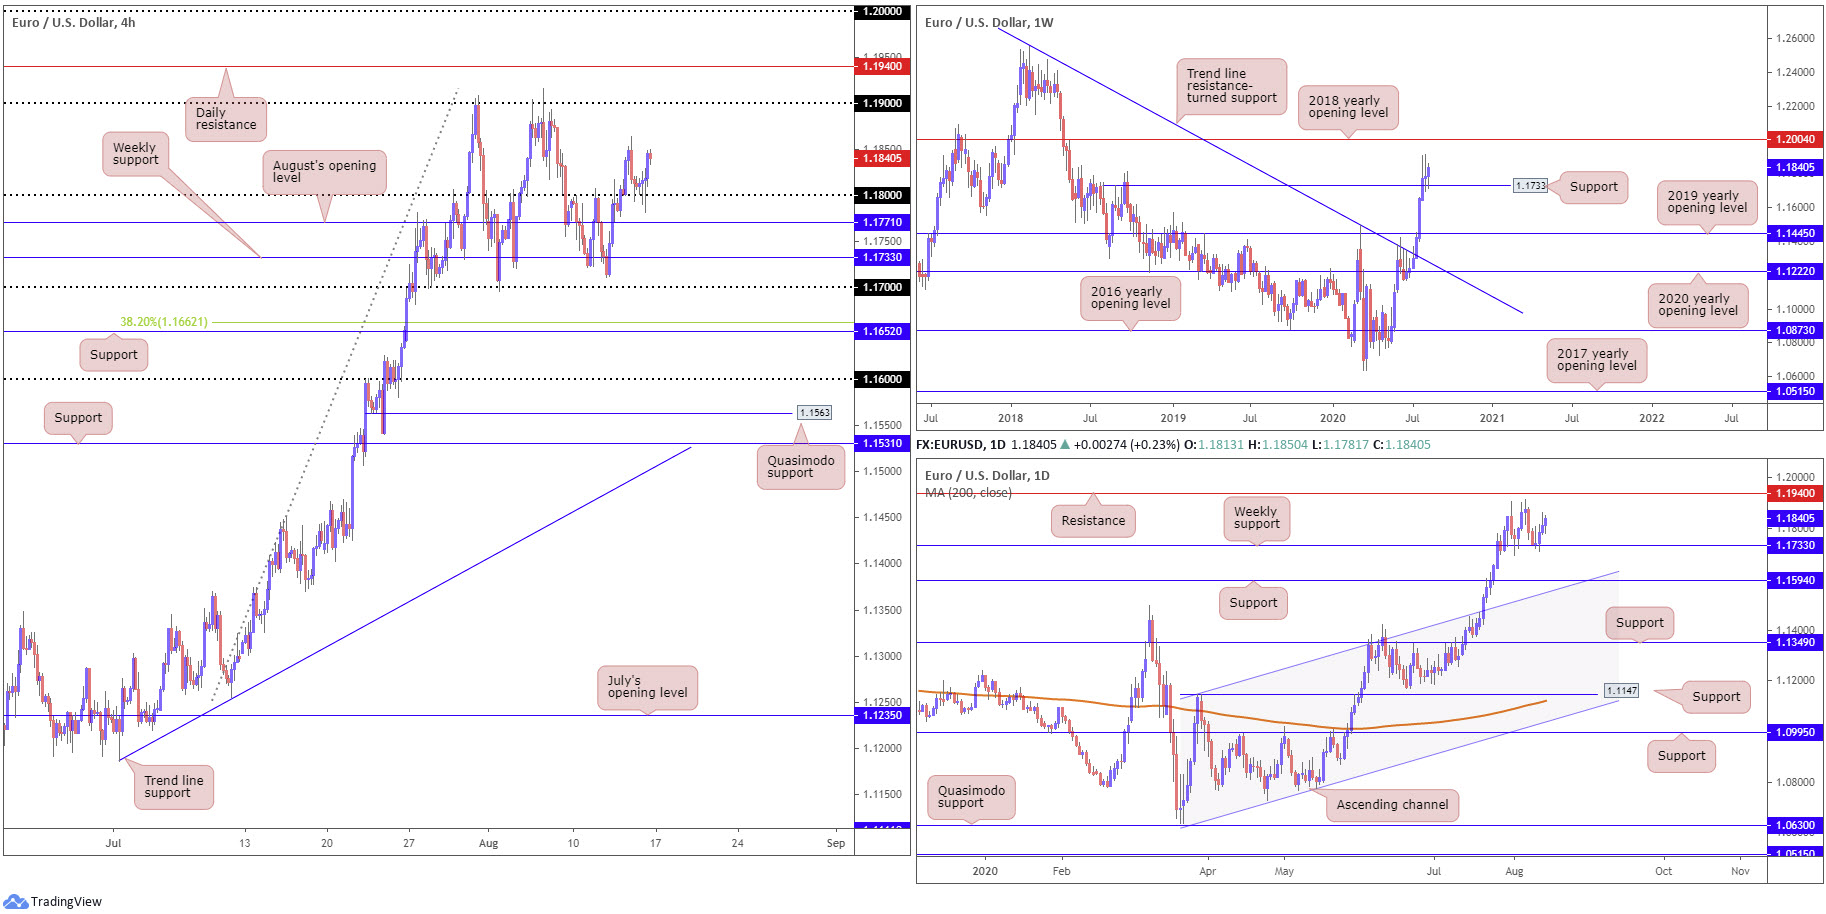
Persistent USD weakness kept Europe’s single currency on the winning side of the table last week, marking an 8th consecutive weekly gain. Although price failed to chalk up fresh peaks, support at 1.1733, a prior Quasimodo resistance level, established a firm presence.
Recent movement, alongside mid-July engulfing trend line resistance, taken from the high 1.2555, positions buyers in a healthy position heading into the new week. The 2018 yearly opening level at 1.2004 is seen as the next available resistance on the weekly timeframe.
Daily perspective:
Since closing out July, EUR/USD has clearly entered into a phase of consolidation, braced by the current weekly support level.
Mid-week trade threw across a daily outside bullish reversal off the noted weekly support, a move welcomed by buyers. Resistance on the daily chart is parked at 1.1940, with a break largely exposing weekly resistance mentioned above at 1.2004 (2018 yearly opening level).
Beyond 1.1733 (on the daily chart) could draw attention to daily support at 1.1594, a level connected closely with channel resistance-turned support, taken from the high 1.1147.
H4 perspective:
For those who read recent analysis on EUR/USD you may recall weekly support at 1.1733 served as a major floor last week, providing buyers a stable platform to initiate bullish strategies. Price made its way through 1.18 and reached peaks north of 1.1850 on Thursday. Friday, however, observed a retreat to 1.18 (and subsequent recovery), which was a noted bullish scenario to keep a tab on.
Those already long from 1.1733, as well as those long the breakout above 1.18, may have viewed the 1.18 retest as a location to pyramid long positions. Additionally, the 1.18 retest likely encouraged fresh buyers into the market. The 1.19 handle on the H4, daily resistance at 1.1940 and possibly weekly resistance at 1.2004 represent key resistances this week.
Areas of consideration:
Traders long from either 1.1733, the 1.18 breakout or the retest of 1.18 will likely be watching 1.19 as an initial target this week.
Subject to 1.1850 resistance, however, an additional retest at 1.18 is also possible. One cautionary point to be aware of (for those considering longs off 1.18 in the event of a retest) around the psychological number is the prospect of a fakeout into August’s opening level at 1.1771 (H4). A H4 close back above 1.18, off 1.1771, will likely be interpreted as a bullish signal.
GBP/USD:
Weekly gain/loss: +0.23%
Weekly close: 1.3078
Weekly perspective:
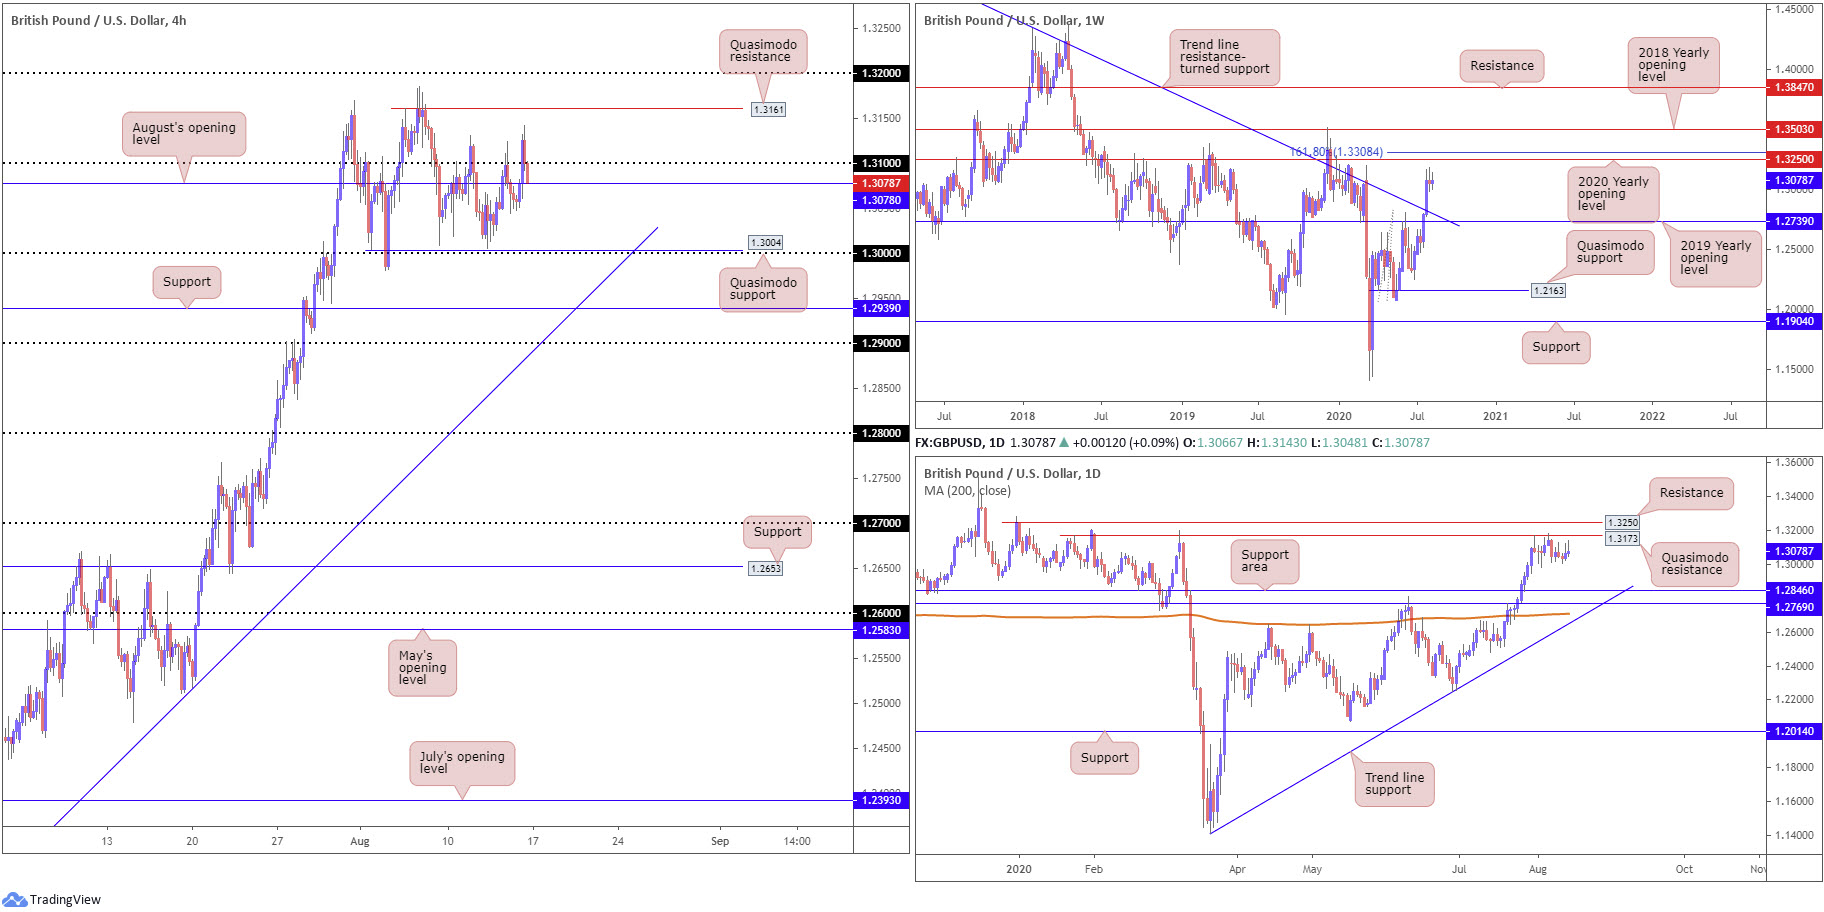
The July 27 trend line resistance (1.5930) break may eventually stir long-term bullish themes.
Fresh resistance is seen by way of the 2020 yearly opening level at 1.3250, closely stalked by a 161.8% Fibonacci extension point at 1.3308.
Leaving said resistances unchallenged and retreating south this week could call for a retest of the 2019 yearly opening level drawn from 1.2739 (dovetails closely with the recently broken trend line).
Daily perspective:
Quasimodo resistance at 1.3173 elbowed its way into the spotlight as July came to an end, and remains prominent structure on the daily timeframe. Interestingly, the level is located just south of 1.3250 resistance, a barrier sharing the same space with resistance on the weekly timeframe, the 2020 yearly opening level.
An extension to the downside this week rolls a support area between 1.2769/1.2846 into focus, positioned ahead of the 200-day SMA (orange – 1.2709) and trend line support, taken from the low 1.1409.
H4 perspective:
Demand for the pound elevated H4 flow above August’s opening level at 1.3078 and the 1.31 handle Friday, reaching peaks at 1.3143. While a mild end-of-session pullback has swerved 1.3078/1.31 back into range, prudent traders will acknowledge Quasimodo resistance at 1.3161 may enter the fight this week, with a break uncovering daily Quasimodo resistance at 1.3173 and then the 1.32 handle.
Dipping sub 1.3078 shifts technical focus to the 1.30 key figure, a widely watched level that converges with Quasimodo support from 1.3004.
Areas of consideration:
The weekly chart does not seem to be throwing up any red flags in terms of resistance until 1.3250, while daily activity pencils in clear resistance around 1.3173. This alone, given the space to move higher, may persuade bulls to extend upside north of 1.31 this week, initially targeting H4 Quasimodo resistance at 1.3161.
However, before buyers step in, another potential scenario to consider this week is a retracement to the 1.30 region to collect fresh bids. A H4 bullish candlestick formed off the round number may be sufficient to encourage conservative buyers to pull the trigger.
AUD/USD:
Weekly gain/loss: +0.18%
Weekly close: 0.7170
Weekly perspective:
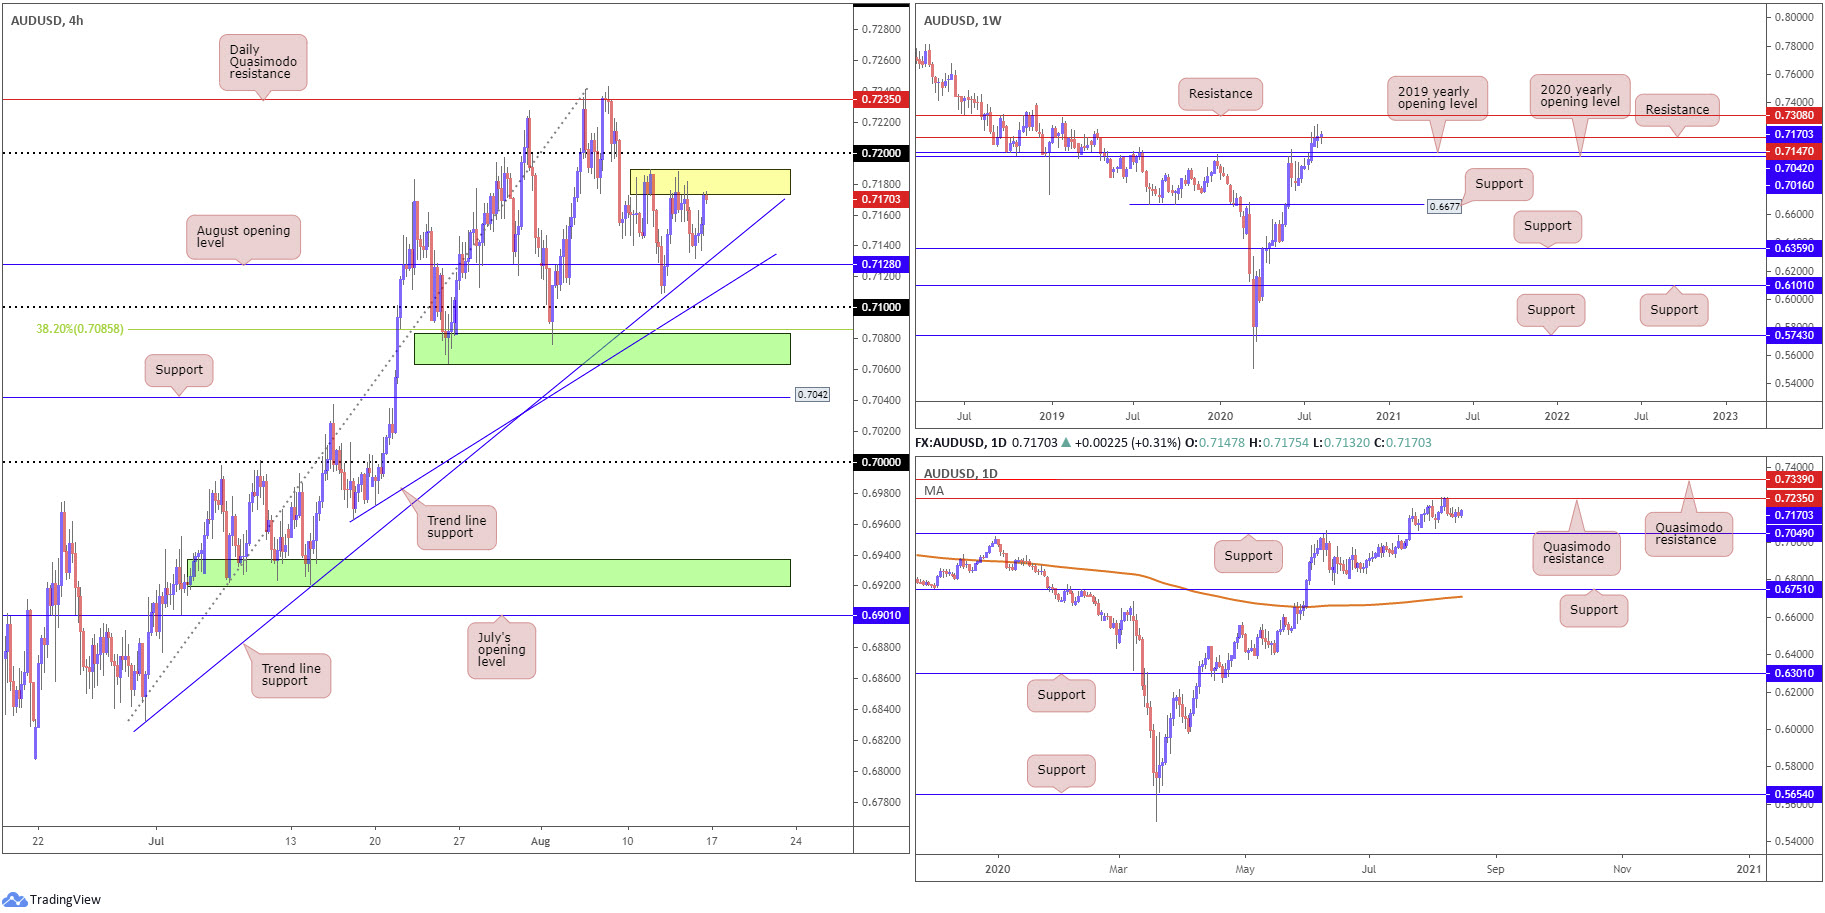
Buyers and sellers continue to battle for position around resistance at 0.7147, with both sides offering a non-committal tone last week.
The lack of buying underscores a possible retreat to the 2020 and 2019 yearly opening levels at 0.7016 and 0.7042, respectively. Conversely, should 0.7147 snap, resistance at 0.7308 is likely to make an appearance this week.
Daily perspective:
Technical structure, based on the daily timeframe, recently dropped Quasimodo resistance at 0.7235 in play, firmly capping upside on August 7. While potentially enough to catch the attention of lower timeframe sellers, the immediate trend has faced north since bottoming mid-March, which could explain the lack of follow-through selling this week.
Support can be seen at 0.7049 this week, though prudent traders, given the current trend, will also acknowledge the likelihood of eventually reaching higher and perhaps crossing swords with Quasimodo resistance at 0.7339.
H4 perspective:
Renewed selling pressure surrounding the USD Friday boosted AUD/USD amid US hours. Leaving August’s opening level at 0.7128 unchallenged (and connecting trend line support, extended from the low 0.6832), price went on and shook hands with a mild resistance area around 0.7189-0.7172 (yellow), arranged just south of the 0.72 handle.
Above 0.72, daily Quasimodo resistance lies in wait at 0.7235.
Beneath August’s opening level, traders face trend line support, taken from the low 0.6963, followed by the 0.71 handle.
Areas of consideration:
Buyers appear to have the upper hand on the higher timeframes, largely thanks to the underlying trend, yet a dip to daily support at 0.7049 could still arise this week.
Another noteworthy setup to watch for in early trade is a potential fakeout through the H4 resistance area around 0.7189-0.7172, moves that will likely fill buy-stop liquidity and claw in fresh intraday sellers from 0.72. Still, before committing to a bearish strategy off 0.72, traders are urged to consider that a whipsaw above the round number could also come about. Waiting for additional confirmation to form, therefore, could be an option here.
A H4 close above 0.72, in line with the current uptrend, nonetheless, could also come to pass, igniting intraday breakout strategies towards daily Quasimodo resistance at 0.7235.
USD/JPY:
Weekly gain/loss: +0.60%
Weekly close: 106.54
Weekly perspective:
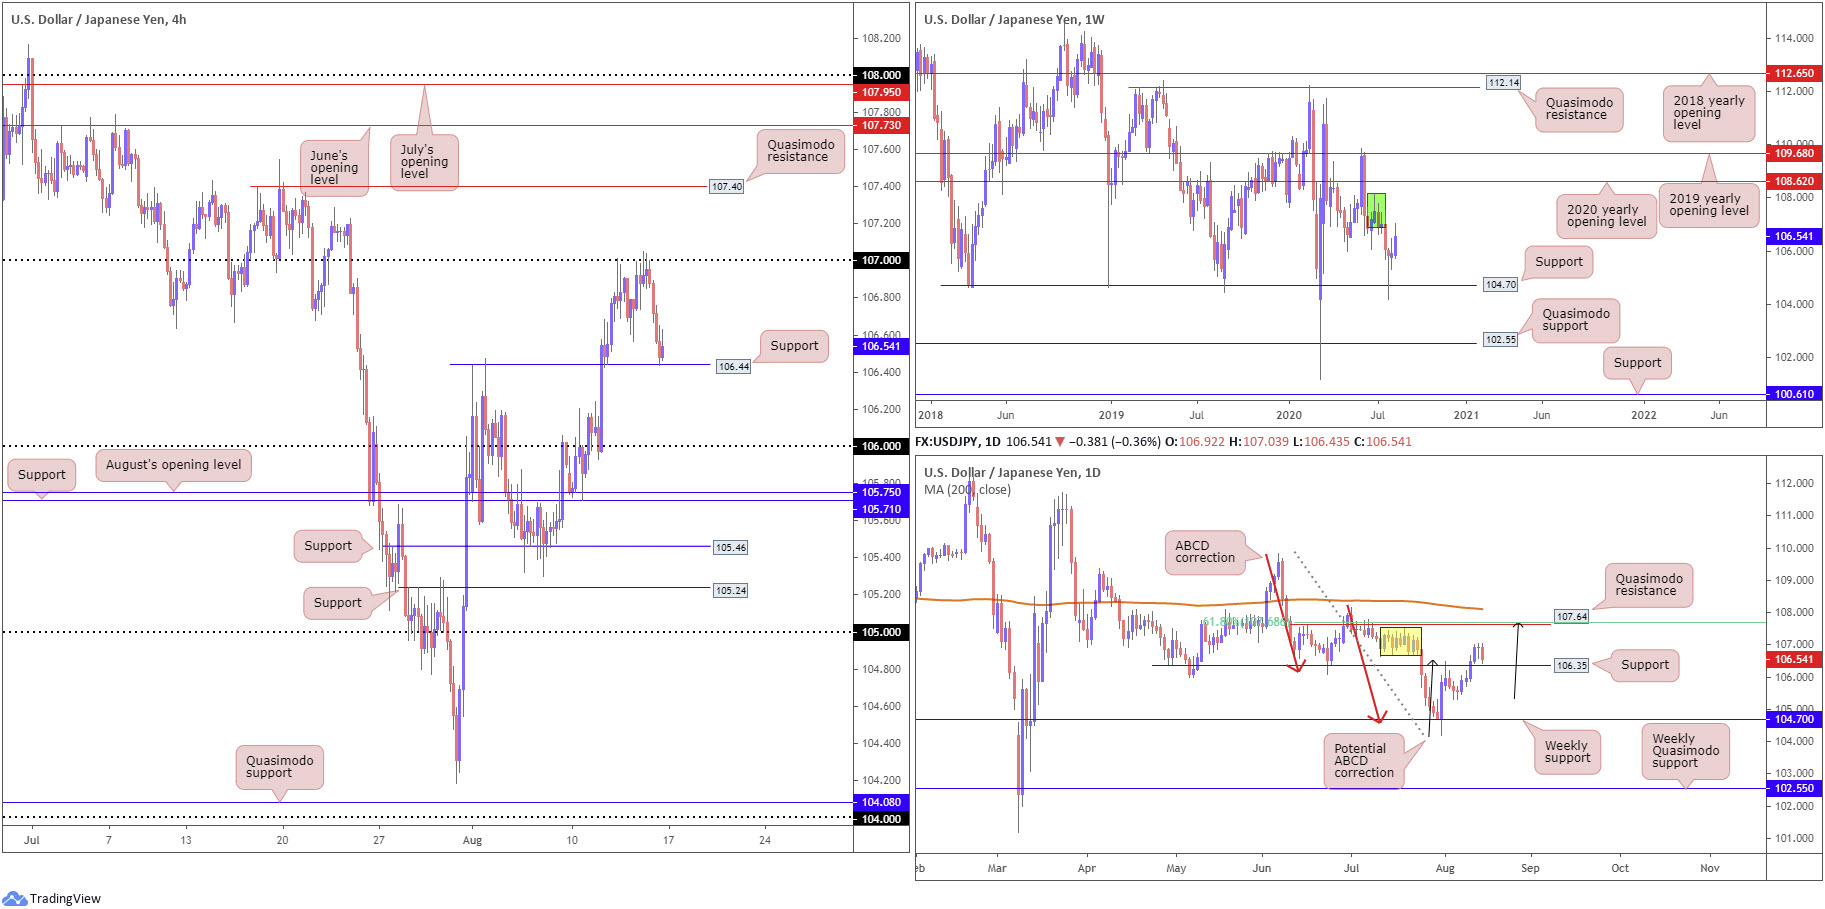
Longer-term traders finally responded to the recent hammer pattern on the weekly timeframe, established off support at 104.70. By and of itself, this is a strong bullish signal, with obvious upside targets resting as far north as the 2020 yearly opening level from 108.62 and the 2019 yearly opening level at 109.68.
Yet, before reaching 109.68/108.62, supply at 106.88-108.16 (green) may perhaps hinder upside attempts this week.
Daily perspective:
Decisively snapping a five-day bullish phase Friday, price is poised to revive 106.35 as support this week. Successfully holding off the latter positions the unit to perhaps take on supply at 107.54-106.67 (yellow), as well as Quasimodo resistance coming in at 107.64 and a nearby 61.8% Fibonacci retracement at 107.68 (considered a second take-profit target from the recently completed bullish ABCD pattern (red arrows) from 109.85. Also worth acknowledging is the prospect of establishing an ABCD bearish correction (black arrows), conveniently terminating around 107.64.
H4 perspective:
Fading 107 in the early hours of Friday declared a bearish tone, with Asia and Europe following through to the downside. US action, as you can see though, fought back, staging a mild recovery off support at 106.44, a prior Quasimodo resistance level.
A fakeout beyond 106.44 is certainly plausible this week, owing to daily support residing at 106.35. While dropping through 106.35 shines the spotlight on 106 and August’s opening level at 105.75 as feasible targets.
Areas of consideration:
The combination of daily support at 106.35 (along with room seen to move higher on the daily timeframe to resistance at 107.64) and H4 support at 106.44 is likely to appeal to buyers this week, with 107 resting as an initial resistance target.
Brushing aside daily support leaves little room for manoeuvre, as 106 could hamper downside.
USD/CAD:
Weekly gain/loss: -0.85%
Weekly close: 1.3263
Weekly perspective:
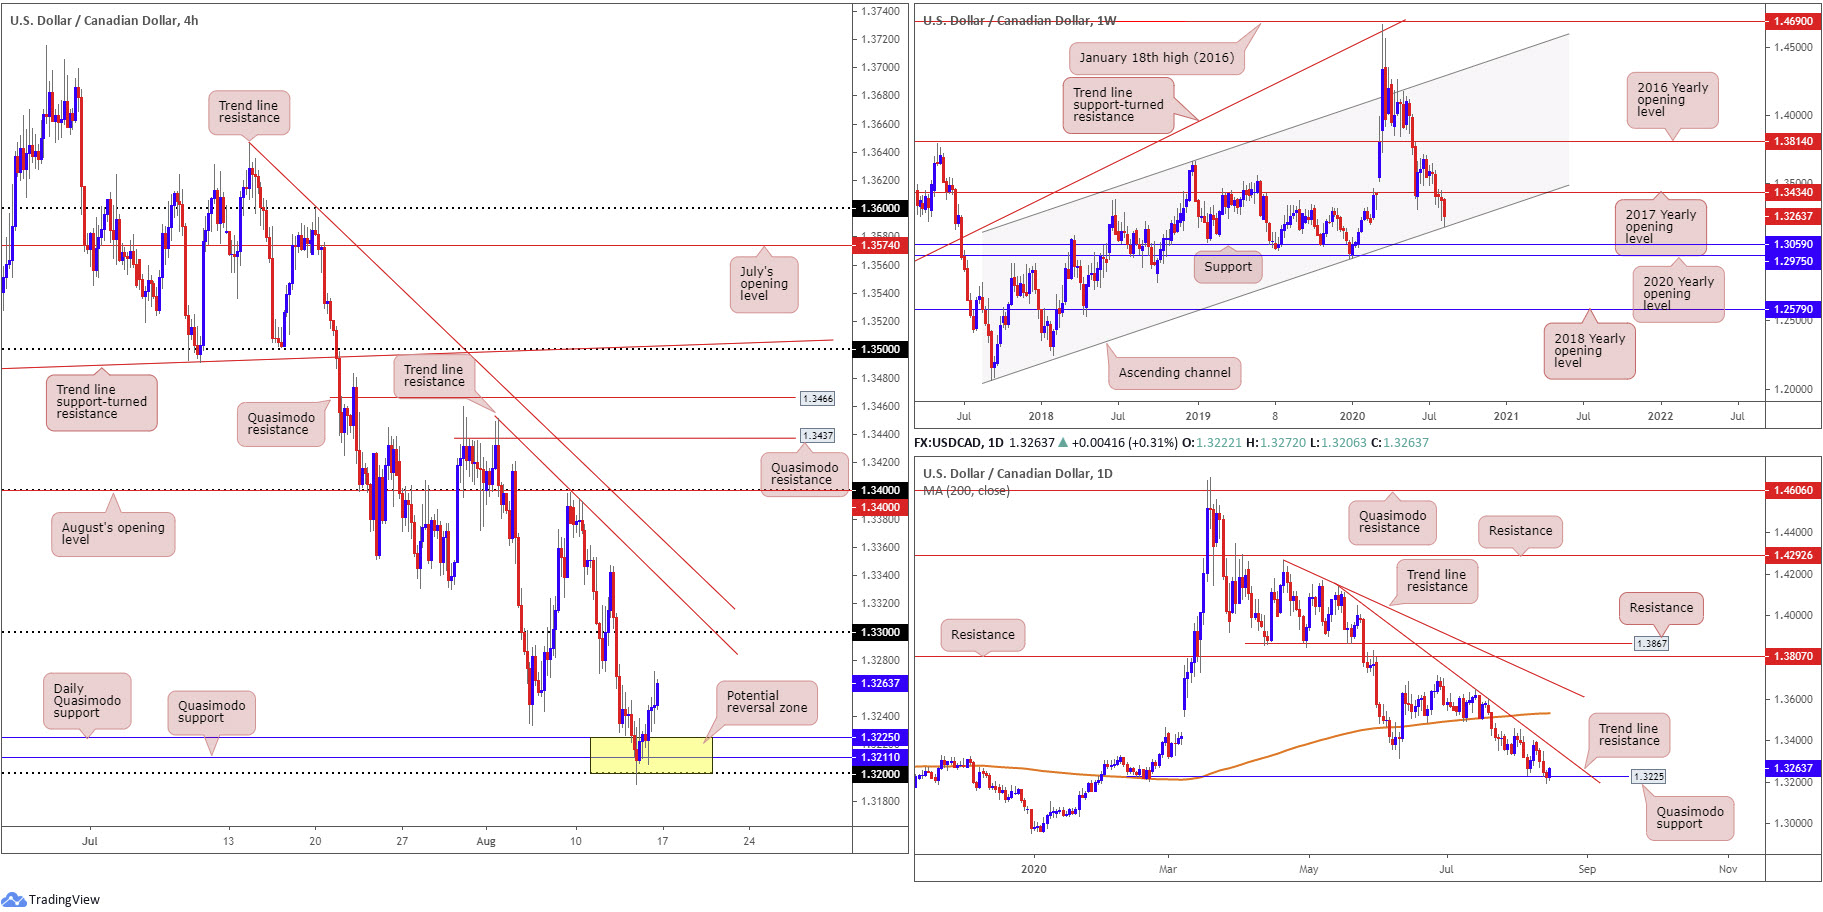
While the immediate downtrend clearly remains in force, channel support, extended from the low 1.2061, recently arrived after forming a fifth consecutive weekly loss. A recovery from here swings the 2017 yearly opening level at 1.3434 back into view as viable resistance, whereas splitting the channel formation this week moves support at 1.3059 in sight as a possible downside target.
Daily perspective:
Quasimodo support at 1.3225, a level dovetailing closely with weekly channel support, made its way into the fight in the second half of the week.
As evident from the chart, buyers regained consciousness off the aforementioned Quasimodo formation Friday and snapped a four-day bearish phase. Trend line resistance, etched from the high 1.4140, stands as a logical upside target this week.
H4 perspective:
For traders who read Friday’s technical briefing you may recall the following (italics):
As can be seen on the H4 chart, price nosedived into 1.32/1.3225 (yellow – made up of the 1.32 handle on the H4, H4 Quasimodo support at 1.3211, daily Quasimodo support at 1.3225 and weekly channel support) Thursday. Buyers, albeit after mildly surpassing 1.32 to lows at 1.3192, have made an appearance, though we may not see any additional upside until European trading.
Price, as expected, warmed to 1.32/1.3225 heading into European hours Friday and clocked highs at 1.3272.
Areas of consideration:
Traders who managed to secure a bullish position within 1.32/1.3225 are likely eyeballing 1.33 in early trade this week as an initial target. Considering the higher timeframe support involved out of 1.32/1.3225, advancing beyond 1.33 is also workable this week, listing two H4 trend line resistances, extended from highs 1.3646 and 1.3451, into the realm of possibility.
USD/CHF:
Weekly gain/loss: -0.41%
Weekly close: 0.9085
Weekly perspective:
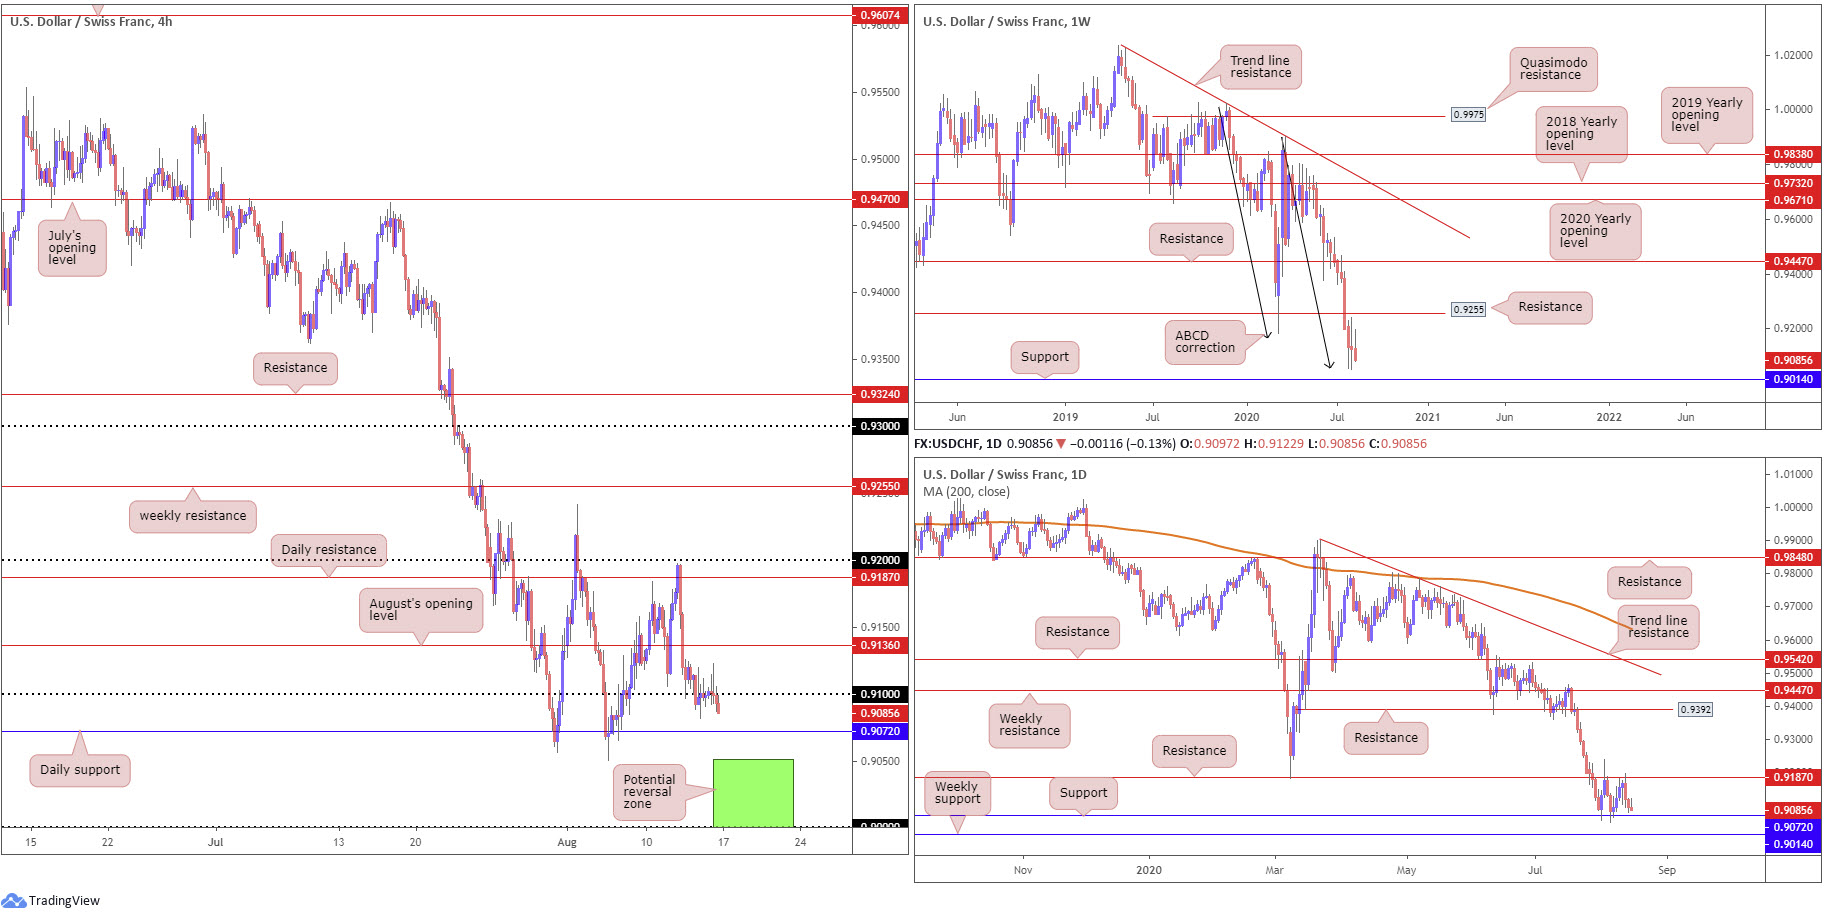
Price action, as you can see, is coming off an eight-week decline, fading weekly peaks at 0.9197. Yet, structurally, candle action tests an ABCD completion point (black arrows) around 0.9051. This, along with additional support at 0.9014, may eventually observe a recovery surface, targeting 0.9255, a Quasimodo support-turned resistance level.
Daily perspective:
In light of resistance at 0.9187 capping upside on two occasions in recent trading, as well as support at 0.9072 also entering the frame twice recently, the levels have formed a clear-cut range to work with this week.
Weekly support rests under the newly establish consolidation at 0.9014, while beyond resistance we can see daily resistance falls in at 0.9392, plotted above weekly resistance at 0.9255.
H4 perspective:
Finishing Friday’s session considerably off best levels, intraday candle action failed to maintain a presence above 0.91, despite tipping peaks around 0.9122 mid-way through London. According to H4 flow, we are likely headed for daily support at 0.9072 this week, while a break here may send things towards the key figure 0.90, which is joined closely with weekly support at 0.9014.
Areas of consideration:
With 0.91 out of the picture as support, attention shifts to daily support underlined above at 0.9072 as a potential reversal zone early week. Conservative buyers off 0.9072 may seek a H4 close above 0.91 before pulling the trigger, ultimately targeting August’s opening level at 0.9136 (H4) and daily resistance at 0.9187.
In the event sellers remain in the driving seat, and 0.9072 fails to hold, the ABCD completion point around 0.9051 on the weekly timeframe is next in line. It will only be after this base is engulfed will price look to approach the key figure 0.90 (H4) and converging weekly support at 0.9014. On account of this, between 0.90/0.9051 (green – H4), assuming daily support at 0.9072 gives in, could be an area to watch for buyers to make a show this week, either looking to fade the current downtrend or cover short positions.
Dow Jones Industrial Average:
Weekly gain/loss: +1.59%
Weekly close: 27885
Weekly perspective:
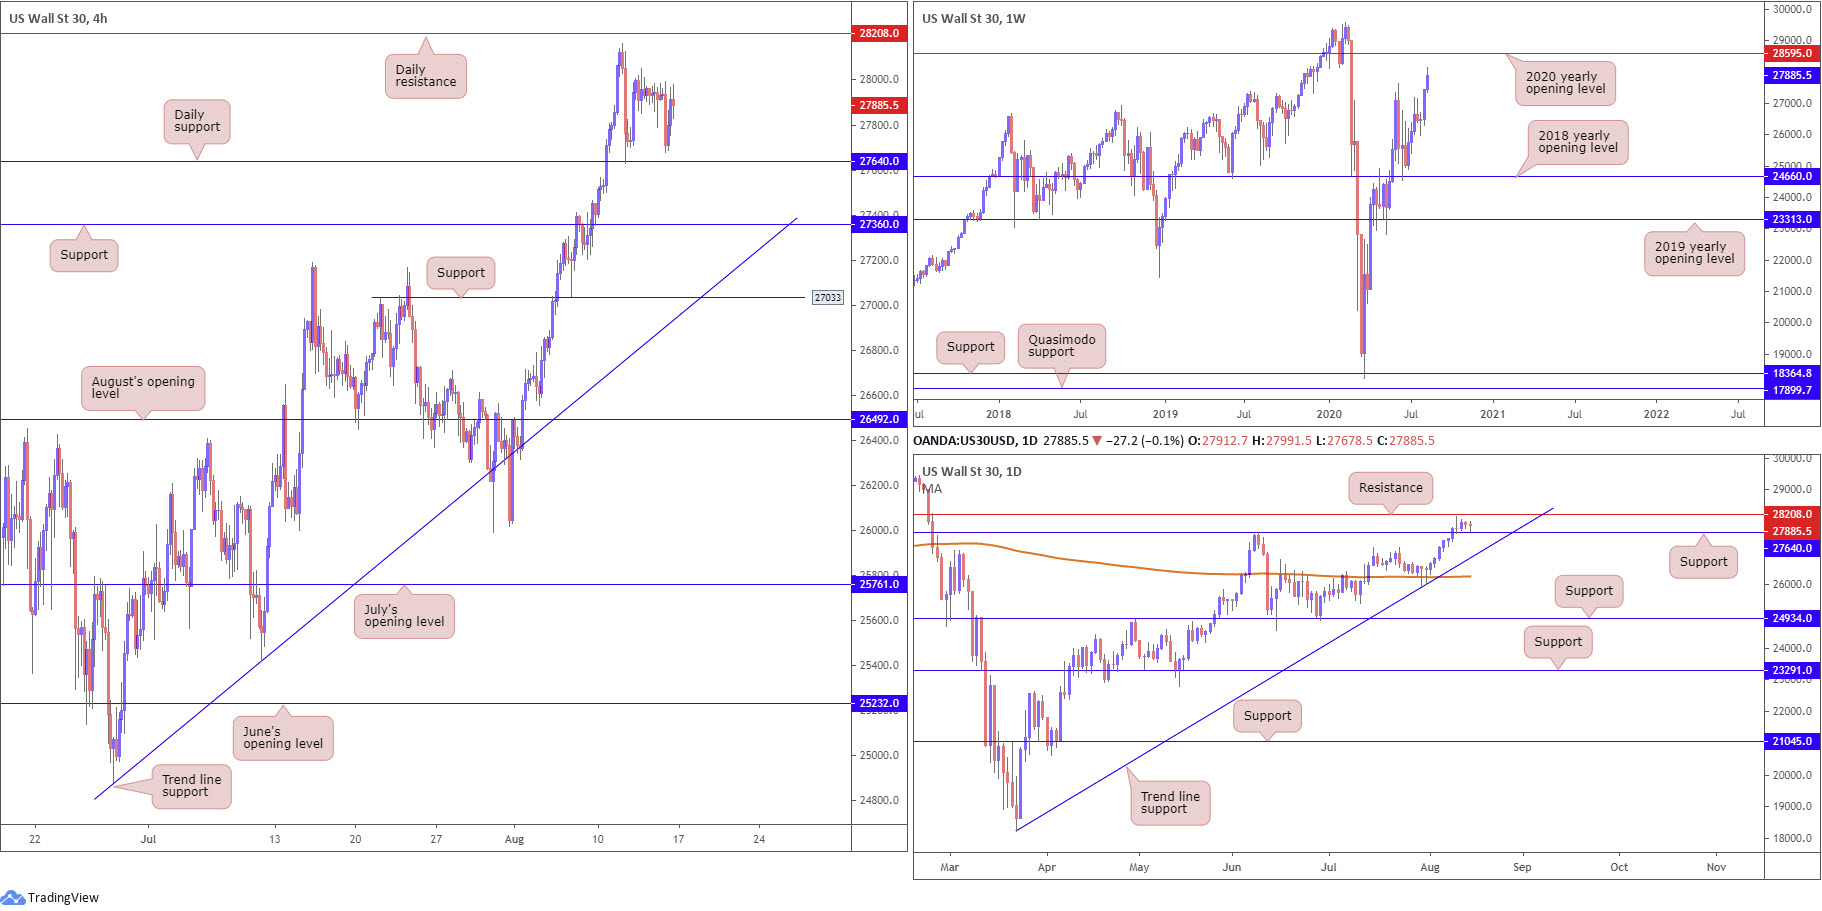
US equities traded with a reasonably strong upside bias last week, extending the prior week’s 3.5% advance and overthrowing the 27638 high.
Although a 27638 retest could develop this week, the unit is poised to make a run for the 2020 yearly opening level at 28595.
Daily perspective:
A closer examination of price action on the daily timeframe reveals resistance is seen at 28208, with support placed at 27640. Breaking resistance could have action make its way towards the 2020 yearly opening level on the weekly timeframe at 28595, while tunnelling through support has trend line support, extended from the low 18213, to contend with.
H4 perspective:
Major US equity benchmarks finished mixed Friday, following a lower-than-expected rise in retail sales, data that places a question mark on an economic recovery. The Dow Jones Industrial Average added 34.30 points, or 0.12%; the S&P 500 concluded flat, while the tech-heavy Nasdaq 100 traded lower by 13.92 points, or 0.12%.
Activity on the H4 timeframe established position off daily support at 27640 Wednesday and closed a touch off session peaks. Following this, candle action remained pretty much stationary into the week’s close, albeit spiking to a low at 27678 Friday.
Areas of consideration:
An additional test of daily support at 27640 may form this week, perhaps drawing out dip-buying strategies. Failure to hold, nevertheless, brings light to H4 support at 27360.
Traders who managed to secure a long entry from daily support at 27640 (a noted move to watch for in recent reports) Wednesday will likely have daily resistance at 28208 marked as a valid take-profit target, with a break, as highlighted above, likely pushing for weekly resistance at 28595, the 2020 yearly opening level.
XAU/USD (GOLD):
Weekly gain/loss: -4.45%
Weekly close: $1,944.71
Weekly perspective:
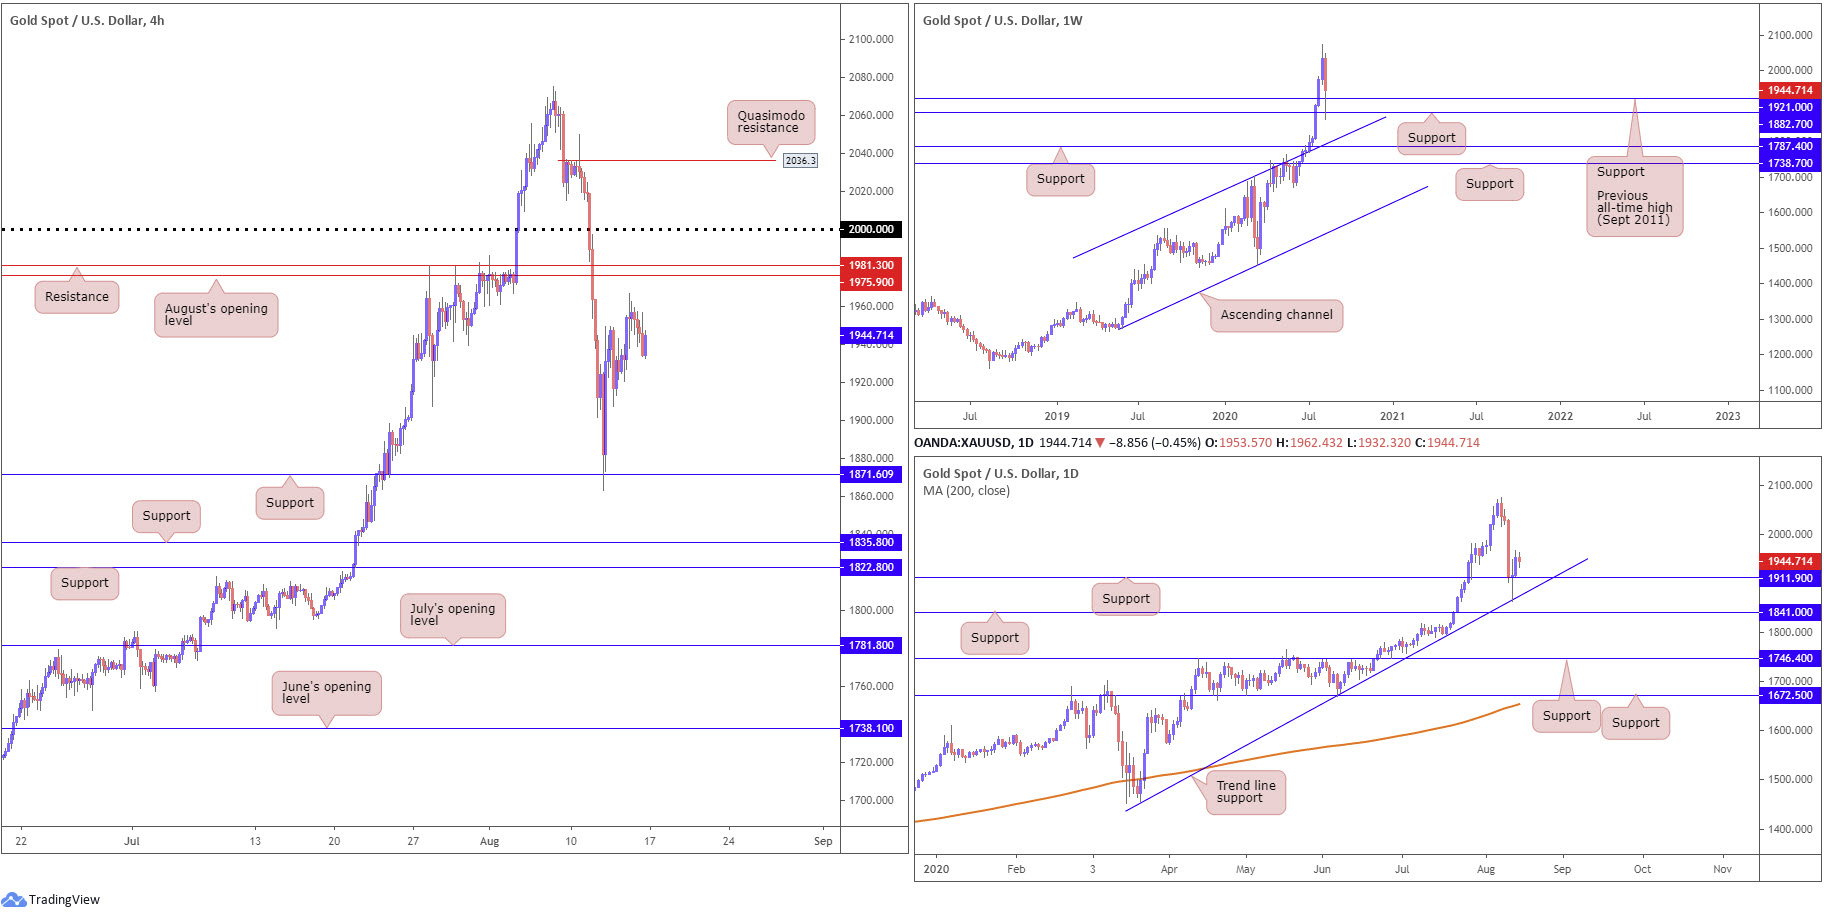
Spot gold sharply declined last week amid an advance in US Treasury yields, consequently delivering its largest weekly percentage fall since March and snapping a nine-week bullish phase. Technically, however, the retreat found demand from $1,921.00, the previous all-time high (September 2011), as well as support coming in at $1,882.70. Together, this could lift the yellow metal this week and prompt healthy recovery gains.
Daily perspective:
Traders will acknowledge daily price shook hands with trend line support Wednesday, extended from the low $1,455.32, along with converging support from $1,911.90. Thursday responded positively, yet Friday’s movement lacked follow-through and marginally corrected gains.
H4 perspective:
Wednesday witnessed H4 action retest support at $1,871.60, shining the headlights on a potential approach to August’s opening level at $1,975.90, followed by resistance at $1,981.30 and then the key figure $2,000.00.
Areas of consideration:
Bullish themes are something we may see traders consider today/early week. Though in light of limited H4 support right now, drilling down to the lower timeframes in order to secure a long position may be required, targeting the aforementioned resistances highlighted in bold.
In addition to the above, breaking $2k this week may clear upside to a H4 Quasimodo formation at $2,036.30.
The accuracy, completeness and timeliness of the information contained on this site cannot be guaranteed. IC Markets does not warranty, guarantee or make any representations, or assume any liability regarding financial results based on the use of the information in the site.
News, views, opinions, recommendations and other information obtained from sources outside of www.icmarkets.com.au, used in this site are believed to be reliable, but we cannot guarantee their accuracy or completeness. All such information is subject to change at any time without notice. IC Markets assumes no responsibility for the content of any linked site.
The fact that such links may exist does not indicate approval or endorsement of any material contained on any linked site. IC Markets is not liable for any harm caused by the transmission, through accessing the services or information on this site, of a computer virus, or other computer code or programming device that might be used to access, delete, damage, disable, disrupt or otherwise impede in any manner, the operation of the site or of any user’s software, hardware, data or property.


