
Key risk events today:
RBA Gov Lowe Speaks; ECB Financial Stability Review; ECB President Lagarde Speaks
(Previous analysis as well as outside sources – italics).
EUR/USD:
Weekly gain/loss: -0.32%
Weekly close: 1.1834
Weekly perspective:
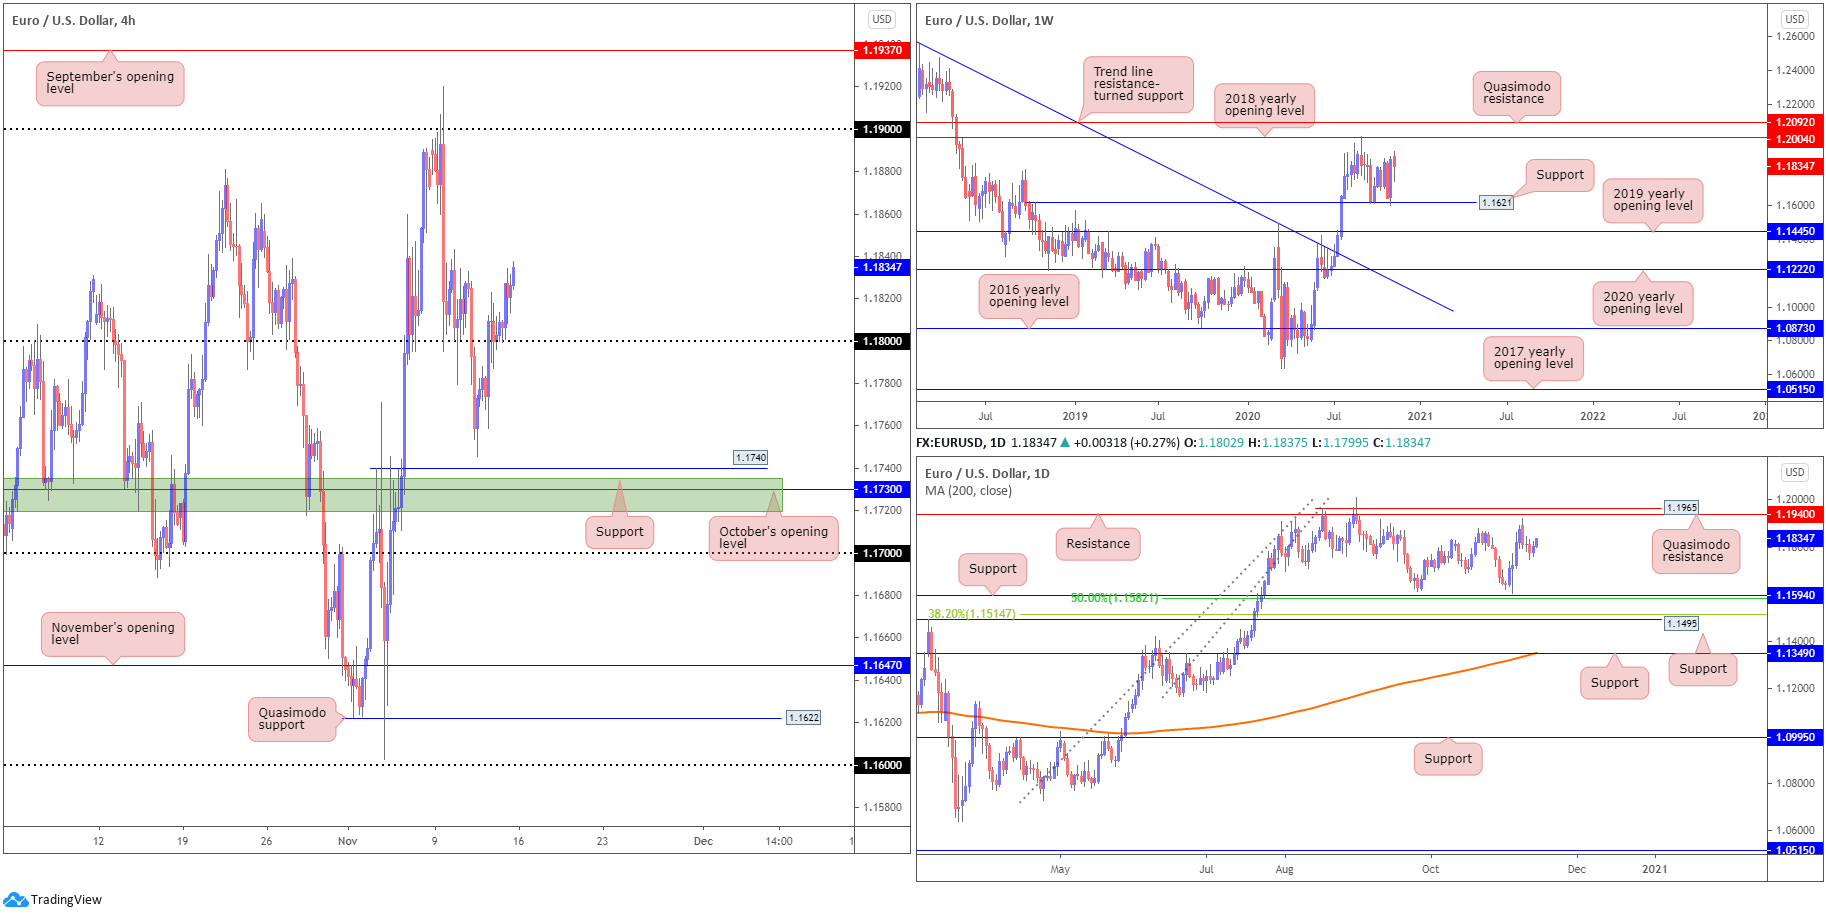
Following healthy demand off support at 1.1621, capitalising on recent momentum proved difficult last week consequently giving back nearly 40 pips. Should buyers regain consciousness this week, keep an eye on the 2018 yearly opening value at 1.2004, closely shadowed by Quasimodo resistance priced at 1.2092.
Trend traders may also acknowledge July’s trend line resistance break, taken from the high 1.2555, on top of the break of the 1.1495 March 9 swing high, potentially aligning long-term buyers in a healthy position.
Daily perspective:
Assessing the technical stance on the daily timeframe reveals the unit twisted ahead of resistance at 1.1940 and Quasimodo resistance at 1.1965 last week (sited just south of weekly resistance at 1.2004 – 2018 yearly opening level). After the initial turn, however, sellers proved colourless, with the second half of the week coordinating a modest recovery.
Nevertheless, support at 1.1594, and nearby 50.0% retracement ratio at 1.1582, reside as the next downside targets should further selling take shape this week.
H4 perspective:
EUR/USD, as evident from the chart, held on to the 1.18 handle Friday as the DXY failed to grip 93.00.
Moderately rebounding from 1.18 in the form of support, the pair finished the week pouncing on local highs around the 1.1833ish area. Clearance of 1.1833 early this week shines the spotlight on the 1.19 handle, followed by a possible assault on September’s opening value from 1.1937.
In the event 1.18 fails to drive a bullish theme and we drop lower to test ground south of the round number, support at 1.1740 (a previous Quasimodo resistance), as well as a support zone (green) around 1.1719-1.1735 and October’s opening value at 1.1730 are in view.
Areas of consideration:
- Room for higher timeframes to rally at least until daily resistance at 1.1940 might power buyers this week off 1.18 to approach 1.19 on the H4, and with some energy, maybe even September’s opening value from 1.1937.
- October’s opening value at 1.1730 and connecting H4 areas form a support to be aware of, though do take into account no higher timeframe support exists here. The same holds true for the 1.17 handle also on the H4.
- September’s opening value at 1.1937 on the H4 and daily resistance at 1.1940 marks healthy confluence to work with if a breach of 1.19 occurs.
GBP/USD:
Weekly gain/loss: +0.37%
Weekly close: 1.3191
Weekly perspective:
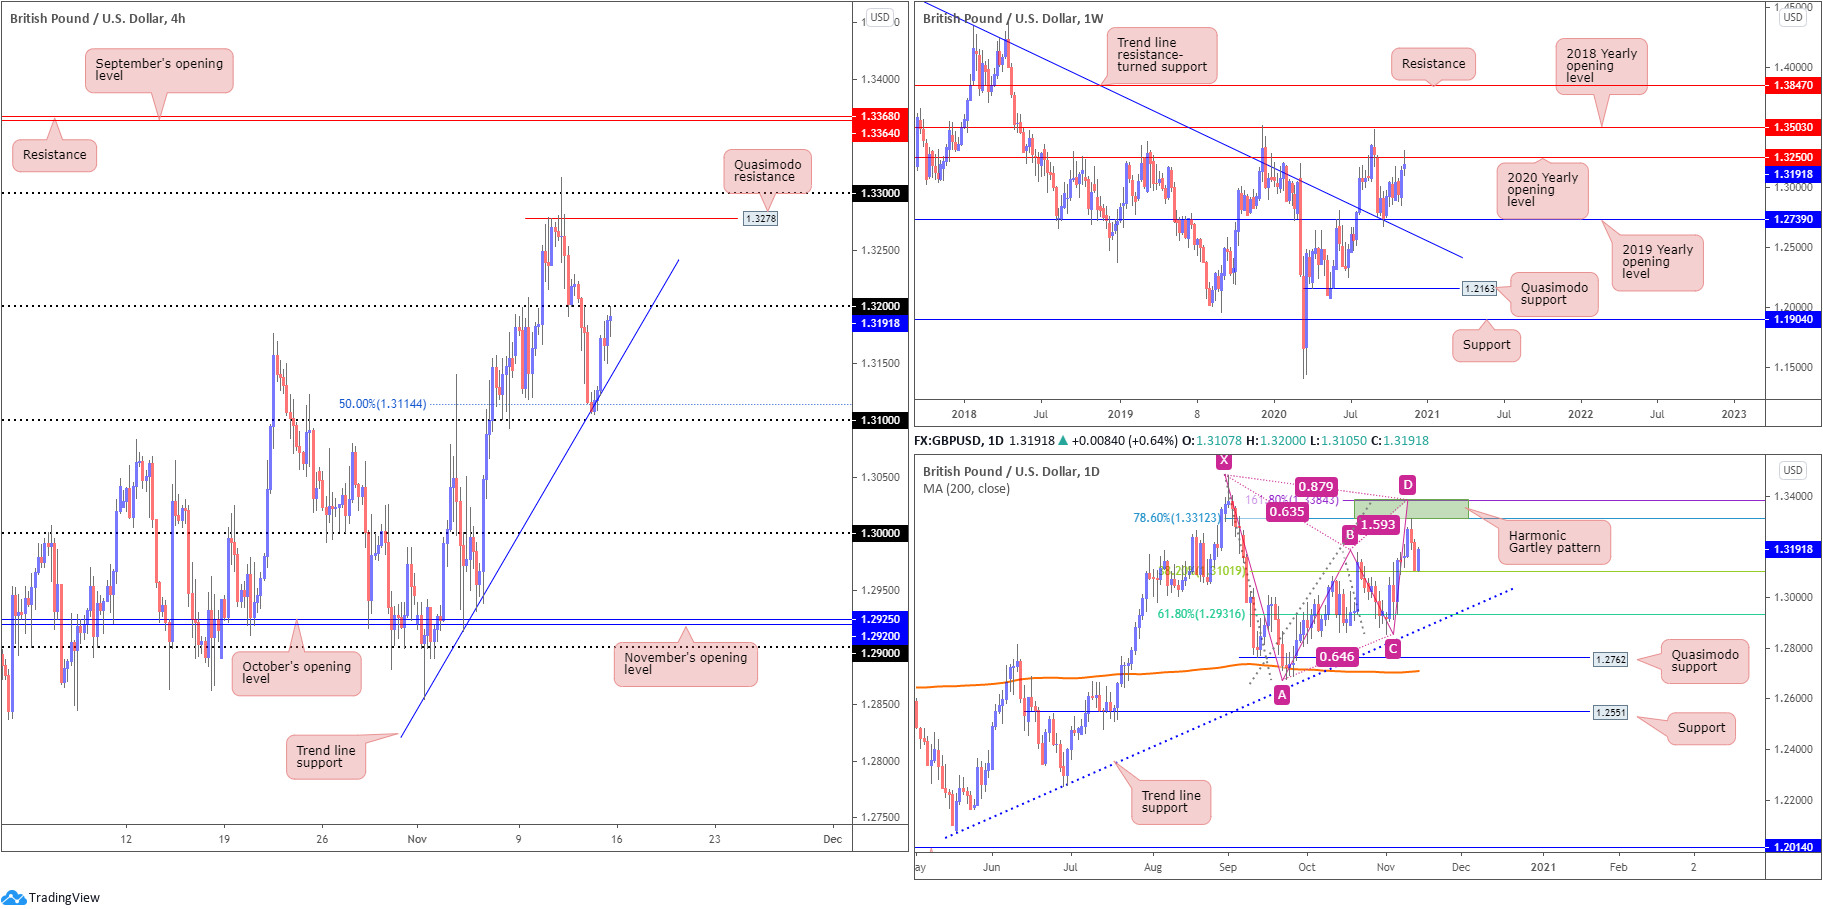
The 2020 yearly opening value at 1.3250 served reasonably well as resistance last week, plotted just beneath the 2018 yearly opening value at 1.3503.
While it’s unlikely we’ll voyage this far south this week, the 2019 yearly opening value from 1.2739 is observed, closely converging with trend line resistance-turned support, taken from the high 1.5930. It is also worth pointing out the aforementioned trend line was engulfed in July of this year, announcing an uptrend could be on the cards.
Daily perspective:
Sellers welcomed a bearish harmonic Gartley pattern’s PRZ at 1.3384/1.3312 on Wednesday last week, delivering a forceful move to within striking distance of the 38.2% Fibonacci retracement ratio at 1.3101, commonly read as an initial take-profit target (arranged from legs A-D of the Gartley).
Also arranged from legs A-D of the Gartley pattern, the 61.8% Fibonacci retracement ratio at 1.2931 is considered the next take-profit target if sellers emerge this week. Traders will also acknowledge the aforementioned Fibonacci level converges with trend line support, taken from the low 1.2075.
H4 perspective:
Late Thursday saw H4 shake hands with trend line support, extended from the low 1.2853, and merging 50.0% retracement ratio at 1.3114, consequently delivering a healthy bid Friday. Price, as you can see, ended the session around highs, testing the 1.32 handle.
While breaking 1.32 brings light to Quasimodo resistance at 1.3278 and the 1.33 handle, sellers from the higher timeframe areas highlighted above might be watching for the current H4 trend line support and the 1.31 handle to give way this week to approach the key figure 1.30.
Areas of consideration:
- Higher timeframe sellers short this market are likely eyeing a trend line support break on the H4 this week, ultimately targeting 1.30 and then the 61.8% Fibonacci retracement ratio at 1.2931 on the daily timeframe. With that potentially being the case, bearish scenarios may form off the 1.32 handle (H4) as current sellers (and also fresh sellers) look to try and fade Friday’s rally.
- Assuming further selling forms, additional bearish positions may also form sub 1.31. Conservative players, however, will likely seek a 1.31 retest as resistance before pulling the trigger.
AUD/USD:
Weekly gain/loss: +0.09%
Weekly close: 0.7264
Weekly perspective:
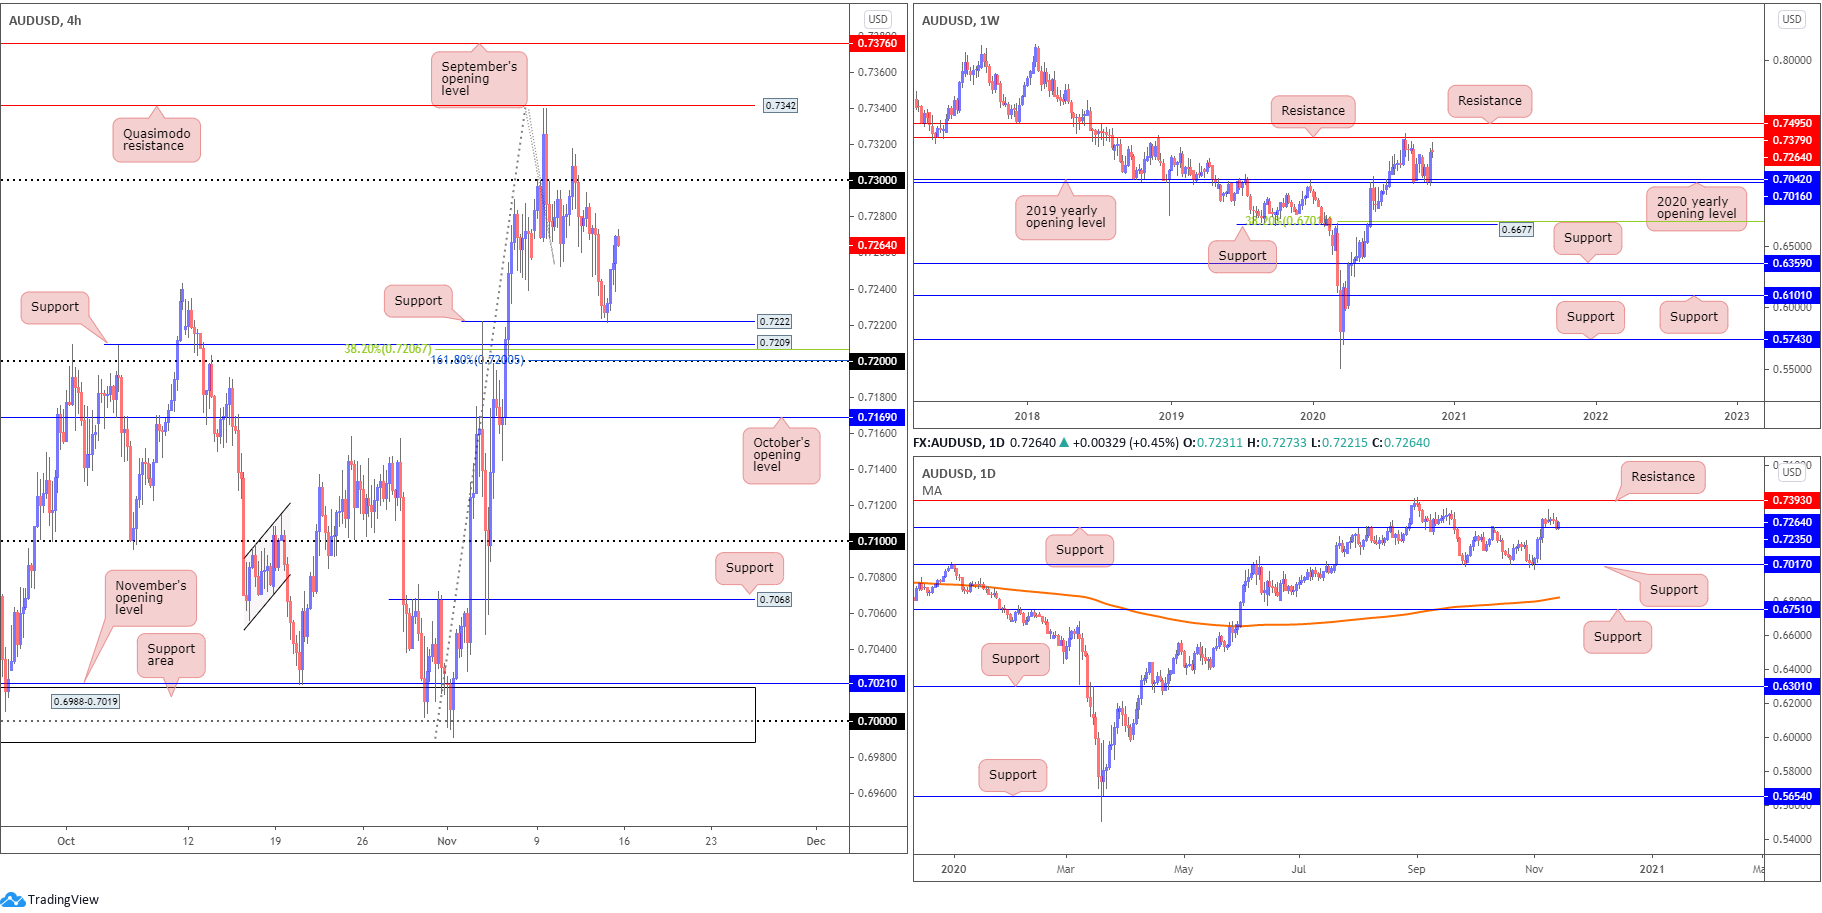
The prior week’s substantial 3% showing off the 2020 (0.7016) and 2019 (0.7042) yearly opening values (supports) fizzled out somewhat last week, finishing the session pretty much unchanged.
In view of this market trending higher since early 2020, buyers may still have eyes for resistance priced in at 0.7379 this week, and maybe even neighbouring resistance at 0.7495.
Daily perspective:
The possibility of an additional sweep of bullish flow this week is reinforced by the recent retest at support drawn from 0.7235.
Friday’s response from 0.7235, enough to reclaim a large portion of Thursday’s losses, could sweet-talk buyers to attempt to take a run at resistance from 0.7393 (positioned above weekly resistance).
H4 perspective:
One of the stronger performers in the G10 pile Friday, AUD/USD knocked on the door of support at 0.7222 (sited above support at 0.7209 and the 0.72 handle, as well as a 38.2% Fibonacci retracement ratio at 0.7206 and a 161.8% Fibonacci projection point at 0.7200) and rebounded strongly.
With Friday’s rebound also fuelled on the back of technical buying off daily support at 0.7235, in line with the current uptrend (since early 2020), buyers may draw towards the 0.73 handle, Quasimodo resistance at 0.7342 and maybe even September’s opening value at 0.7376.
Areas of consideration:
- Longer-term resistance to be aware of this week falls in between weekly resistance at 0.7379 and daily resistance from 0.7393, also aligning closely with September’s opening value at 0.7376 on the H4.
- With the exception of testing H4 support between 0.7209/0.72, this week may see bullish breakout themes develop above 0.73, targeting H4 Quasimodo resistance at 0.7342, followed by 0.7393/0.7379 on the higher timeframes.
USD/JPY:
Weekly gain/loss: +1.17%
Weekly close: 104.55
Weekly perspective:
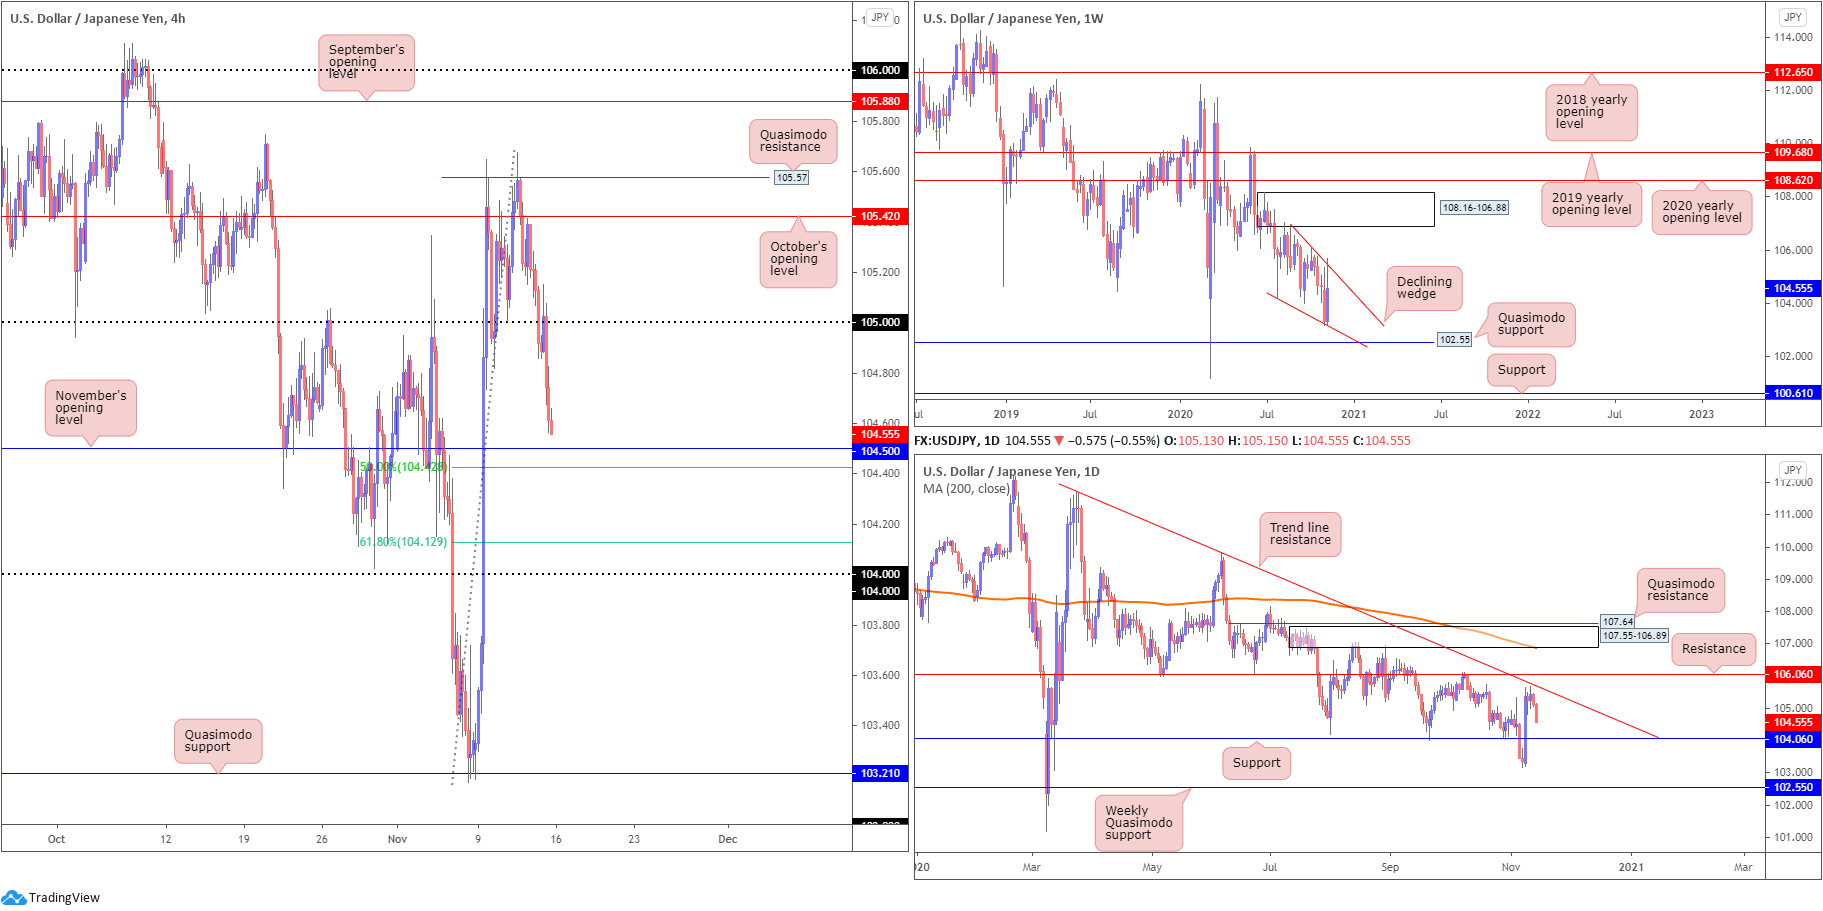
Since reconnecting with the underside of supply at 108.16-106.88 in August, weekly candles have slowly grinded lower, forming a declining wedge (106.94/104.18).
Quasimodo support at 102.55 is in view, with a break exposing support plotted at 100.61.
A strong bounce from 102.55 may provide enough impetus for buyers to attempt a breakout above the current declining wedge.
Daily perspective:
Price action on the daily timeframe shifted south into the second half of the week, topping within touching distance of trend line resistance, extended from the high 111.71, and resistance at 106.06.
Friday closing at session lows throws 104.06 in the pot as possible support this week. Burrowing through this level would be interesting, nonetheless, shining the headlights on the weekly Quasimodo support mentioned above at 102.55.
H4 perspective:
In wake of a somewhat disorderly retest at the underside of 105, sellers extended losses Friday and settled a touch north of November’s opening value at 104.50 and a 50.0% retracement ratio at 104.42.
Subsequent selling this week underlines the 104 handle, a level that sits just under daily support coming in at 104.06 and a 61.8% H4 Fibonacci retracement ratio at 104.12.
Areas of consideration:
- November’s opening value at 104.50 and a 50.0% retracement ratio at 104.42 on the H4, though the area lacks higher timeframe confluence.
- Recently reacting from the upper parapet of a weekly declining wedge, H4 sellers south of 105 likely have November’s opening value at 104.50 and a 50.0% retracement ratio at 104.42 on the radar. Though ultimately, we could see sellers push for 104.06 support on the daily timeframe this week and, by extension, the 104 handle on the H4.
- The 104 handle is likely watched support, having noted confluence from daily support confluence at 104.06.
USD/CAD:
Weekly gain/loss: +0.49%
Weekly close: 1.3118
Weekly perspective:
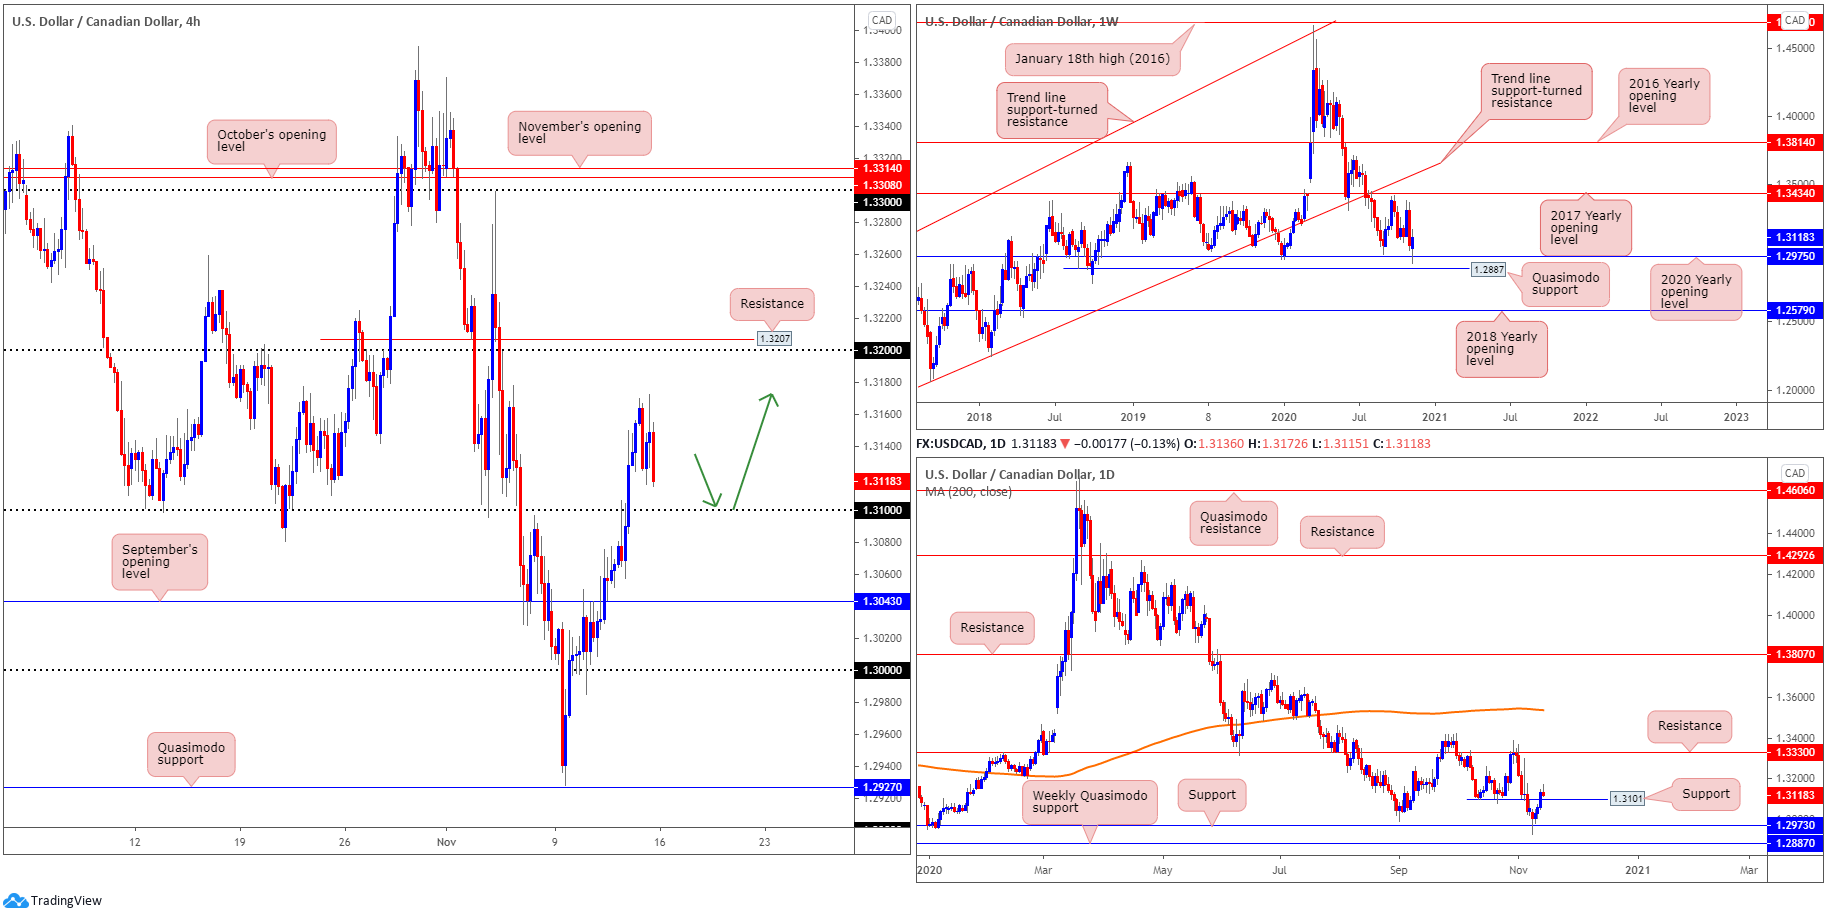
Despite sinking to a session low at 1.2928, the 2020 yearly opening value at 1.2975, arranged north of a Quasimodo support priced in at 1.2887, triggered a wave of buying last week, closing a touch off best levels.
Additional interest to the upside could eventually fuel a test of the 2017 yearly opening value at 1.3434, covered under trend line support-turned resistance, taken from the low 1.2061.
Given this market has traded lower since topping at 1.4667 in early 2020, breaking the aforementioned supports also remains an option, consequently swinging the pendulum in favour of further weakness towards the 2018 yearly opening value at 1.2579.
Daily perspective:
With weekly price rebounding from support at 1.2975 as well as daily price also recently coming off support at 1.2973 (essentially marking the same area), price swept aside daily resistance at 1.3101 (now possible support) last week, with further buying perhaps reaching for resistance coming in at 1.3330.
H4 perspective:
With WTI falling for a third consecutive session Friday, and the DXY losing grip of 93.00, USD/CAD exhibited a mixed tone.
Following a brief spell at the lower side of the 1.31 handle, the pair eventually mustered enough strength to overthrow 1.31 on Thursday.
In terms of resistance, 1.32 and 1.3207 offer reasonable possibilities, with focus shifting to the 1.33 region (along with October and November’s opening values at 1.3308 and 1.3314, respectively) if buyers take out 1.32.
Areas of consideration:
- Retesting 1.31 on the H4 is a possible scenario to be aware of this week (green arrows). Having highlighted space to climb higher on the bigger picture, buyers may welcome this setup, particularly if formed in the shape of a H4 bullish candlestick pattern.
- H4 resistance made up of 1.3207/1.32 are likely to call for attention should buyers remain in the driving seat. Though it is worth recognising that limited higher timeframe resistance is present here. In fact, higher timeframe resistance is not expected to emerge until around the 1.33ish range.
USD/CHF:
Weekly gain/loss: +1.24%
Weekly close: 0.9110
Weekly perspective:
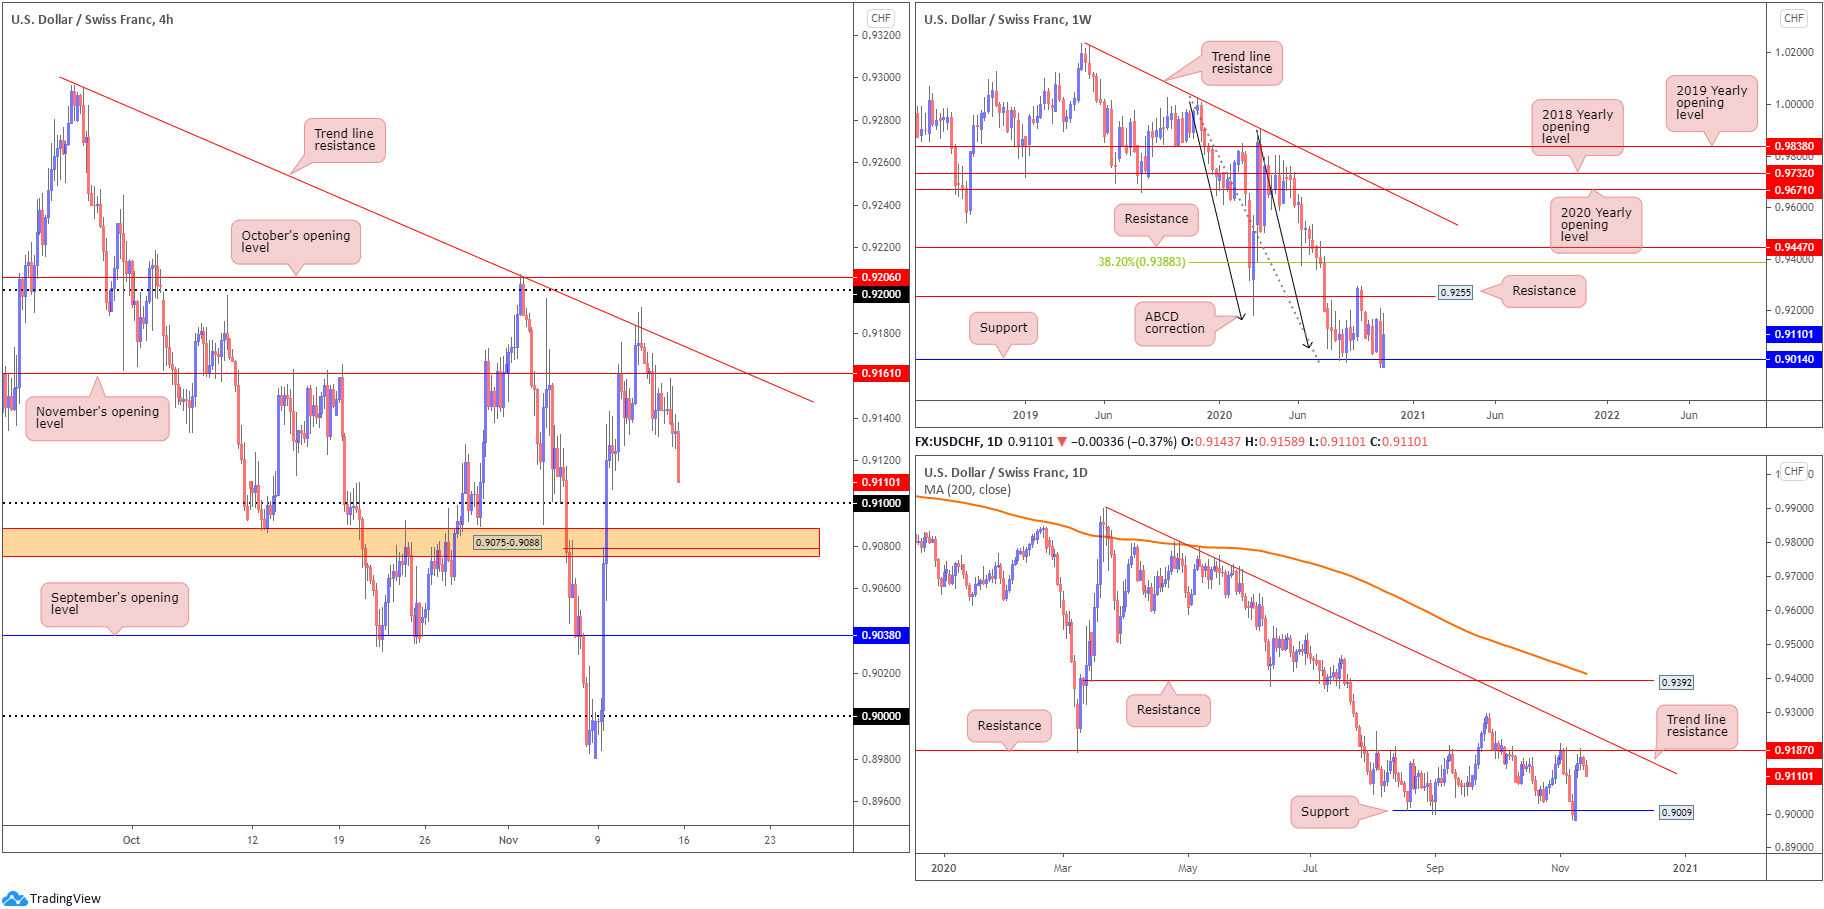
The weekly timeframe reveals buyers entered a reasonably heavy bid off support at 0.9014 last week, a level dovetailing closely with ABCD support at 0.9051 (black arrows).
0.9255 resistance (a prior Quasimodo support) is next in the firing range should buyers continue to support this market this week, with a 38.2% Fibonacci retracement ratio forged at 0.9388 to target should further buying emerge (an initial take-profit target associated with the ABCD support mentioned above).
It should also be noted that this market has been trending lower since April 2019.
Daily perspective:
From the daily timeframe, however, we are, following a decisive recovery off Quasimodo support at 0.9009, now crossing swords with resistance at 0.9187.
Beyond here, assuming weekly players eventually push higher, traders will likely recognise nearby trend line resistance, taken from the high 0.9901, which happens to merge with weekly resistance at 0.9255.
H4 perspective:
The intraday bias remained pressured to the downside on Friday, in lockstep with the DXY sliding south of 93.00.
We can see price languishing underneath November’s opening value at 0.9161, following Wednesday’s (shooting star) rejection off trend line resistance, taken from the high 0.9295.
Limited demand is visible to the left of price; for that reason, chart structure implies 0.91 may enter into force, fixed just ahead of an area of support at 0.9075-0.9088. Traders may also acknowledge that a break of the aforesaid supports exposes September’s opening value at 0.9038.
Areas of consideration:
- Daily price rejecting resistance at 0.9187, along with the overall trend pointing south, signals H4 sellers may have sufficient fuel to reach at least 0.91.
- Buyers are also likely focused on 0.91 and H4 support at 0.9075-0.9088 on the back of weekly price bouncing from support at 0.9014. However, daily price could still push through the H4 areas to pursue 0.9009 (movement that may spark bearish scenarios to September’s opening value at 0.9038 on the H4).
- Weekly resistance at 0.9255 offers a longer-term ceiling, strengthened on the back of daily trend line resistance (0.9901).
Dow Jones Industrial Average:
Weekly gain/loss: +3.91%
Weekly close: 29493
Weekly perspective:
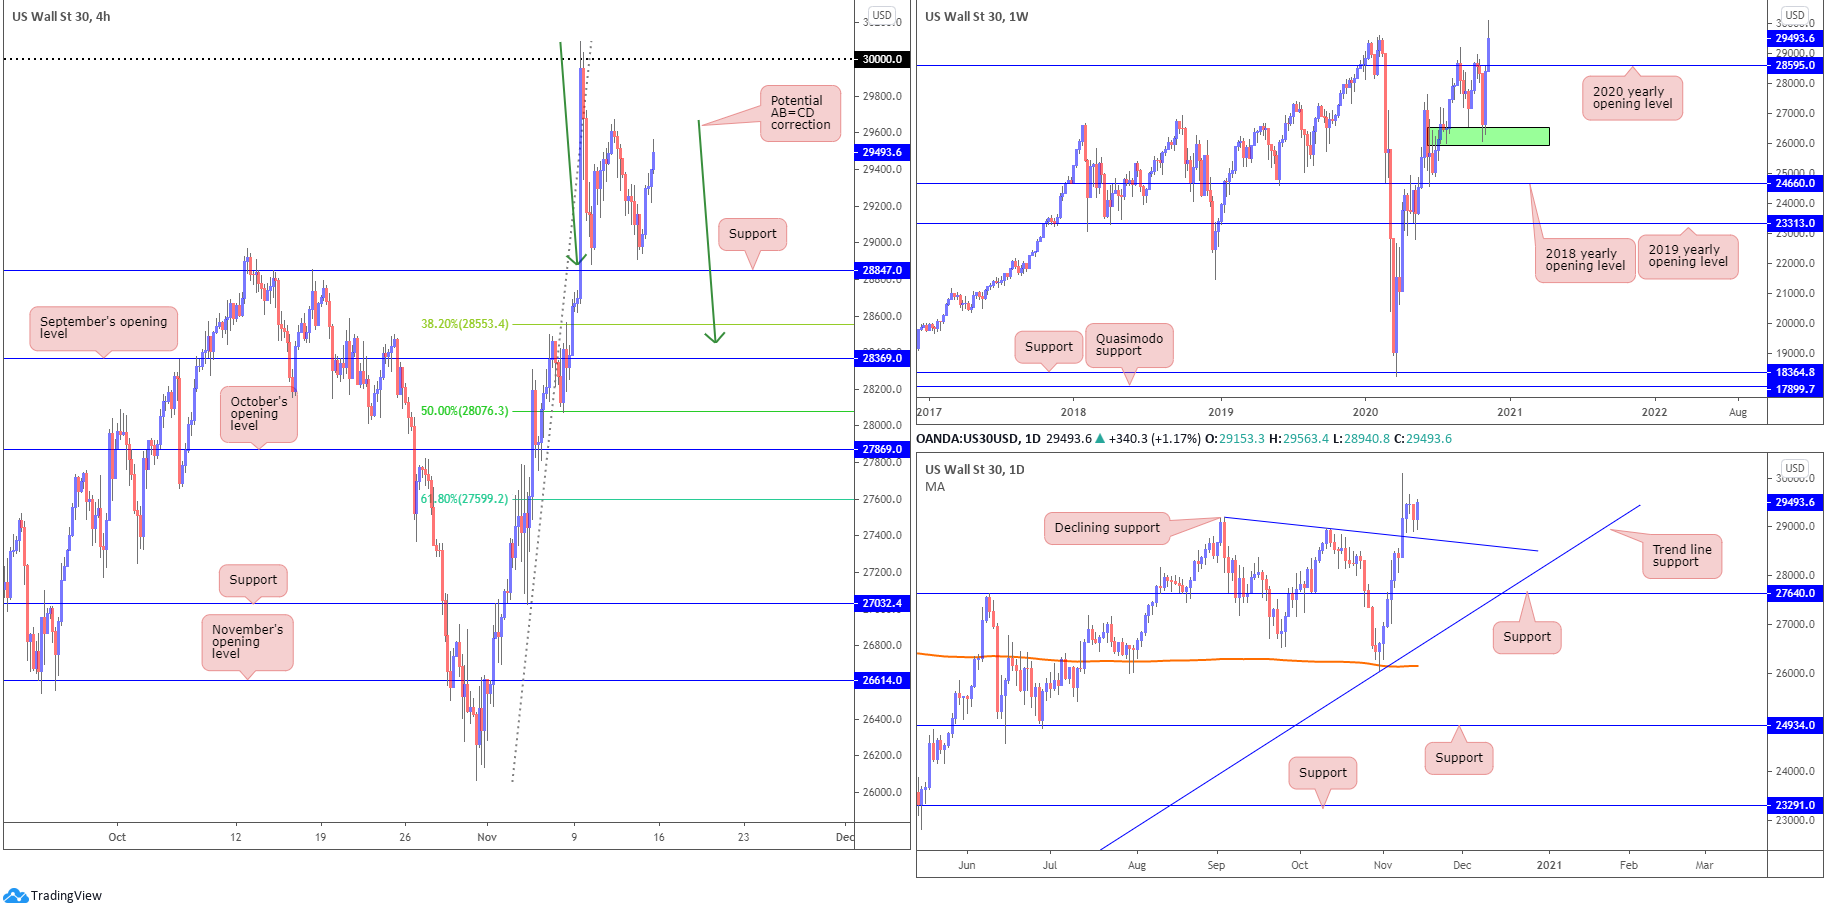
Buyers claimed a fresh all-time peak at 30097 last week, gleaning impetus from the prior week’s near-7% advance from demand at 25916-26523 (green) along with technical buying north of the 2020 yearly opening value at 28595.
Before attempting to break to fresh highs this week, a correction/retest at 28595 could be in the wind this week.
Daily perspective:
Price action on the daily timeframe saw bulls respond Friday, ahead of a declining support, taken from the high 29193. Should a break of here come to pass, support at 27640 is seen, closely followed by trend line support, etched from the low 18213.
H4 perspective:
US equity benchmarks finished Friday higher across the board as investors digest the possibility of a COVID-19 vaccine. The Dow Jones Industrial Average climbed 399.64 points, or 1.37%, the S&P 500 traded higher by 48.14 points, or 1.36%, and the Nasdaq also ended higher by 119.70 points, or 1.02%.
Technically, on the H4 scale, the 30000 level represents resistance while 28847 is seen as support. A break lower exposes the 38.2% Fibonacci retracement ratio at 28553, followed by September’s opening value at 28369. In addition, AB=CD support can be found around 28450 (green arrows).
Areas of consideration:
Outlook unchanged.
- Forming fresh all-time highs, as highlighted in recent analysis, will likely excite buyers.
- As a result, dip-buying opportunities remain on the table this week from H4 support at 28847. Failure to hold, buyers’ crosshairs may switch to the 38.2% H4 Fibonacci retracement ratio seen at 28553, joined closely by H4 ABCD support around 28450 and September’s opening value at 28369.
XAU/USD (GOLD):
Weekly gain/loss: -3.16%
Weekly close: $1,889
Weekly perspective:
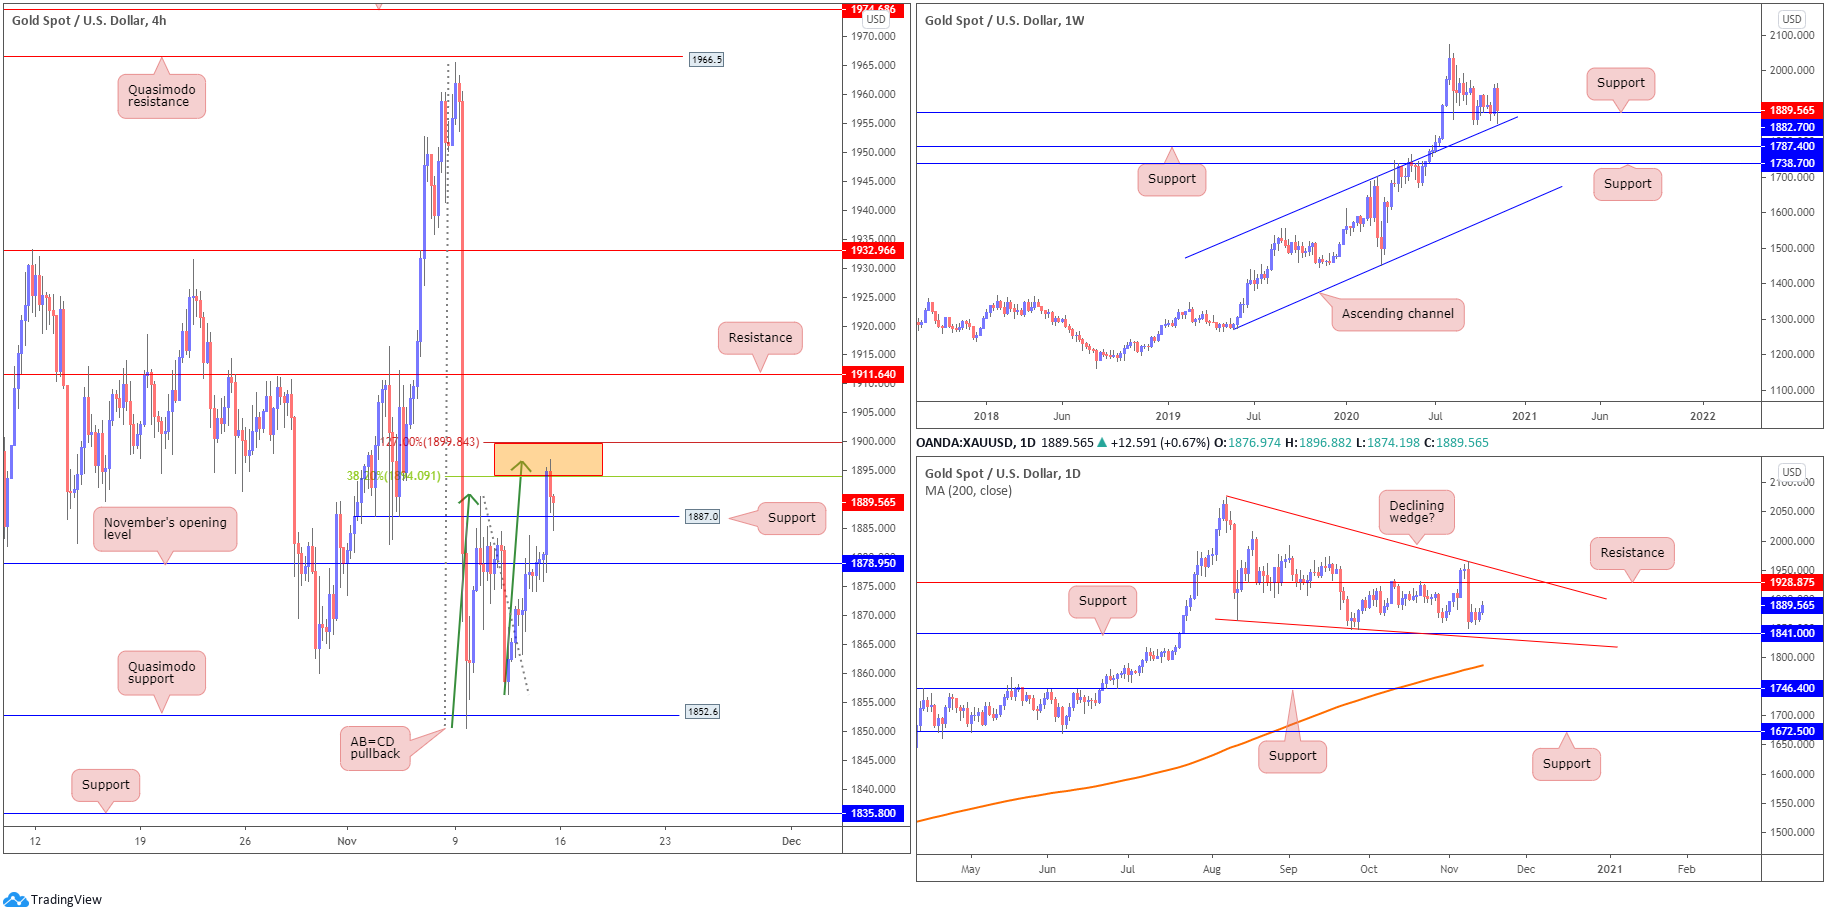
Weekly price recently dipped a toe (whipsawed) under support at $1,882, coming within striking distance of channel resistance-turned support, taken from the high $1,703. Should a wave of buying arise this week, long-term traders’ crosshairs are perhaps focussed on the all-time peak $2,075.
Traders may also want to bear in mind the price of gold remains in a decisive uptrend.
Daily perspective:
A closer examination of price action on the daily timeframe reveals the yellow metal bottoming ahead of support at $1,841, with buyers maybe observing resistance at $1,928.
Another feature worth highlighting on the daily chart is a possible falling wedge pattern between $2,075/$1,862.
H4 perspective:
Friday extended Thursday’s gains, lifting the price of gold through November’s opening value at $1,878 and resistance at $1,887 to cross swords with an AB=CD resistance zone between $1,899-$1,894. While sellers responded from the zone late US hours Friday, buyers also made an appearance into the close off $1,887 as support in the shape of a hammer candle pattern.
Further upside from current price targets resistance at $1,911, while south of $1,887 draws light back to November’s opening value at $1,878.
Areas of consideration:
- Weekly price trading at support drawn from $1,882, in addition to daily price demonstrating scope to advance to resistance at $1,928, may overwhelm H4 sellers from the AB=CD resistance zone between $1,899-$1,894. With that, buyers off H4 support at $1,887 could be a strong force in early trading this week, targeting H4 resistance at $1,911.
The accuracy, completeness and timeliness of the information contained on this site cannot be guaranteed. IC Markets does not warranty, guarantee or make any representations, or assume any liability regarding financial results based on the use of the information in the site.
News, views, opinions, recommendations and other information obtained from sources outside of www.icmarkets.com.au, used in this site are believed to be reliable, but we cannot guarantee their accuracy or completeness. All such information is subject to change at any time without notice. IC Markets assumes no responsibility for the content of any linked site.
The fact that such links may exist does not indicate approval or endorsement of any material contained on any linked site. IC Markets is not liable for any harm caused by the transmission, through accessing the services or information on this site, of a computer virus, or other computer code or programming device that might be used to access, delete, damage, disable, disrupt or otherwise impede in any manner, the operation of the site or of any user’s software, hardware, data or property


