
A note on lower timeframe confirming price action…
Waiting for lower timeframe confirmation is our main tool to confirm strength within higher timeframe zones, and has really been the key to our trading success. It takes a little time to understand the subtle nuances, however, as each trade is never the same, but once you master the rhythm so to speak, you will be saved from countless unnecessary losing trades. The following is a list of what we look for:
- A break/retest of supply or demand dependent on which way you’re trading.
- A trendline break/retest.
- Buying/selling tails/wicks – essentially we look for a cluster of very obvious spikes off of lower timeframe support and resistance levels within the higher timeframe zone.
- Candlestick patterns. We tend to stick with pin bars and engulfing bars as these have proven to be the most effective.
We search for lower timeframe confirmation between the M15 and H1 timeframes, since most of our higher-timeframe areas begin with the H4. Stops are usually placed 3-5 pips beyond confirming structures.
EUR/USD:
Weekly gain/loss: + 108 pips
Weekly closing price: 1.0639
Weekly opening price: 1.0603
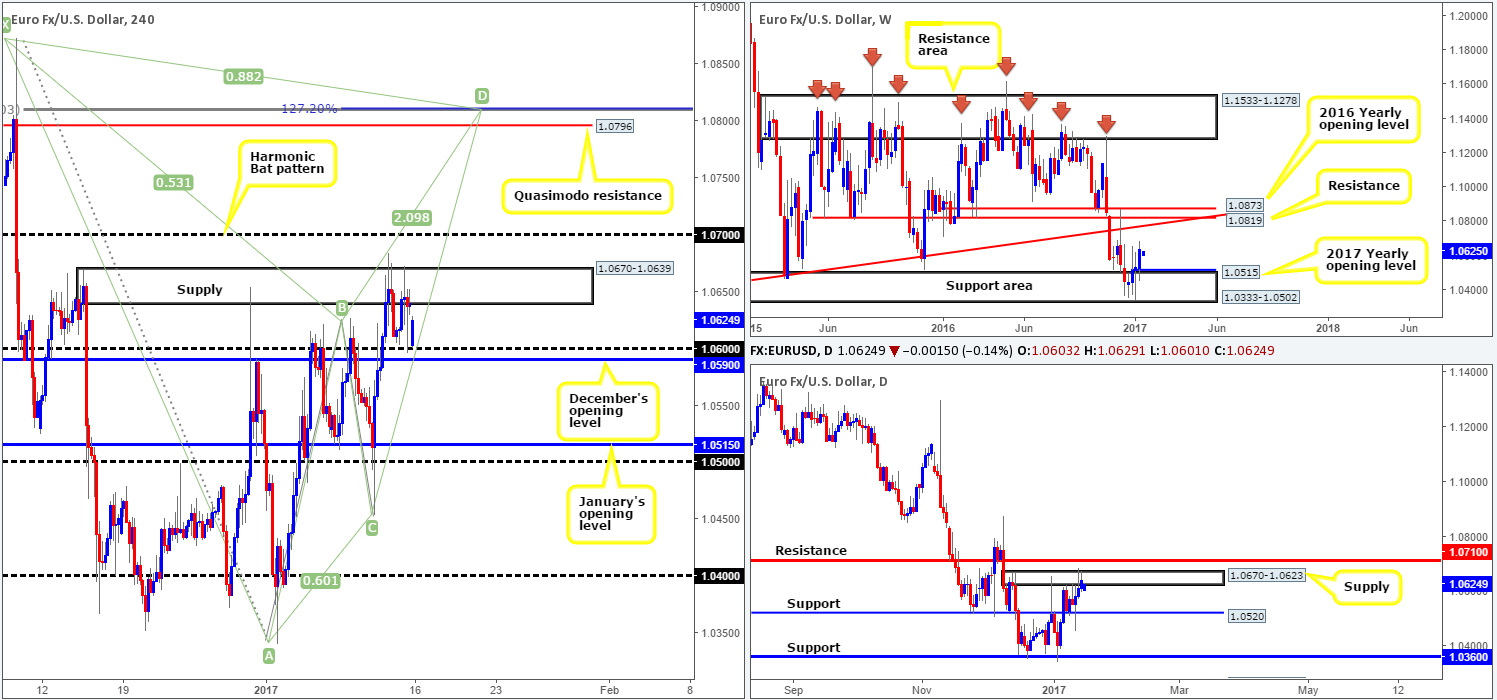
As is shown on the weekly chart, the EUR was seen flexing its financial muscle somewhat last week with price tapping highs of 1.0684. Should we see a similar picture this week, it’s likely that the unit will shake hands with the long-term weekly trendline resistance extended from the low 0.8231. Therefore, do keep an eyeball on this line this week.
Daily supply at 1.0670-1.0623, in our opinion, appears to be on the verge of giving way. Thursday’s candle, as you can see, stabbed through the top edge of this barrier, suggesting stops had likely been triggered. Following this, Friday’s candle printed its third consecutive bullish close to end the week. If indeed we’re correct here, the next objective seen beyond this base, a daily resistance coming in at 1.0710, will likely be brought into view soon.
Moving across to the H4 candles, we can see that the pair opened this morning around the 1.06 handle, 36 pips lower than Friday’s close. Despite this, the bulls seem to be finding their feet and have, at the time of writing, already rallied around 20 pips, strongly indicating this morning’s gap will be filled relatively quickly.
Our suggestions: With H4 supply at 1.0670-1.0639 (located deep within the above noted daily supply) also looking incredibly weak, we feel that given the recent strength shown over the last week, this H4 zone will likely be consumed today and 1.07 may be brought into the picture. As you can probably see, 1.07 sits 10 pips below the aforementioned daily resistance, so we are expecting a reaction to be seen from this angle. Dependent on the time of day and whether the lower-timeframe candles form a sell setup, we may look to sell from this hurdle. A lower-timeframe setup would, in our book, be considered either of the following: a break of demand followed by a retest as supply, a trendline break/retest or simply a collection of well-defined selling wicks around the higher-timeframe sell zone.
In the event that 1.07 is ignored, however, all eyes will then likely be on 1.0796 – a H4 Quasimodo resistance line that’s positioned nearby the tip of a H4 Harmonic (Bat) potential reversal zone at 1.0809. This – coupled with it also being located nearby the long-term weekly trendline resistance highlighted above and the 1.08 handle, makes this area a strong place to watch this week for shorts. In addition to this, one may, should a H4 close be seen above 1.07, also want to consider taking a long on any retest of 1.07 (we’d advise waiting for a H4 bull candle to form following the retest as a way of confirming buyer intent), targeting the above said H4 Harmonic sell zone.
Data points to consider: There are no scheduled high-impacting news events on the docket today relating to these two markets.
Levels to watch/live orders:
- Buys: Watch for price to close above the 1.07 handle and then look to trade any retest seen thereafter ([a H4 bull candle is required following the retest before a trade can be executed] stop loss: ideally beyond the trigger candle).
- Sells: 1.07 region ([lower-timeframe confirmation is required here before a trade can be executed] stop loss: depends on where one confirms the zone). 1.08 region ([this is an area where we would consider trading without confirmation] stop loss: 1.0815).
GBP/USD:
Weekly gain/loss: – 88 pips
Weekly closing price: 1.2191
Weekly opening price: 1.20
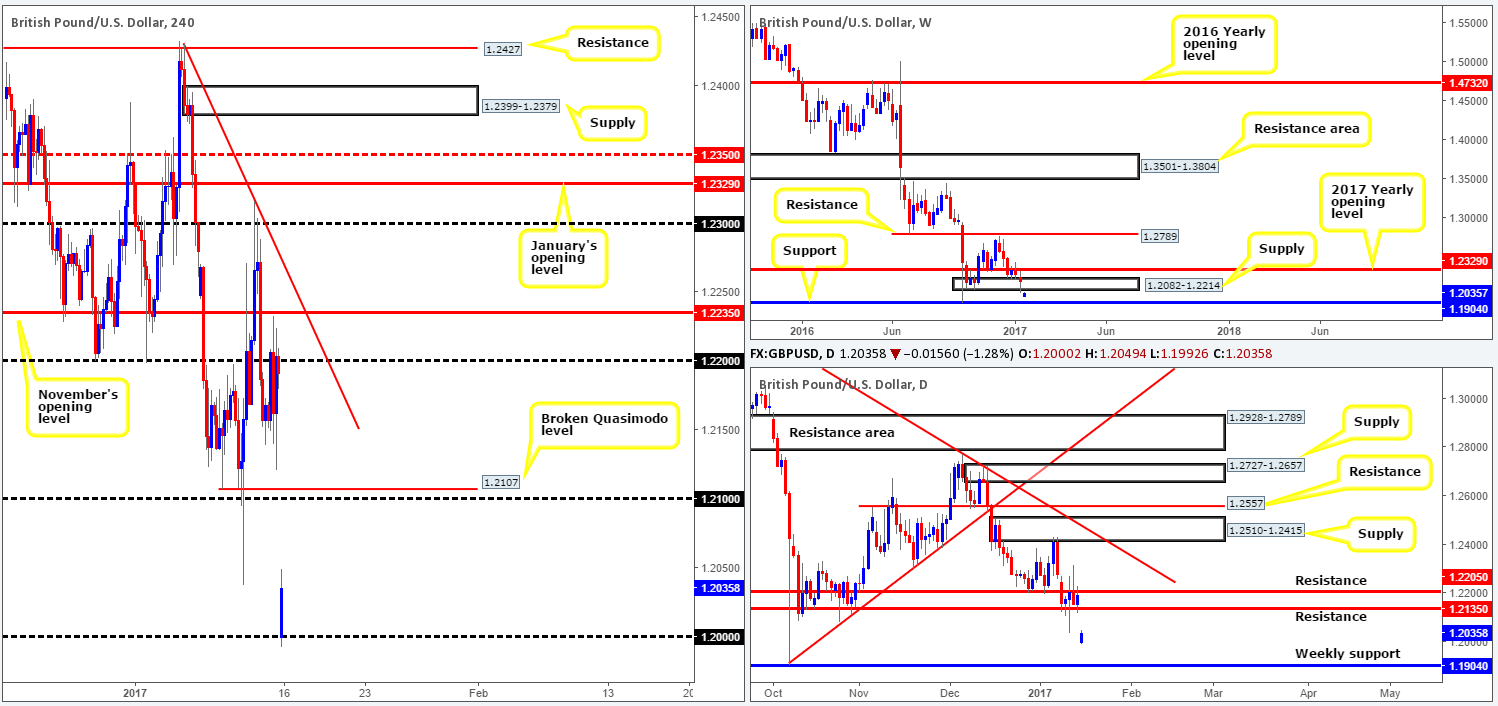
Sterling opened markedly lower this morning, declining against the majority of its trading partners. The near-200-pip gap lower is said to have been triggered by comments made by the British Prime Minister Theresa May regarding the withdrawal from tariff-free trade in the EU, in an attempt to curb UK immigration and strike commercial deals with other countries. As you can see, this was clearly not something the market wanted to hear! The opening gap brought price down to the major psychological hurdle 1.20, which has thus far responded bullishly.
Ultimately, we’d like to say that the pair will fill the entire gap today and bring prices back up to the 1.22 region, but we feel this could be challenging. Not only does the pair have to contend with the lower edge of weekly supply at 1.2082, but just above that we also have daily resistance coming in at 1.2135.
Our suggestions: Between 1.21 and the aforementioned lower edge of weekly supply is where we believe this instrument will find resistance today. This begs the question, is this area tradable? Although a reaction could very well be seen, it may be best to let the dust settle in the GBP markets today. This will give one the chance to analyze investors’ response to the recent movement before making any trade calls.
Data points to consider: BoE Gov. Carney speaks at 6.30pm GMT.
Levels to watch/live orders:
- Buys: Flat (stop loss: N/A).
- Sells: Flat (stop loss: N/A).
AUD/USD:
Weekly gain/loss: + 201 pips
Weekly closing price: 0.7493
Weekly opening price: 0.7480
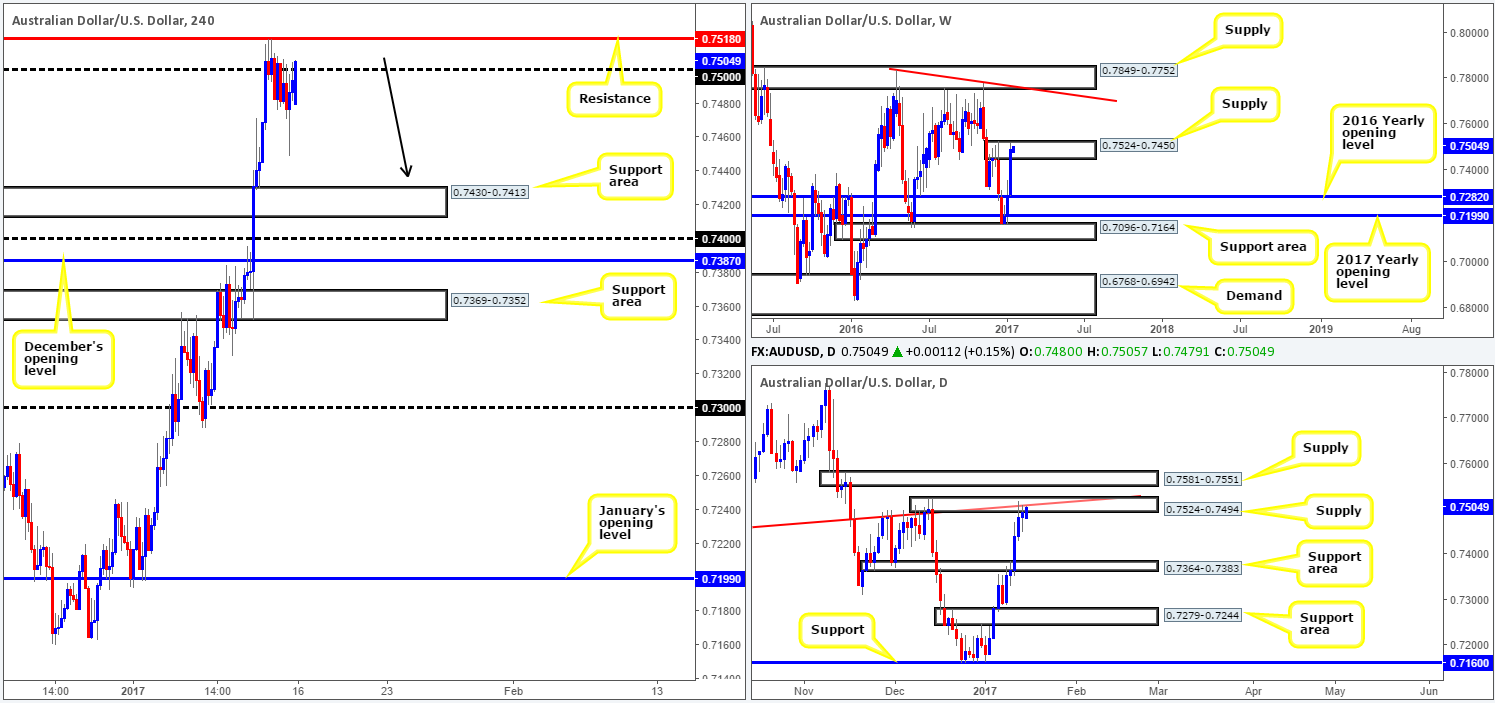
As we can all see from the weekly chart this morning the commodity currency had an absolutely smashing week, boasting a third consecutive weekly gain! Despite this, traders now have to contend with the possibility of a reversal since last week’s candle drove itself deep into a weekly supply zone drawn from 0.7524-0.7450. In conjunction with weekly price, the daily candles are also seen flirting with daily supply at 0.7524-0.7494 that fuses with a daily trendline resistance taken from the low 0.7407.
A quick recap of Friday’s trade shows that price did, as anticipated, retest the 0.75 boundary. 0.75 – coupled with neighboring H4 resistance at 0.7518 and the above mentioned higher-timeframe structure, certainly places this market in somewhat of a bearish setting this morning.
Our suggestions: In Friday’s report, our team highlighted that should a H4 bearish candle take shape around the 0.7518/0.75 region, our desk would be looking to sell. We missed Friday’s bearish signal and it was probably a good thing in hindsight as price only managed to print a low of 0.7449.
Given the current position of the H4 candles this morning, we may have a second chance to enter short today. This time, however, we’ll be looking to the lower timeframes for entry (see the top of this report). Given that there’s a chance of price finding support around the 0.7450 neighborhood again, waiting for lower-timeframe confirmation will likely allow for a smaller stop loss than if one waits for a H4 bear candle, thus improving risk/reward even if price does halt at 0.7450.
Data points to consider: There are no scheduled high-impacting news events on the docket today relating to these two markets.
Levels to watch/live orders:
- Buys: Flat (stop loss: N/A).
- Sells: 0.7518/0.75 ([lower-timeframe confirmation is required here before a trade can be executed] stop loss: depends on where one confirms the zone).
USD/JPY:
Weekly gain/loss: – 247 pips
Weekly closing price: 114.42
Weekly opening price: 114.32
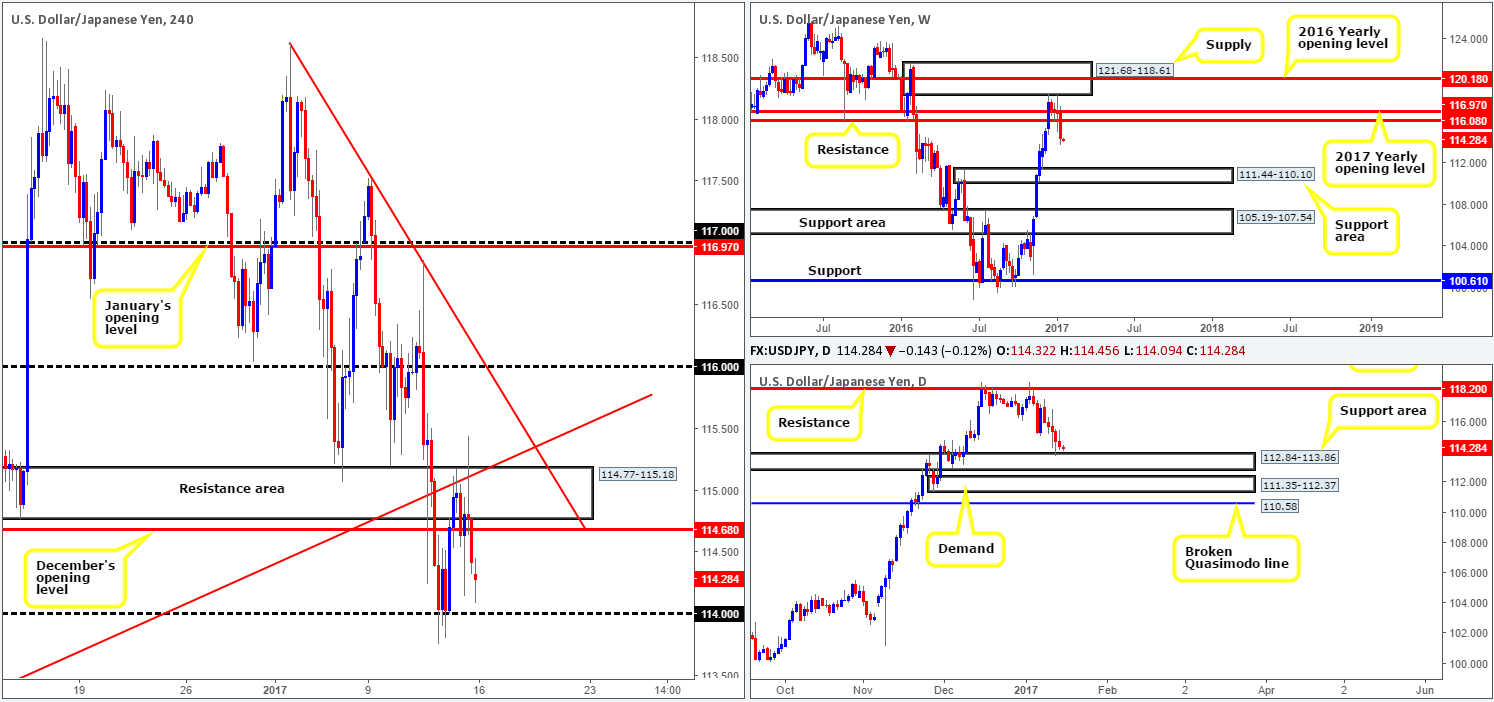
The USD/JPY sustained further losses last week, bringing price to lows of 113.75. According to weekly structure, last week’s selloff could have set the stage for a fairly substantial move down to the weekly support area coming in at 111.44-110.10. On the other side of the fence, nevertheless, one may want to take into consideration that daily movement has recently checked in with a daily support area coming in at 112.84-113.86. Be that as it may, the response seen from this barrier thus far has not been impressive, with Friday’s action cementing a strong bearish candle into the week’s close.
Looking at Friday’s session on the H4 chart shows us that the H4 resistance area at 114.77-115.18, along with the H4 trendline resistance taken from the low 112.86, successfully capped upside. The next downside hurdle on this scale is the 114 band, which, with the help of the top edge of the daily support area mentioned above, bolstered this market on Thursday. Assuming that 114 gives way, this potentially opens the doors for price to challenge H4 support seen at 113.28.
Our suggestions: Although the 114 barrier is located just above the aforementioned daily support area, we are wary of buying from here due to the little support being seen on the weekly timeframe. By the same token, a short, although it’s considered to be in-line with weekly flow, is risky given the current daily support area and round number 114 currently in play.
A close below 114 followed up by a retest would, we admit, be a tempting setup to trade in light of the weekly chart’s structure. However, as you can probably see by now, you’d be selling DIRECTLY into daily demand!
In the absence of clearer price action, we’ve decided to remain flat for the time being.
Data points to consider: There are no scheduled high-impacting news events on the docket today relating to these two markets.
Levels to watch/live orders:
- Buys: Flat (stop loss: N/A).
- Sells: Flat (stop loss: N/A).
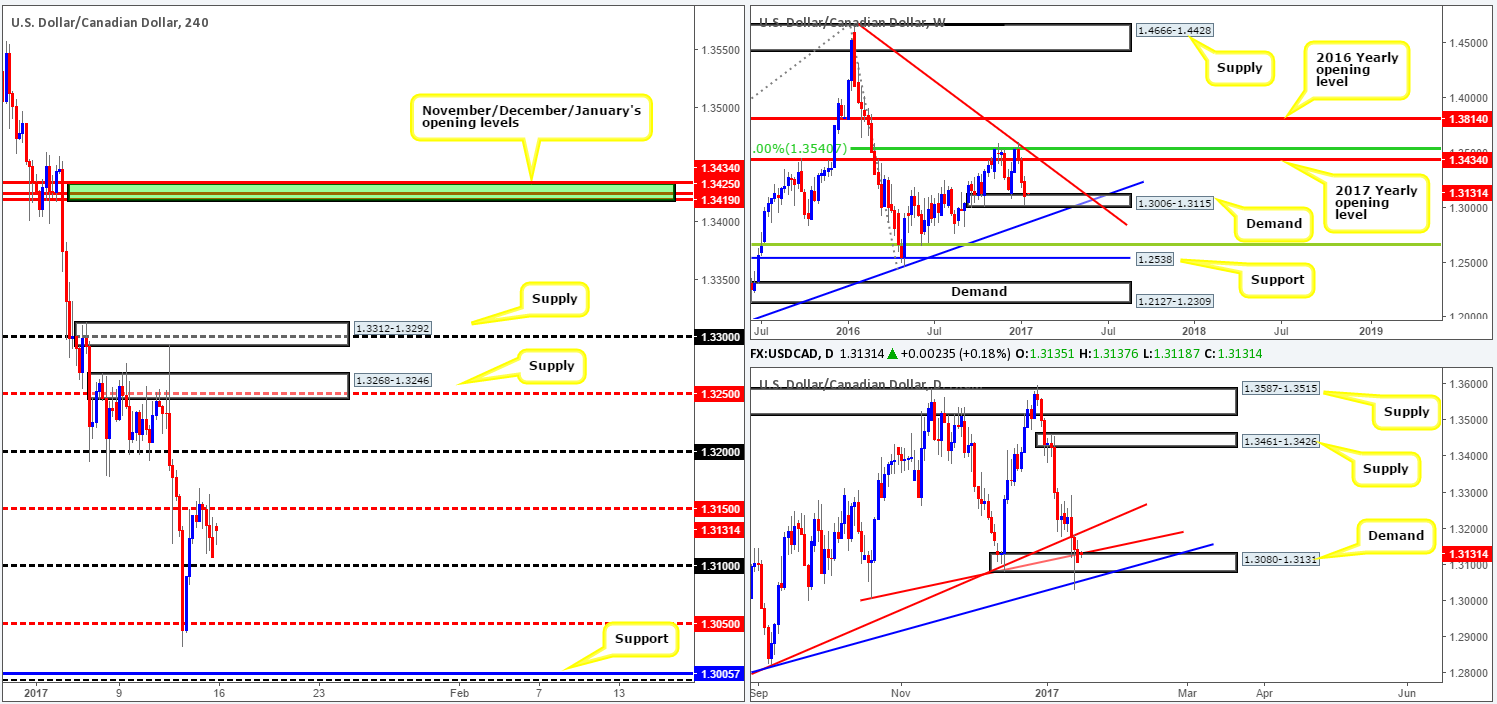
USD/CAD:
Weekly gain/loss: – 129 pips
Weekly closing price: 1.3107
Weekly opening price: 1.3135
Recent weekly action shows that the USD/CAD extended lower for a third consecutive week, consequently forcing the pair deep into weekly demand coming in at 1.3006-1.3115. A bullish reaction from this area could see price connect with the weekly trendline resistance stretched from the high 1.4689. On the other hand, a continuation move south this week may push the unit beyond the current demand and potentially test the weekly trendline support extended from the high 1.1278.
Zooming in and looking at the daily chart, we can see that Friday’s candle engulfed the daily trendline support taken from the low 1.3006 and closed within daily demand at 1.3080-1.3131. In view of Thursday’s aggressive fakeout below this area, we would usually conclude that a break lower is likely on the cards. Nevertheless, lurking only a few pips below this zone is a daily trendline support drawn from the low 1.2654, which, given its history, could provide additional support to the daily demand!
Friday’s action on the H4 chart was relatively lackluster, as the sellers spent the majority of the session easing from the H4 mid-way resistance level at 1.3150, ending the week just ahead of the 1.31 handle. The market gapped over 25 pips north this morning consequently placing the pair mid-range between 1.3150 and 1.31.
Our suggestions: In that both the weekly and daily charts show structure to be reasonably bullish, our team is currently focused on looking for long opportunities. Technically speaking, the 1.31 handle is a good place to begin. It is located within both the current daily and weekly demand areas. Still, given the likelihood of a fakeout through this psychological boundary, we would strongly recommend waiting for the lower timeframes to demonstrate buyer interest here before pressing the buy button (see the top of this report for ideas on how to utilize the lower timeframes for entry).
Data points to consider: There are no scheduled high-impacting news events on the docket today relating to these two markets.
Levels to watch/live orders:
- Buys: 1.31 region ([lower-timeframe confirmation is required here before a trade can be executed] stop loss: depends on where one confirms the zone).
- Sells: Flat (stop loss: N/A).
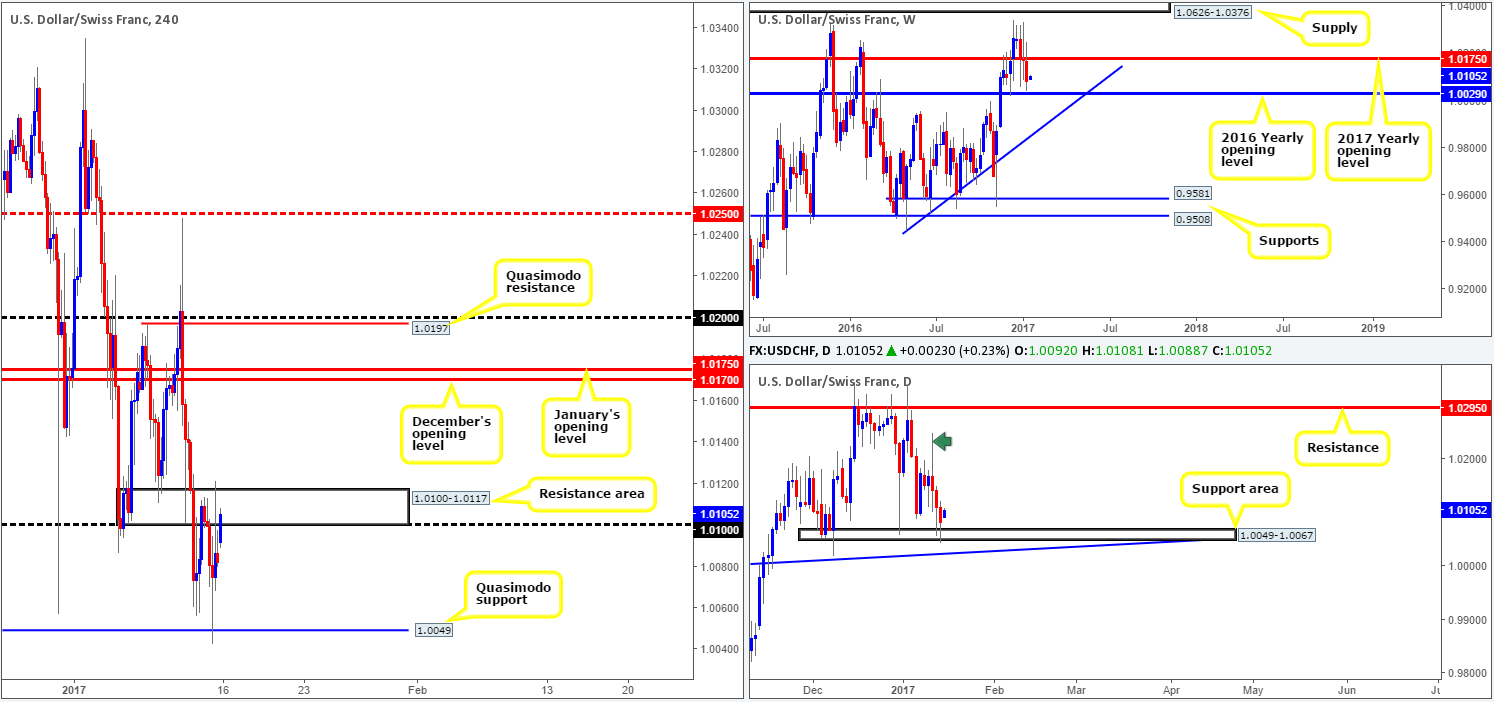
USD/CHF:
Weekly gain/loss: – 91 pips
Weekly closing price: 1.0082
Weekly opening price: 1.0092
Weekly price, as you can see, managed to remain below the 2017 yearly opening level at 1.0175 and end the week closing nearby the 2016 yearly opening level at 1.0029. As far as our desk is concerned, each level is of equal weight so both will be on our radar this week.
The story on the daily chart, however, shows price held firm around the daily support area fixed at 1.0049-1.0067 from Thursday onwards last week. In the event that the bulls remain in the driving seat here, there’s a chance that we may see price tap the daily resistance level coming in at 1.0295 (the daily wick at 1.0248 denotes what we like to call: a supply consumption wick, hence why we believe price could rally as high as 1.0295).
Thanks to this morning’s opening gap north, the H4 candles are once again seen teasing the H4 resistance area coming in at 1.0100-1.0117. There are two cautionary points to consider if one is looking to short from here. Firstly, there was a slight breach of this area on Friday, potentially tapping into stops and weakening the sellers here. Secondly, the daily candles are currently in a bullish position (see above).
Our suggestions: Instead of looking to short from the current H4 resistance zone, we’re watching for a decisive H4 close ABOVE the area. This, followed by a retest and a reasonably sized H4 bull candle would, at least in our book of technical setups, be sufficient enough to permit a long entry, targeting December/January’s opening levels at 1.0175/1.0170 as an initial take-profit target.
Data points to consider: There are no scheduled high-impacting news events on the docket today relating to these two markets.
Levels to watch/live orders:
- Buys: Watch for a H4 close to form above 1.0100-1.0117 and look to trade any retest of this area thereafter ([a reasonably sized H4 bullish close is required following the retest before a trade can be executed] stop loss: ideally beyond the trigger candle).
- Sells: Flat (stop loss: N/A).
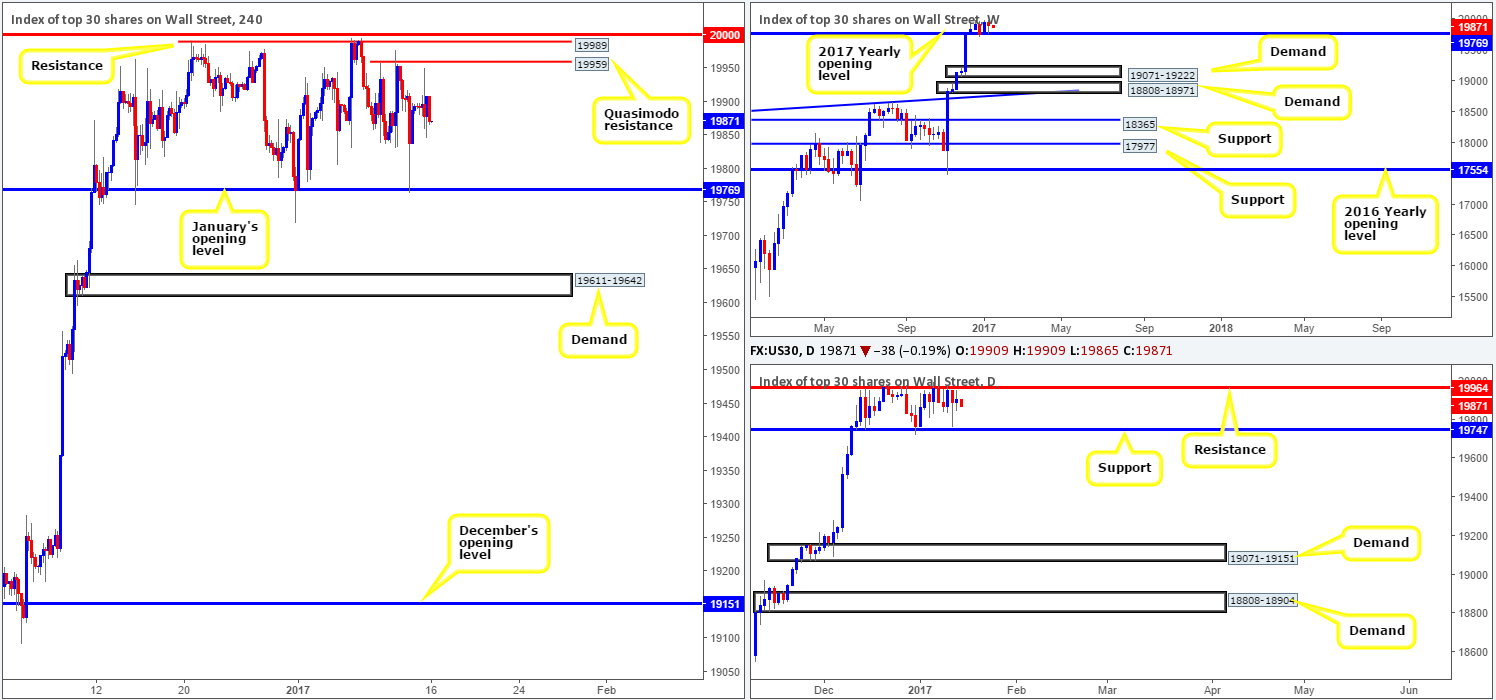
DOW 30:
Weekly gain/loss: – 55 points
Weekly closing price: 19909
Weekly opening price: 19909
Although the week ended in the red, the DOW’s weekly chart printed a healthy-looking weekly buying tail off the 2017 yearly opening level at 19769. From our perspective, this suggests further buying could be on the horizon this week. Before weekly buyers can push to new highs, nonetheless, they’ll have to break through the top edge of the current daily range at 19964.
Stepping across to the H4 chart, one can see that movement was rather lackluster during Friday’s session, consequently forming a daily indecision candle into the close. As such, the next upside targets on this scale remain the same: the H4 Quasimodo resistance level at 19959 and neighboring H4 resistance at 19989. In view of this and the fact that the daily resistance level at 19964 is positioned between the two H4 zones mentioned above, a bearish response from this angle is still expected to be seen. How much of a response is difficult to judge seeing as how the weekly chart shows little resistance on the horizon.
Our suggestions: Despite weekly action effectively being free to rally north, we feel the H4 sell zone: 19989/19959 is worthy of attention. However, pulling the trigger without any supporting lower-timeframe price action is not something we’d be comfortable with (see the top of this report).
Data points to consider: There’s little scheduled on the docket today that will likely cause big moves in this market.
Levels to watch/live orders:
- Buys: Flat (stop loss: N/A).
- Sells: 19989/19959 ([lower-timeframe confirmation is required before a trade can be executed] stop loss: depends on where one confirms the zone).
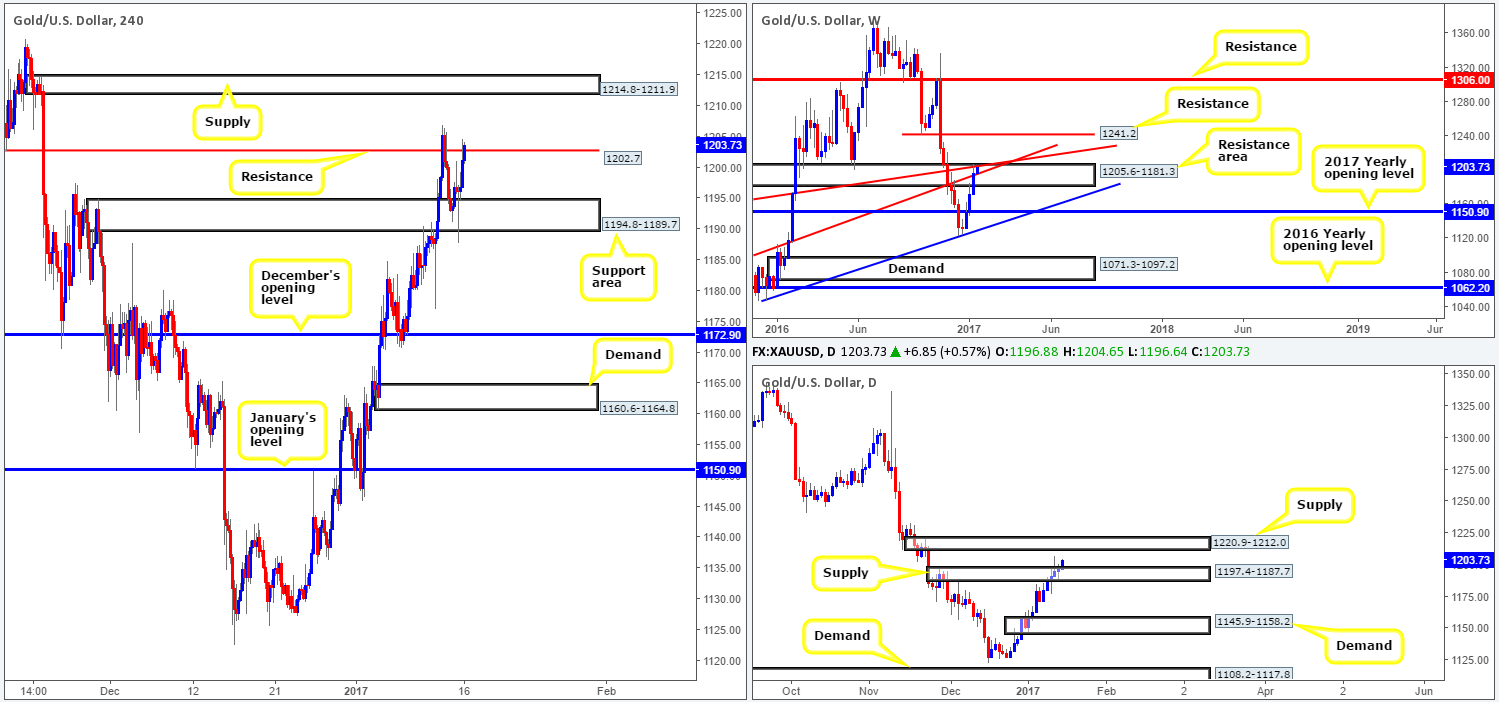
GOLD:
Weekly gain/loss: + $25
Weekly closing price: 1196.8
Weekly opening price: 1196.8
Across the board, the US dollar tanked last week which as we know is typically seen as bullish for commodities. The most recent advance marked the third consecutive weekly gain for the precious metal, and at the same time pushed price action deep into a weekly resistance area formed at 1205.6-1181.3. Not only is this area reinforced by two weekly trendline resistances (1130.1/1071.2), the chart also shows room for the yellow metal to drop down as far as the 2017 yearly opening level at 1150.9. Therefore, one has to be prepared for the possibility of a rotation to the downside this week.
Branching down into the daily timeframe, we can see that daily supply at 1197.4-1187.7 is looking incredibly vulnerable at the moment, which could portend further upside in this market to the daily supply coming in at 1220.9-1212.0 (located just above the top edge of the weekly resistance area).
The H4 chart also shows price recently caught a bid from around the H4 support area at 1194.8-1189.7, propelling bullion up to the H4 resistance marked at 1202.7. As we write, it looks as if this H4 level will be consumed by the next H4 candle. Should this come to fruition, we could see further buying up to H4 supply at 1214.8-1211.9, which happens to be glued to the underside of daily supply at 1220.9-1212.0.
Our suggestions: Based on recent movement, we feel that the yellow metal is heading north to test H4 supply at 1214.8-1211.9 today. This area, in our opinion, is worthy of attention. Not only because it is associated with daily supply at 1220.9-1212.0, but also because the H4 supply itself boasts strong downside momentum and provides big money a nice area to fake price into above the current weekly resistance area.
With the above points in mind, our team has set a pending sell order at 1211.6 and stop set above at 1215.0. We have purposely given the stop-loss order extra breathing space here due to the size of the H4 supply zone.
Levels to watch/live orders:
- Buys: Flat (stop loss: N/A).
- Sells: 1211.6 ([pending order] stop loss: 1215.0).


