
Key risk events today:
China Fixed Asset Investment ytd/y; China Industrial Production y/y; French Flash Services PMI; French Flash Manufacturing PMI; German Flash Manufacturing PMI; German Flash Services PMI; EUR Flash Manufacturing PMI; EUR Flash Services PMI; UK Flash Manufacturing PMI; UK Flash Services PMI; US Flash Manufacturing PMI; UK Bank Stress Test Results; BoE Financial Stability Report.
EUR/USD:
Weekly gain/loss: +0.53%
Weekly close: 1.1118
Weekly perspective:
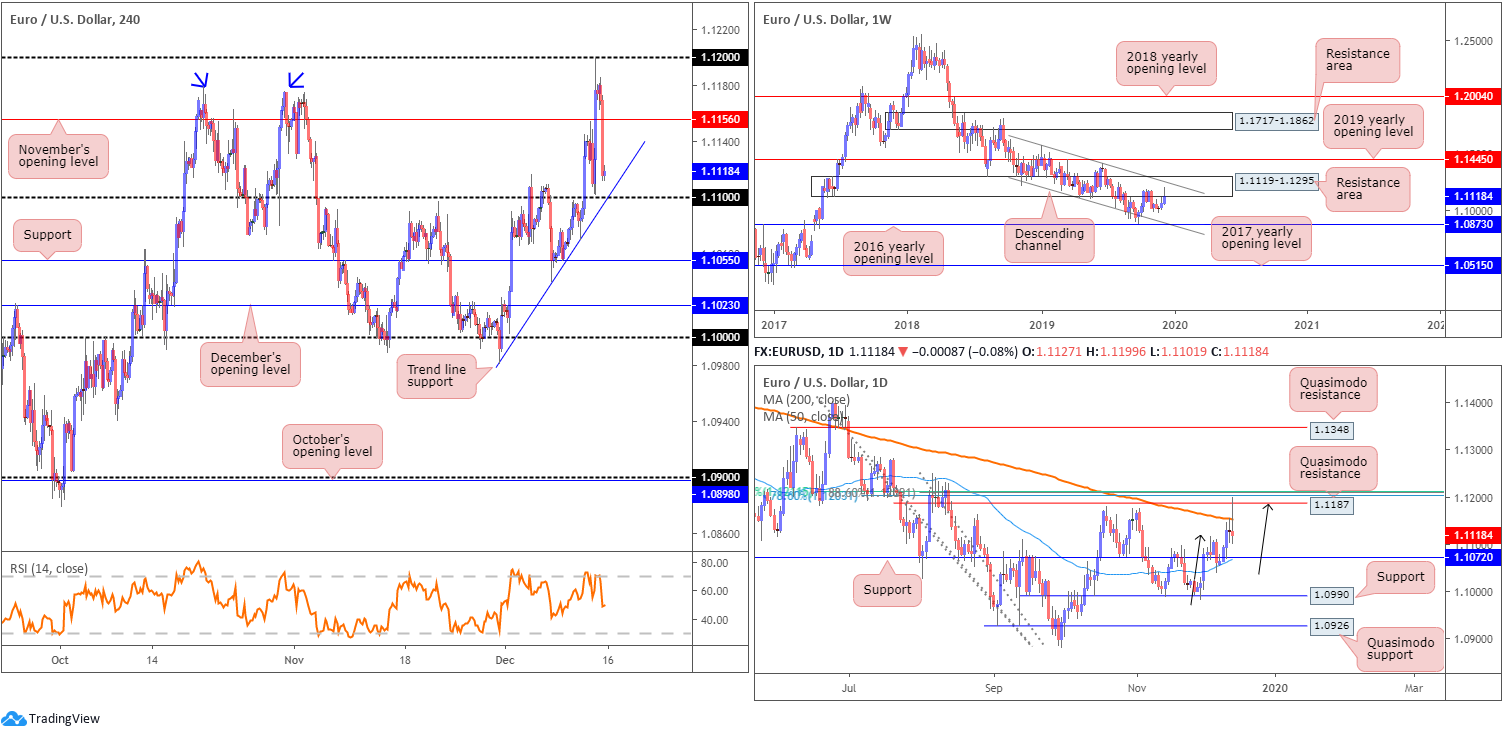
Europe’s single currency concluded the week in positive territory against the buck, consequently extending the prior week’s advance by more than 55 points. The US dollar index, or DXY, initially explored lower ground on dovish FOMC vibes, then US/China Phase 1 and tariff impulses, before UK election exertions pushed the index through 97.00.
Meanwhile, technical research has the pair contained south of a long-standing resistance area at 1.1119-1.1295, which happens to intersect closely with a channel resistance, extended from the high 1.1569. Downside objectives visible from here fall in at the 2016 yearly opening level at 1.0873 and channel support, taken from the low 1.1109.
Daily perspective:
A closer reading of technical movement on the daily timeframe reveals a decisive whipsaw materialised through the 200-day SMA (orange – 1.1153), clocking fresh weekly highs of 1.1199. While a break above the 200-day SMA is typically considered a bullish indicator, Quasimodo resistance at 1.1187, coupled with a Fibonacci cluster nearby around the 1.1206 neighbourhood, held firm and guided price lower. What’s also notable from a technical perspective is the bearish ABCD correction (black arrows) that terminated at the aforementioned Quasimodo resistance.
Support on this timeframe rests at 1.1072/50-day SMA, with a break of this level potentially setting the stage for a push towards support at 1.0990.
H4 perspective:
Following a run above a double-top formation at 1.1176 (blue arrows), and subsequent test of the 1.12 handle, EUR/USD fell sharply Friday. Downside impetus largely fell on the back of US/China trade developments, after President Trump revealed that a Phase 1 deal was in the offing and a late/delayed Beijing press briefing effectively confirmed the agreement.
Overthrowing November’s opening level at 1.1156 with relative ease, the pair wrapped up the week a touch north of the 1.11 handle, which aligns closely with trend line support, etched from the low 1.0981.
Areas of consideration:
Intraday traders will likely have eyes on 1.11 for potential buying opportunities today, knowing it converges with H4 trend line support. The problem, however, is not only are weekly sellers possibly active around the noted weekly resistance area, the daily chart also exhibits space to test 1.1072.
Knowing 1.1072 lurks beneath 1.11, and given psychological levels are prone to fakeouts, the likelihood of a fakeout developing through 1.11 to 1.1072 is high, according to the chart studies. As such, trade 1.11 cautiously.
In the event a fakeout through 1.11 takes form, longs on a H4 close back above the round number could be an option, targeting November’s opening level at 1.1156 as the initial port of call. Granted, this will have you competing with weekly sellers, therefore strict trade management is an absolute must.
GBP/USD:
Weekly gain/loss: +1.50%
Weekly close: 1.3328
Weekly perspective:
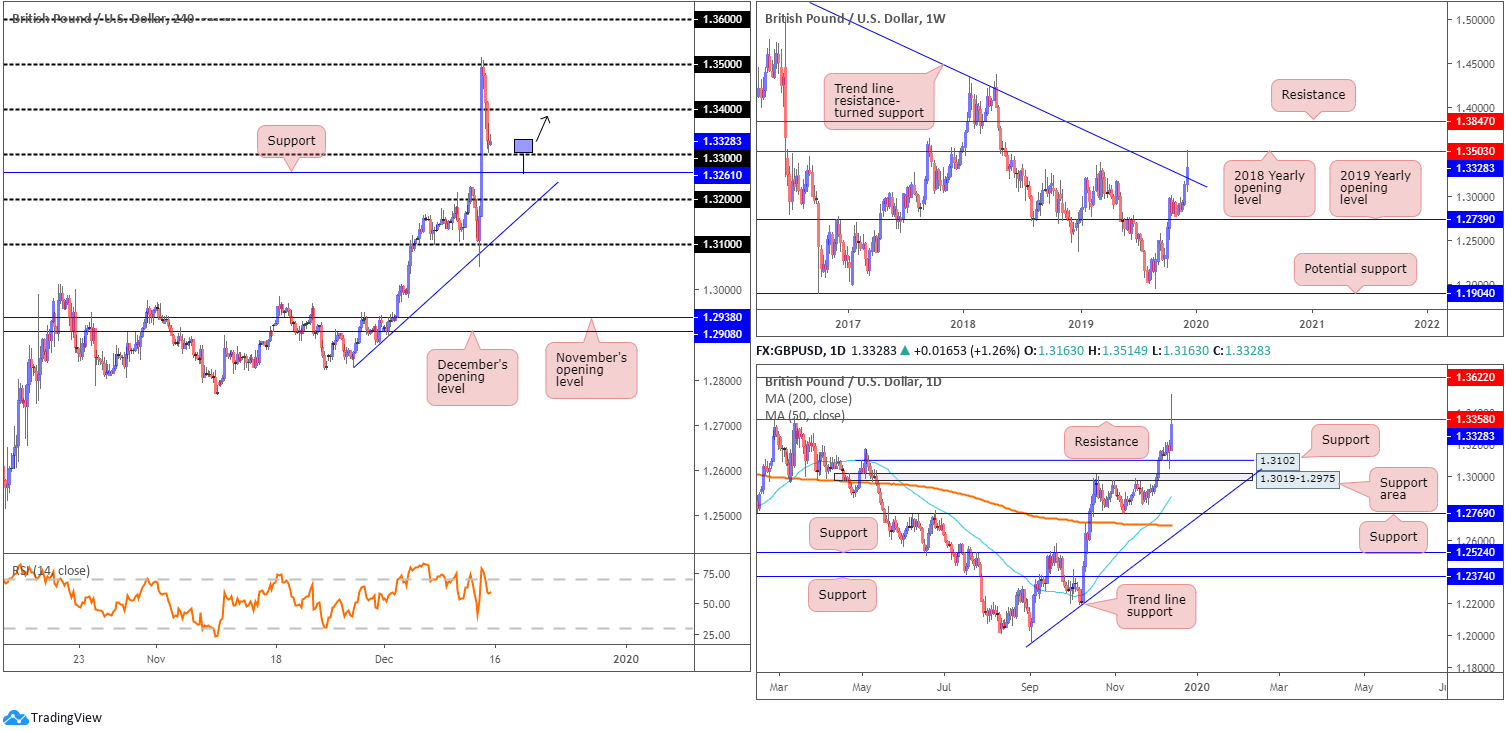
GBP/USD bulls tightened their grip in recent sessions, strengthened on the back of Thursday’s UK General Election, culminating in a clear win for the Conservative Party.
Long-term trend line resistance, extended from the high 1.5930, gave way as a result of recent bidding, leaving the floor open for a test of the 2018 yearly opening level at 1.3503. As evident from the weekly chart, 1.3503 held ground. Further selling could prompt a retest at the recently broken trend line this week, whereas continued buying could eventually shake hands with resistance priced in at 1.3847.
Daily perspective:
Following a retest at support (a prior Quasimodo resistance level) drawn from 1.3102, in the shape of a half-hearted hammer candlestick configuration (considered a bullish signal), GBP/USD aggressively spiked through resistance at 1.3358, challenging highs of 1.3515.
A revisit at the aforementioned support level could be on the cards this week, though a fakeout through this level to a nearby support area at 1.3019-1.2975 is certainly not out of the question. The next upside hurdle beyond the current resistance level can be seen around the 1.3622ish neighbourhood.
H4 perspective:
Friday, based on H4 charting, witnessed 1.35 enter the fold, following earlier gains on UK General Election results. GBP/USD stabilised a few points north of the 1.33 handle Friday, trimming a portion of recent gains and sporting a 200-point decline. Support rests beneath 1.33 at 1.3261.
Areas of consideration:
Knowing H4 support at 1.3261 lurks south of 1.33, a fakeout play may develop today/early week. A whipsaw through 1.33 that trips sell stops, connects with the said support and follows up with a close back above 1.33 is, technically speaking, an appealing basis for bullish themes. A bullish candlestick such as a hammer formation, for example, may be enough to entice strong buyers back into the market (see chart for a visual representation), targeting daily resistance at 1.3358 as the initial upside objective. Using a defined bullish candlestick to identify buyer intent also provides traders entry and risk levels to work with.
AUD/USD:
Weekly gain/loss: +0.50%
Weekly close: 0.6873
Weekly perspective:
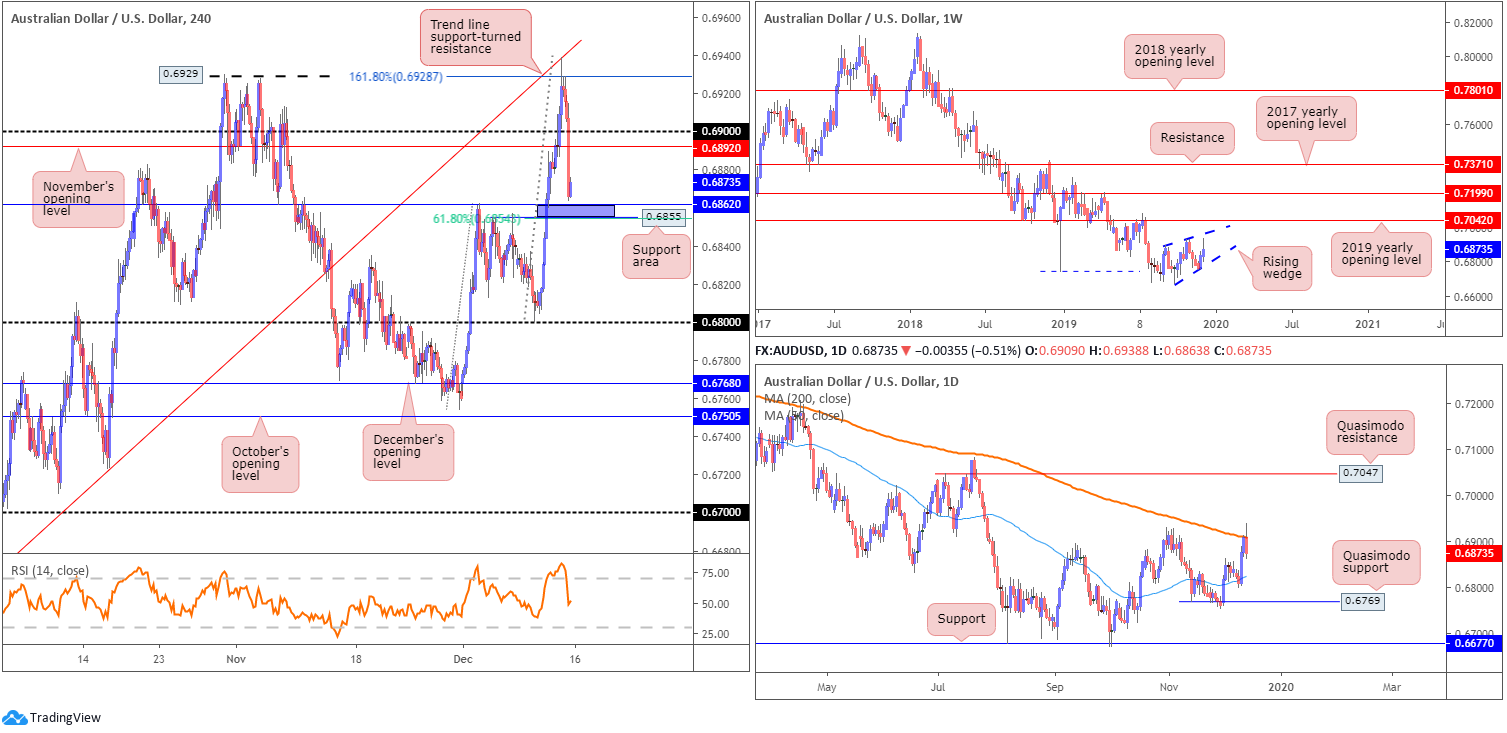
Since registering a bottom in late September at 0.6670, the weekly candles have been busy carving out what appears to be a rising wedge formation, typically considered a continuation pattern. As the 2019 yearly opening level at 0.7042 is seen close by, the aforementioned rising wedge could potentially continue advancing until connecting with this angle.
The primary downtrend, visible from this timeframe, has also been in play since early 2018, consequently adding weight to a breakout south possibly emerging.
Daily perspective:
The story on the daily timeframe reveals the unit recently crossed paths with the 200-day SMA (orange – 0.6909). Note AUD/USD has traded south of the said SMA since April 2019, therefore the dynamic value may continue to offer resistance this week.
In terms of support, the 50-day SMA (blue – 0.6824) is visible, with a break perhaps clearing the river south to Quasimodo support at 0.6769.
H4 perspective:
For traders who read Friday’s technical briefing you may recall the following piece (italics):
Across the page on the H4 timeframe, buy stops above the 0.69 handle were tripped in recent movement, allowing an approach to trend line support-turned resistance, etched from the low 0.6670. In addition to this, resistance also forms by way of the 161.8% Fibonacci ext. point at 0.6928.
The selloff from the said resistances was notable, largely bolstered by a recovery in the US dollar index and a run of buy stops above the 0.6929 high. The round number 0.69 firmly gave way, as did November’s opening level at 0.6892, and wrapped up the week closing a few points ahead of support coming in at 0.6855/0.6862 (purple), which happens to merge with a 61.8% Fibonacci retracement ratio.
Areas of consideration:
Well done to any readers who managed to sell the recent move lower. H4 resistances, coupled with the 200-day SMA, offered a reasonably robust platform to trade.
A bounce from the H4 support area at 0.6855/0.6862 may occur today, though given the force of selling generated from the 200-day SMA, price will unlikely make it past November’s opening level at 0.6892. Therefore, ensure risk/reward metrics favour such a trade before pulling the trigger.
A break south of 0.6855/0.6862, on the other hand, likely unlocks bearish scenarios to the 50-day SMA (daily) and 0.68.
USD/JPY:
Weekly gain/loss: +0.70%
Weekly close: 109.31
Weekly perspective:
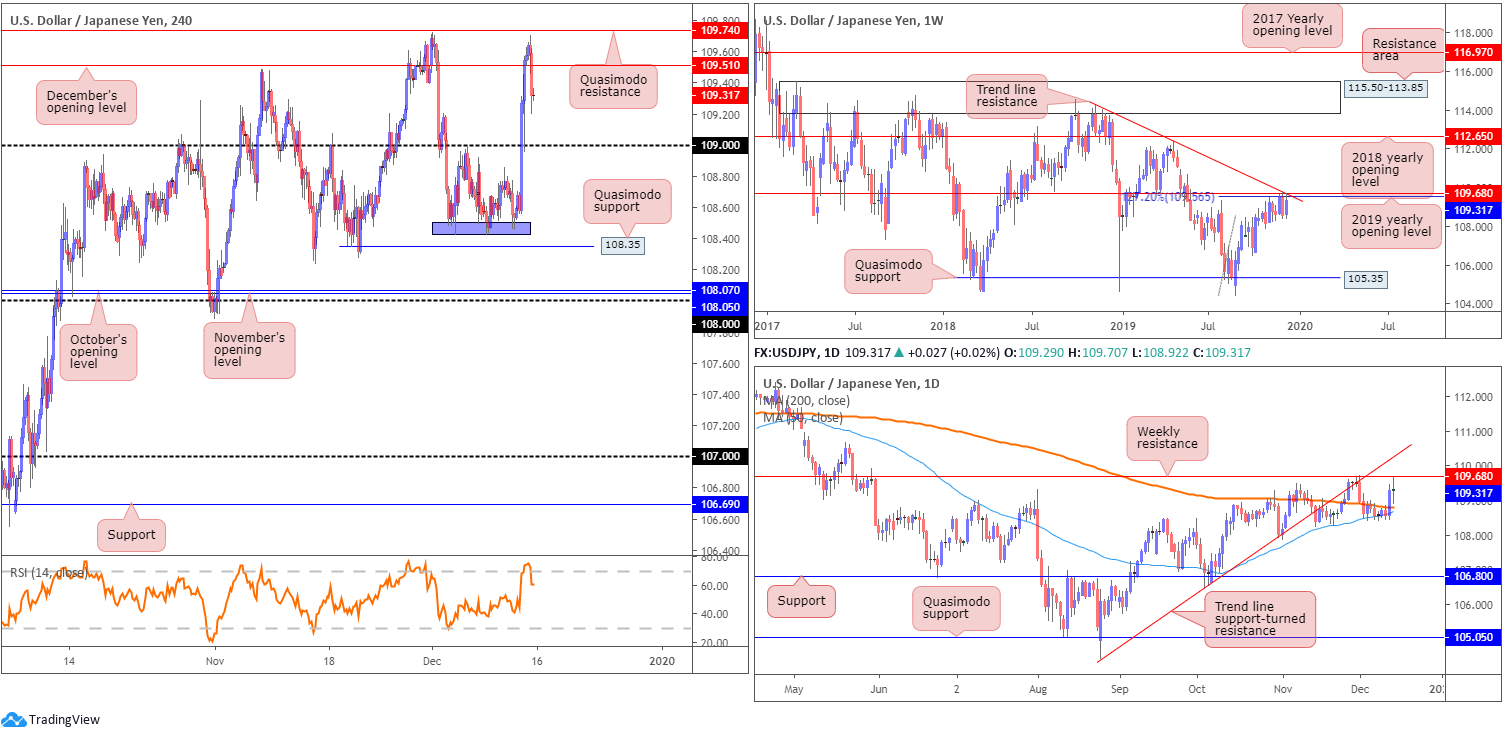
USD/JPY twisted higher over the course of last week, reclaiming a portion of the prior week’s losses and reconnecting with a collection of notable resistances: a 127.2% Fibonacci ext. point at 109.56 (taken from the low 104.44), resistance formed at 109.68, the 2019 yearly opening level and trend line resistance, extended from the high 114.23.
Aside from the 106.48 September 30 swing low, limited support is evident on the weekly timeframe until shaking hands with Quasimodo support at 105.35. A break north, however, highlights the 2018 yearly opening level at 112.65 as the next possible layer of resistance.
In regards to the market’s primary trend, the pair has been entrenched within a range since March 2017, spanning 115.50/105.35.
Daily perspective:
Daily action spent the best part of the week narrowly confined between the 200/50-day SMAs (orange – 108.78/blue – 108.68). Thursday, nevertheless, witnessed a strong bout of buying take form, drawing Friday’s action towards weekly resistance mentioned above at 109.68. Note Friday closed by way of a doji indecision candle.
Beyond the weekly resistance, daily price shows trend line support-turned resistance, extended from the low 104.44, lies in wait.
H4 perspective:
Friday ended trade unmoved, rotating south just ahead of Quasimodo resistance at 109.74 and retaking December’s opening level at 109.51. 109 stands in as the next viable support structure on this scale, with Quasimodo support at 108.35 in view should a break lower develop.
Areas of consideration:
Quasimodo support at 108.35 is an incredibly appealing level for longs. The area of support formed at 108.46 (purple) likely holds sell stops directly beneath, which for bigger players will help provide liquidity to buy from 108.35.
In terms of possible shorting opportunities, a retest at the underside of December’s opening level at 109.51, preferably in the shape of a H4 bearish candlestick variation (entry/risk levels can be determined according to this structure), could be of interest, in light of the current weekly resistances.
USD/CAD:
Weekly gain/loss: -0.62%
Weekly close: 1.3166
Weekly perspective:
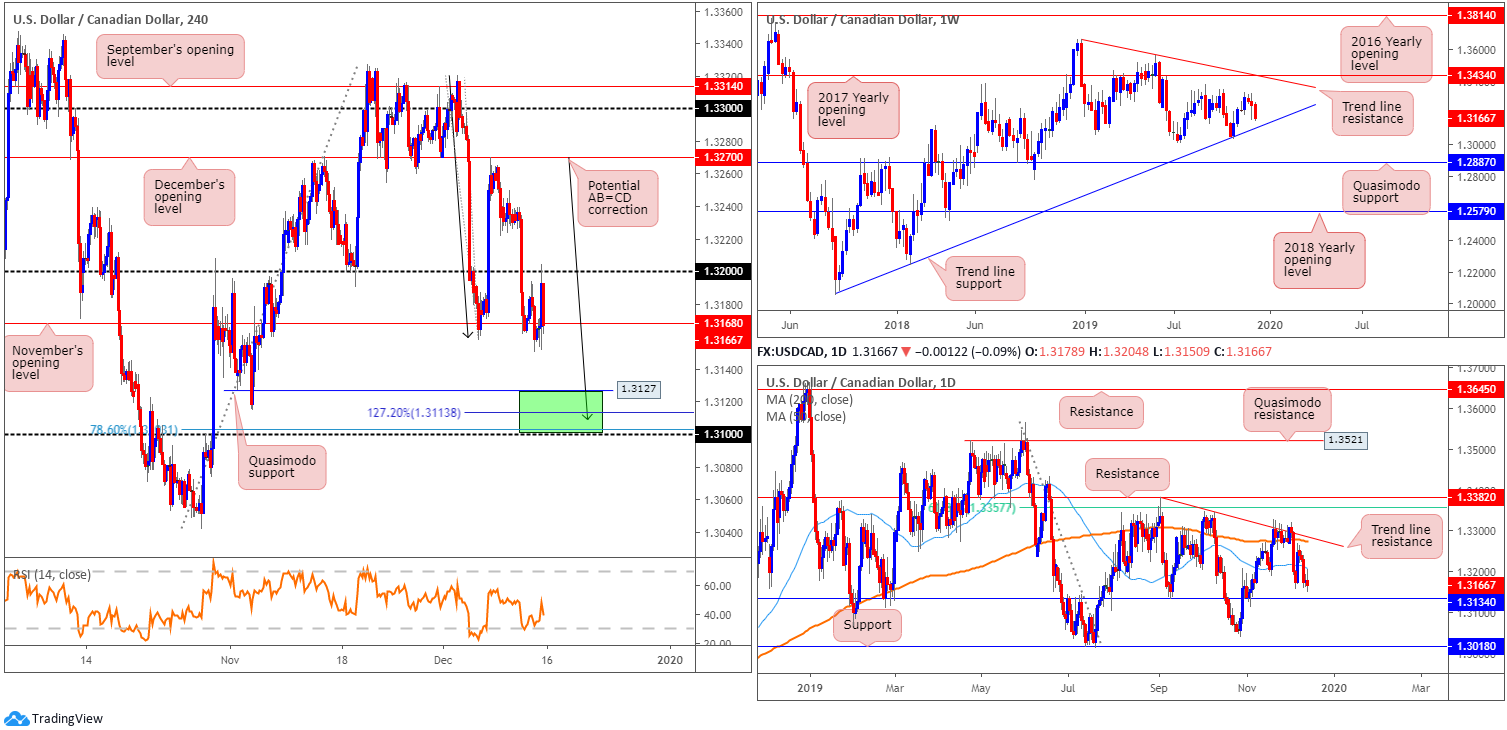
USD/CAD recorded its third successive losing week in recent trade, declining more than 80 points on the session. Structurally, trend line support, extended from the low 1.2061, is prime focus this week. A violation of this ascending base could lead to Quasimodo support at 1.2887 being brought into view.
Regarding resistance points on the weekly scale, traders’ crosshairs are likely fixed on the 2017 yearly opening level at 1.3434 and a trend line resistance, taken from the peak at 1.3661.
Overall, the immediate trend has faced north since bottoming in September 2017, though this move could also be considered a deep pullback in a larger downtrend from the 1.4689 peak in early January 2016.
Daily perspective:
Mid-week witnessed a break beneath the 50-day SMA (blue – 1.3207), which formed resistance towards the end of the week. Daily support comes in at 1.3134. This level boasts incredibly strong history and, therefore, is likely to entice activity this week, if challenged.
H4 perspective:
The 1.32 handle, based on the H4 timeframe, held firm as resistance Friday and saw price marginally close south of November’s opening value at 1.3168. Having seen a failed attempt to reclaim 1.32+ status, this week may deliver Quasimodo support at 1.3127. Closely trailed by the 1.31 handle, a 127.2% Fibonacci extension at 1.3113, a 78.6% Fibonacci retracement ratio at 1.3103 and a symmetrical AB=CD bullish pattern at 1.3109 (black arrows), the green H4 zone is certainly an area worthy of the watchlist this week.
What’s also interesting from a technical standpoint is daily support underlined above at 1.3134 checks in just north of the said H4 support area. In addition, the current weekly trend line support also intersects with the H4 base.
Areas of consideration:
A H4 bullish candlestick signal formed from 1.31/1.3127 today/this week is likely enough to tempt buyers into the market, with an initial upside objective set at November’s opening level 1.3168. The cherry on top of the cake here, however, would be RSI confirmation.
The reason behind requiring additional candlestick confirmation is due to the fact round numbers (1.31) often fall victim to whipsaws (or stop-runs). This just helps avoid the dreaded whipsaw.
USD/CHF:
Weekly gain/loss: -0.63%
Weekly close: 0.9836
Weekly perspective:
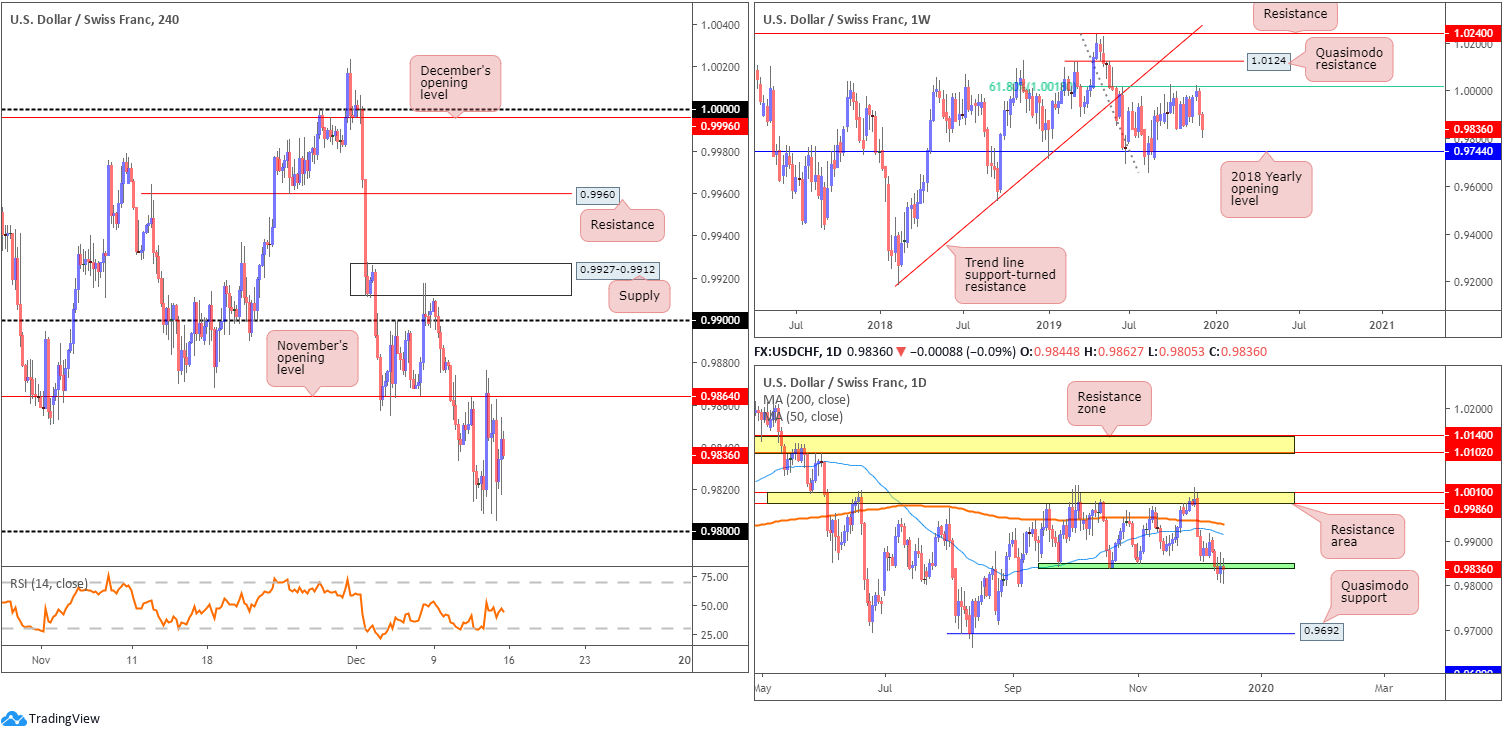
As of mid-June, upside attempts have been capped by a 61.8% Fibonacci retracement ratio at 1.0018. Of late, two decisive bearish candles formed, testing lows of 0.9805. Equally impressive is the 2018 yearly opening level at 0.9744. Capping downside since the beginning of the year, this level is considered the next support target on the weekly scale.
According to the primary trend, price reflects a slightly bullish tone.
Daily perspective:
In conjunction with weekly flow, the lower edge of a 3-month consolidation at 0.9845ish gave way last week. Although back-to-back indecision candles formed late into the session, sellers still appear to have the upper hand here. 0.9744 is the primary downside target on the weekly timeframe, while on the daily timeframe, Quasimodo support coming in at 0.9692 appears a valid target.
H4 perspective:
November’s opening level at 0.9864 remains notable resistance on the H4 timeframe, withstanding multiple upside attempts over the course of last week. With 0.99 left unchallenged, 0.9864 is likely to continue to offer resistance this week.
In terms of confluence, locally there is little on offer from 0.9864. However, knowing both weekly and daily timeframes suggest further selling could be in store this week, a sell from this angle remains a worthy contender.
Areas of consideration:
Simply, keep eyes on 0.9864 for signs of seller intent. This could simply be in the form of a bearish candlestick pattern, a shooting star form, for example. An alternative is to drill down to the lower timeframes and attempt to enter based on local structure, such as a trend line break.
Irrespective of the entry technique, the 0.99 handle is set as the next downside support target in this market.
Dow Jones Industrial Average:
Weekly gain/loss: +0.48%
Weekly close: 28160
Weekly perspective:
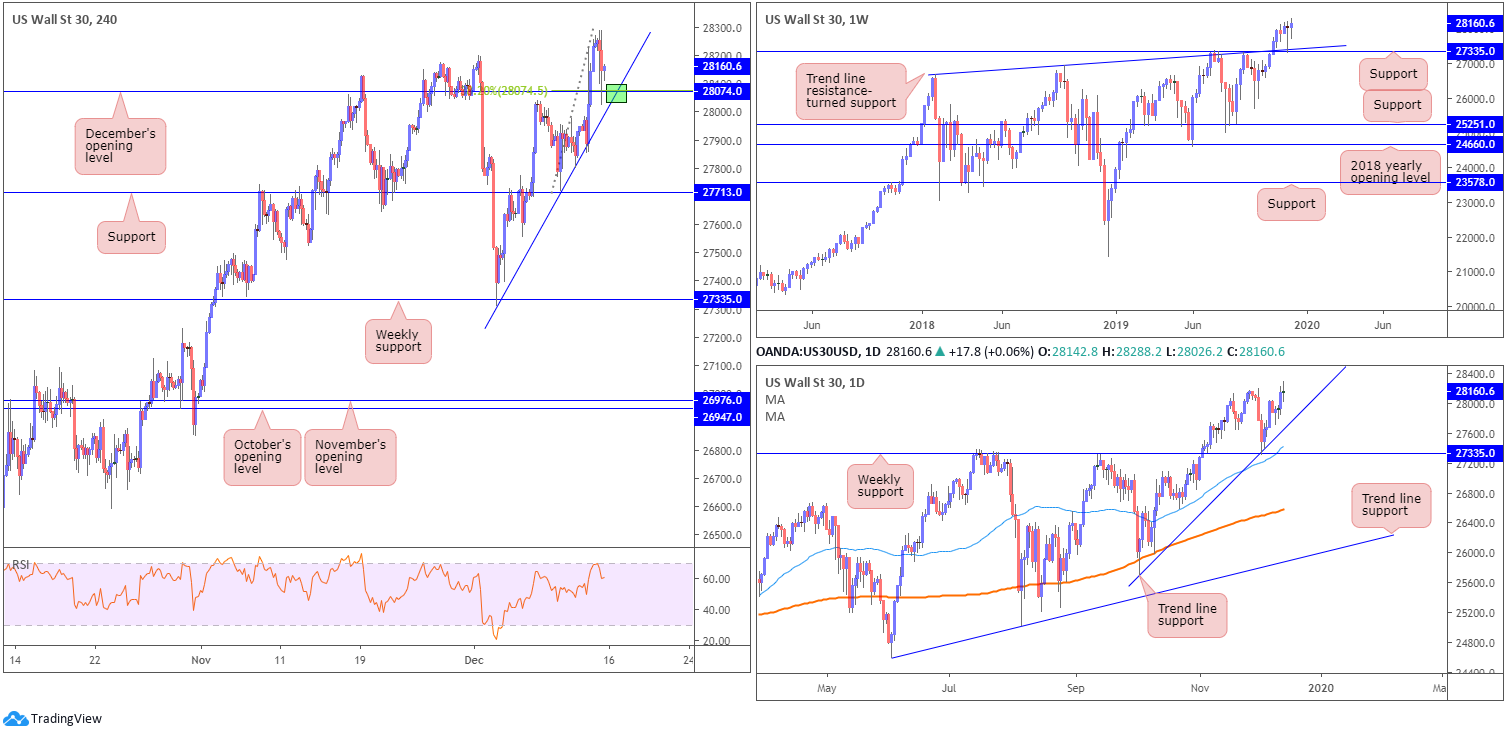
With the prior week leaving traders a strong weekly hammer candlestick formation (considered a buy signal at troughs), formed at the retest of support drawn from 27335, along with trend line support etched from the high 26670, further buying materialised last week, involving fresh record peaks of 28288.
Daily perspective:
Meanwhile, on the daily timeframe, we can see the index clocked fresh all-time peaks by way of a doji indecision candlestick formation. This represents uncertainty and signifies a pullback may be on the cards.
Trend line support, extended from the low 25710, could offer the market a floor this week. A break lower, nonetheless, may contend with the 50-day SMA (blue – 26481) and then weekly support mentioned above at 27335.
H4 perspective:
US equities finished Friday’s session mixed after President Trump and Chinese officials announced a trade pact that includes a rollback of some tariffs. The Dow Jones Industrial Average closed flat, as did the S&P 500; the tech-heavy Nasdaq 100, however, added 20.81 points, or 0.25%.
Friday’s pullback from session highs found support off December’s opening level at 28074 into the close, aligning with a 38.2% Fibonacci retracement ratio and shadowed closely by a local trend line support, taken from the low 27314. Combined (green), these areas may offer intraday buyers an entry into this market.
It might also interest some traders that the relative strength index (RSI) recently struck the 70.00 overbought value and turned lower.
A violation of the current H4 support base could lead to support at 27713 entering the mix this week, which boasts a reasonably close relationship with the current daily trend line support.
Areas of consideration:
The fact we’re trading at record peaks, and entrenched within a monstrous uptrend, the point the H4 trend line support and December’s opening level at 28074 merges is likely on the radar for many today (green). Conservative traders may opt to wait and see if H4 price forms additional candlestick confirmation before pulling the trigger. This is likely to help avoid whipsaws.
XAU/USD (GOLD):
Weekly gain/loss: +1.07%
Weekly close: 1475.6
Weekly perspective:
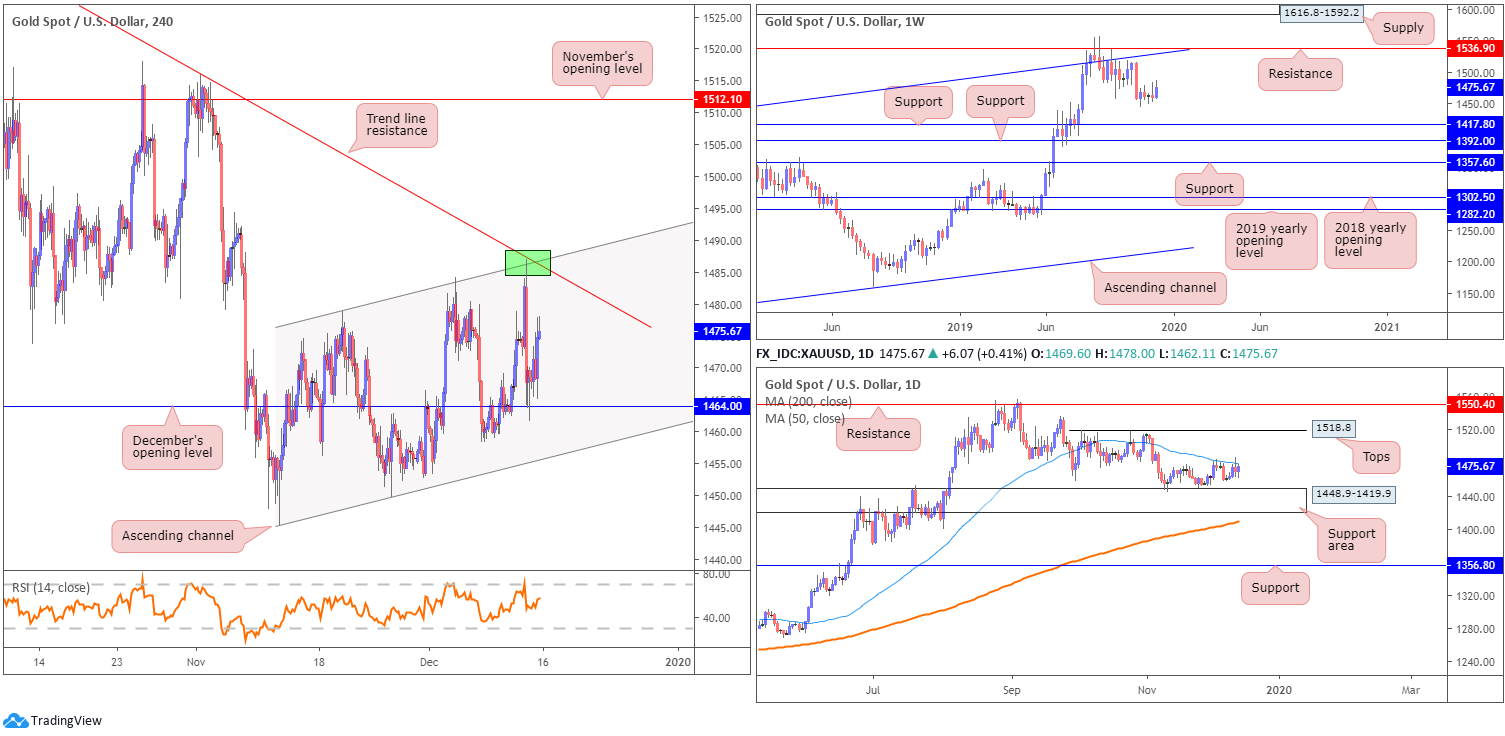
Since connecting with resistance at 1536.9 and channel resistance, extended from the high 1375.1, XAU/USD has been in a mild decline. Further downside from here potentially sets the stage for a move towards two layers of support at 1392.0 and 1417.8.
Overall, however, the primary trend has faced a northerly trajectory since bottoming in early December 2015.
Daily perspective:
The 50-day SMA (blue – 1479.1) continues to offer resistance in this market, hampering upside from the support area coming in at 1448.9-1419.9. A break through the current SMA could lead to an attack at tops around 1518.8, closely followed by resistance at 1550.4. Traders may also benefit in noting the 200-day SMA (orange – 1409.3) is seen crawling north just beneath the aforementioned support zone.
H4 perspective:
Following a near-to-the-point test of channel resistance, taken from the high 1478.8, gold retested December’s opening level at 1464.4 and held north of here into the close. Coupled with trend line resistance (1557.1), the H4 channel resistance was a noted level to watch for shorts during last week. Well done to any readers who managed to take advantage of the selloff generated from here.
Areas of consideration:
As daily price remains capped beneath the 50-day SMA, additional short entries at the current H4 trend line resistance this week may be an option. However, with limited confluence in view, aside from the 50-day SMA, traders are urged to only consider confirmed entries, candlestick confirmation, for example.
The accuracy, completeness and timeliness of the information contained on this site cannot be guaranteed. IC Markets does not warranty, guarantee or make any representations, or assume any liability regarding financial results based on the use of the information in the site.
News, views, opinions, recommendations and other information obtained from sources outside of www.icmarkets.com.au, used in this site are believed to be reliable, but we cannot guarantee their accuracy or completeness. All such information is subject to change at any time without notice. IC Markets assumes no responsibility for the content of any linked site.
The fact that such links may exist does not indicate approval or endorsement of any material contained on any linked site. IC Markets is not liable for any harm caused by the transmission, through accessing the services or information on this site, of a computer virus, or other computer code or programming device that might be used to access, delete, damage, disable, disrupt or otherwise impede in any manner, the operation of the site or of any user’s software, hardware, data or property.


