
Key risk events today:
Japanese banks are closed in observance of Marine Day; China GDP q/y; China Fixed Asset Investment ytd/y; China Industrial Production y/y; FOMC Member Williams Speaks
EUR/USD:
Weekly gain/loss: +0.41%
Weekly close: 1.1269
Weekly perspective:
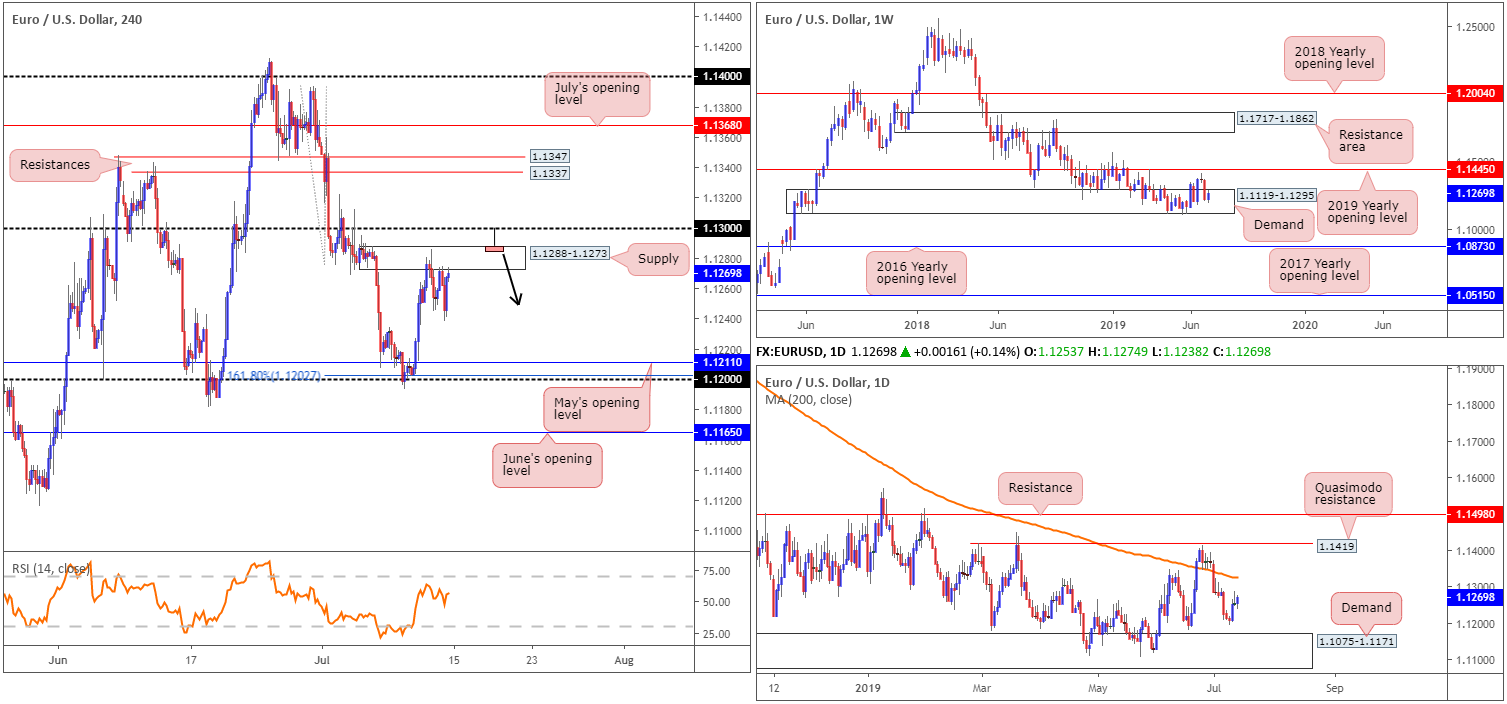
Since November 2018, long-standing demand at 1.1119-1.1295 has capped downside. As impressive as this is, impetus to the upside is lacking as price is unable to overthrow the 2019 yearly opening level (resistance) at 1.1445. Areas outside of the said barriers to be aware of fall in around the 2016 yearly opening level at 1.0873 (support) and a resistance area drawn from 1.1717-1.1862.
As of the week’s close, price action is hovering nearby the top edge of the current demand area, threatening a breakout higher this week.
Daily perspective:
A closer reading of price action on the daily timeframe reveals the unit left demand at 1.1075-1.1171 (formed on May 17, 2017) unopposed early last week and explored higher ground. Further buying from this point has the 200-day SMA (orange – currently trading around 1.1328) to target.
H4 perspective:
EUR/USD prices on the H4 timeframe settled the week around the underside of supply coming in at 1.1288-1.1273, following a brief spell at session lows of 1.1238. Overhead, nearby resistance resides nearby in the form of round number 1.13, with a break higher potentially setting the stage for a run towards the resistance area at 1.1347/1.1337. To the downside, nonetheless, the research team notes support resides at May’s opening level drawn from 1.1211, closely shadowed by a 161.8% Fibonacci ext. point at 1.1202 and the round number 1.12.
Undoubtedly, given recent price movement, traders have short positions beneath the current supply, which, traditionally, calls for protective stop-loss orders to be placed a couple of points above the zone.
Areas of consideration:
In similar fashion to Friday’s technical outlook:
Having seen the H4 candles respond from supply at 1.1288-1.1273, this area has ‘fakeout’ written all over it this week. In other words, a possible run through buy stops above the supply to sellers at 1.13 could be seen for a move lower. Remember, stop-loss orders above the zone are buy orders. Couple this with breakout buy orders as well and traders have themselves a tight collection of liquidity to sell into from 1.13.
An ideal scenario would be for the H4 candles to chalk up a shooting star formation that pierces through the top edge of supply that tests 1.13 (see H4 chart for a visual representation). This, by and of itself, is a reasonably strong sell signal, targeting 1.12/1.1211.
GBP/USD:
Weekly gain/loss: +0.39%
Weekly close: 1.2572
Weekly perspective:
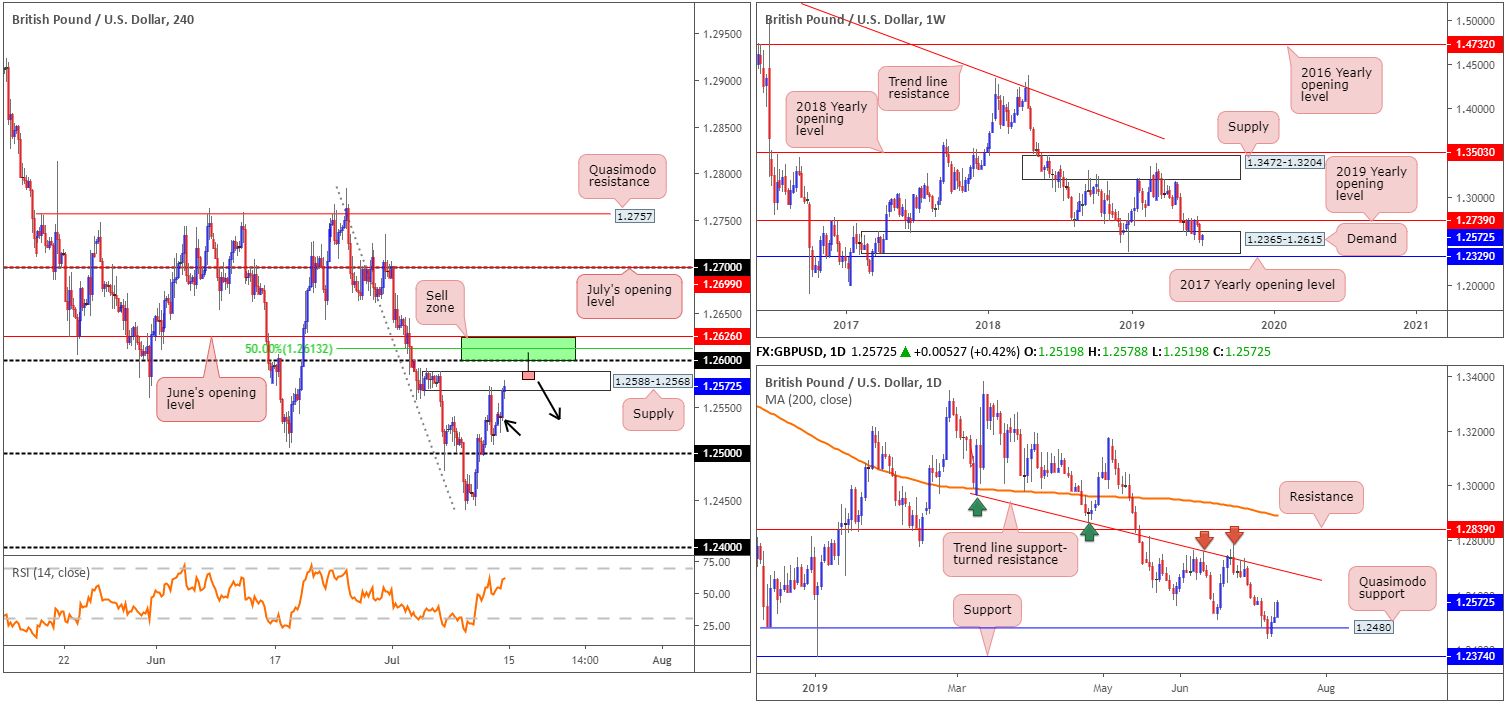
Since May 20, buyers and sellers have been warring for position between long-standing demand at 1.2365-1.2615 and the 2019 yearly opening level at 1.2739 (resistance).
Despite recent movement drilling into the said demand, price action chalked up a reasonably strong recovery candle by way of a hammer formation last week, considered a bullish signal among the candlestick trading community.
Areas outside of the current range to be conscious of falls in around the 2017 yearly opening level at 1.2329 (support) and supply coming in at 1.3472-1.3204.
Daily perspective:
Despite mildly squeezing beneath Quasimodo support at 1.2480 in early trade last week, buyers regained consciousness and modestly recovered, closing the week out in the shape of a near-full-bodied bullish candle. Continued buying from here may stretch as far north as trend line support-turned resistance (extended from the low 1.2960). Note this descending resistance is placed 50 or so points above the 2019 yearly opening level on the weekly timeframe at 1.2739.
H4 perspective:
Strengthened on the back of USD selling across the board Friday, the British pound rose higher and revisited supply fixed from 1.2588-1.2568. What’s interesting from a technical perspective is the area residing north of the supply. Comprised of June’s opening level at 1.2626, a 50.0% retracement at 1.2613 and the round number 1.26 (1.2626/1.26), this area likely has active sellers within. Whether or not this zone will be enough to produce anything sizeable to the downside, though, is tough to decipher, knowing both weekly and daily timeframes propose further upside may be on the menu this week.
Areas of consideration:
In similar fashion to the EUR/USD, the research team believes the current H4 supply area at 1.2588-1.2568 is pleading to be ‘faked’ this week. Evidently, traders clearly have short positions beneath the said supply, with protective stop-loss orders likely placed a couple of points above its upper edge. This, given the stop-loss orders are effectively buy orders, coupled with breakout buyers’ orders, provides a tight consolidation of liquidity to sell into from the 1.2626/1.26 region this week.
An ideal scenario would be for the H4 candles to chalk up a shooting star formation that pierces through the top edge of the aforementioned supply that tests 1.2626/1.26 (see H4 chart for a visual representation). This, by and of itself, is a reasonably strong sell signal, targeting the nearest demand formed on approach, which at this point is around 1.2550 (black arrow).
AUD/USD:
Weekly gain/loss: +0.58%
Weekly close: 0.7017
Weekly perspective:
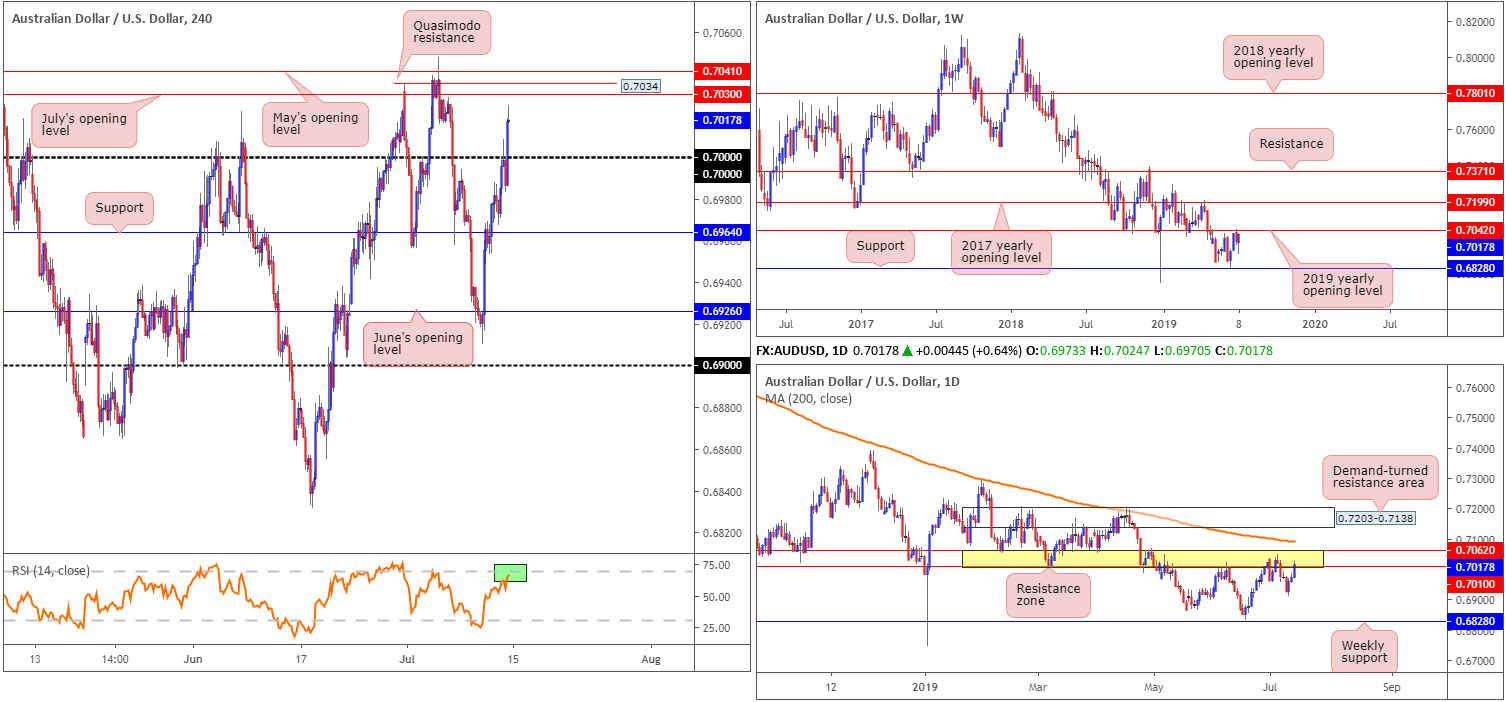
Although the 2019 yearly opening level at 0.7042 entered the fray two weeks ago and capped upside, sellers failed to capitalise on this move last week. Robust buying emerged at 0.6910, producing a reasonably strong buying tail, and ended the week within striking distance of 0.7042.
Technically, 0.7042 remains a resistance of note, having seen it serve well as support on a number of occasions in the past. Therefore, it is still worth keeping tabs on support at 0.6828 should we press lower. In the event we push north this week, however, traders may wish to note the 2017 yearly opening level as the next upside target at 0.7199.
Daily perspective:
In terms of daily flow, current resistance forms by way of two resistances at 0.7062/0.7010 (yellow), effectively surrounding the 2019 yearly opening level on the weekly timeframe at 0.7042. Aside from possible support emerging from Wednesday’s low of 0.6910, the next downside target on this scale also resides at weekly support drawn from 0.6828.
It may also interest some traders to note the 200-day SMA (orange – 0.7091) is lurking just north of the current daily resistance area, in the event we explore higher ground this week.
H4 perspective:
Upbeat data out of China coupled with the US dollar cranking lower across the board Friday witnessed the commodity-linked currency discover higher ground, consequently dethroning key figure 0.70 on the H4 timeframe.
According to the overall technical structure in this market, the ducks may be lining up for a potential pullback this week. On the weekly timeframe we have the unit meandering nearby 0.7042 and daily price engaging with a resistance area at 0.7062/0.7010. H4 structure, on the other hand, thanks to recent buying, concluded the week within shouting distance of May’s opening level at 0.7041, a Quasimodo resistance at 0.7034 and July’s opening level at 0.7030 (0.7041/0.7030). In addition to this, the RSI is nearing its overbought value (green).
Areas of consideration:
On account of the above reading, we know that before sellers make an appearance, price action could potentially test the upper limit of the daily resistance area at 0.7062. Therefore, 0.7041/0.7030 on the H4 timeframe could suffer a fakeout, as could the weekly resistance at 0.7042. To help overcome this, traders are urged to wait and see if H4 action chalks up a bearish candlestick signal before pulling the trigger. Not only does this help identify seller intent, it also helps define entry and risk levels. The initial downside target for sellers is likely set around 0.70.
USD/JPY:
Weekly gain/loss: -0.52%
Weekly close: 107.89
Weekly perspective:
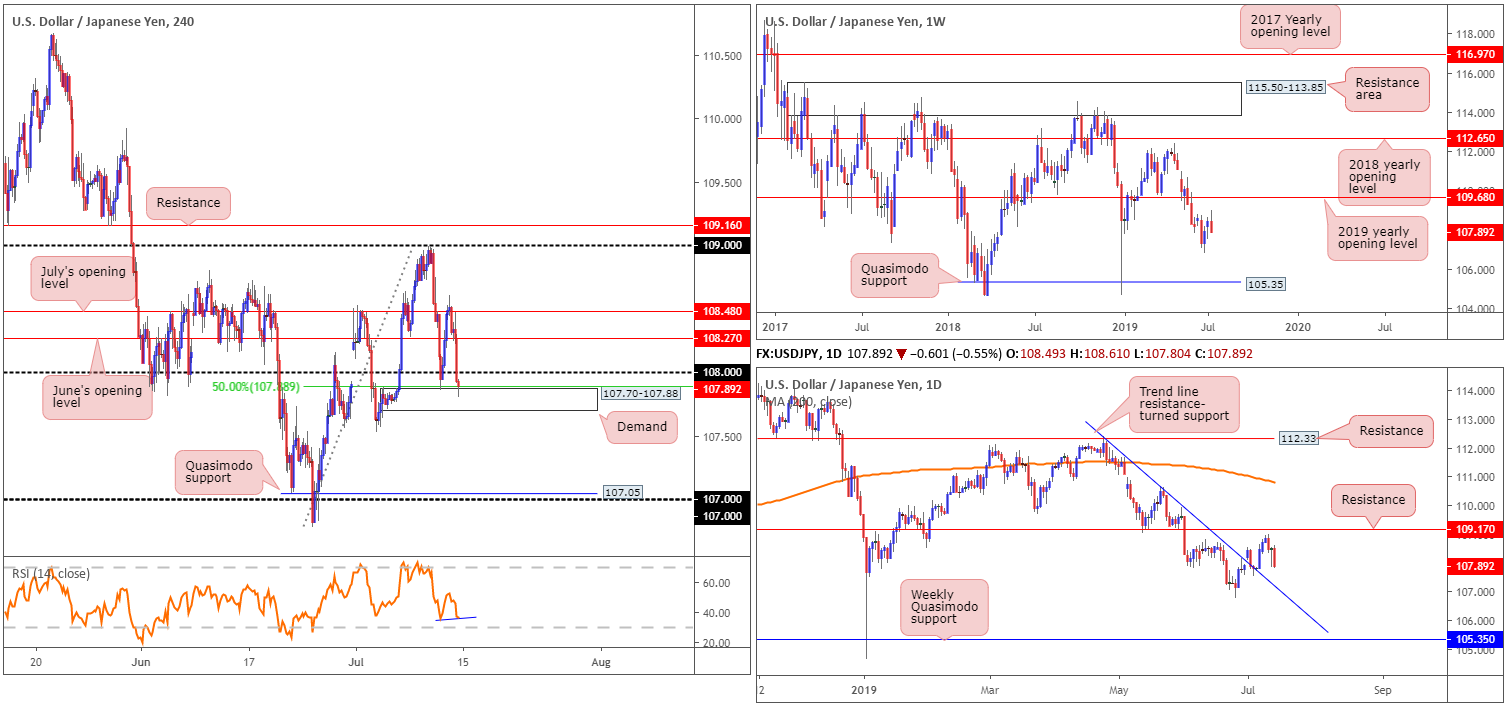
Breaking a two-week bullish phase, the US dollar rotated lower against the Japanese yen last week, engulfing the preceding candlestick’s body and erasing more than 55 points. According to technical structure on the weekly timeframe, resistance is set by way of the 2019 yearly opening level at 109.68 and support is not expected to emerge until reaching a Quasimodo formation at 105.35.
Daily perspective:
Mid-week trading observed the USD/JPY decline in value, leaving resistance at 109.17 unchallenged. The next port of call, in terms of support, can be seen in the form of a trend line resistance-turned support (extended from the high 112.40). Beyond here, the 106.78 June 25 low is seen, followed then by the weekly Quasimodo support mentioned above 105.35.
H4 perspective:
Dollar bulls failed to capitalise on Thursday’s strong rebound out of demand at 107.70-107.88 on Friday, declining to fresh session lows and revisiting the said demand area into the close.
Bolstered by a 50.0% retracement level at 107.88, the current H4 demand and the RSI chalking up mild positive divergence (blue line), a move back above 108 may be on the cards. Before pressing the buy button, though, do take into account both weekly and daily timeframes display room to explore lower ground, and scope above 108 is limited with July and June’s opening levels seen nearby at 108.48 and 108.27, respectively.
Should the noted demand fail to hold price, Quasimodo support at 107.05 is seen as the next downside target on this scale, shadowed closely by the 107 handle.
Areas of consideration:
Although buying above 108 may appeal to some traders, further selling appears the more likely path this week. A H4 close below H4 demand at 107.70-107.88, preferably followed up with a retest in the shape of a bearish candlestick configuration, may fuel a move towards the H4 Quasimodo support at 107.05. Note this level also aligns closely with the daily trend line resistance-turned support.
USD/CAD:
Weekly gain/loss: -0.40%
Weekly close: 1.3026
Weekly perspective:
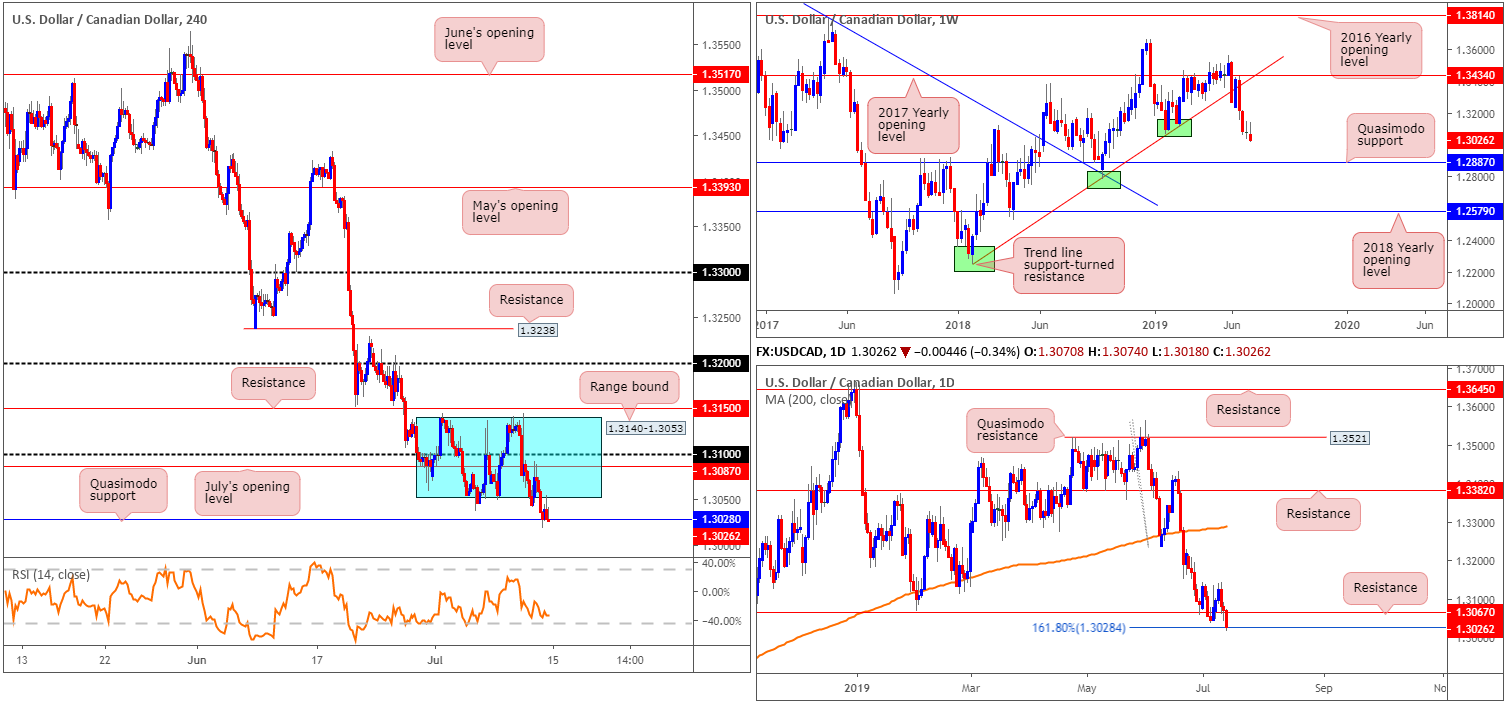
Since coming into close contact with the 2017 yearly opening level at 1.3434 mid-June, selling has been at the forefront of this market. Limited support is evident on the weekly timeframe until reaching a Quasimodo formation at 1.2887. For that reason, traders can potentially expect further downside to materialise this week.
Daily perspective:
Support at 1.3067 offered mild respite to the market since late June, though gave way in reasonably strong fashion Friday. The last line of defence for buyers on this timeframe, until the path is clear for a run to the aforementioned weekly Quasimodo support, is the 161.8% Fibonacci ext. point at 1.3028 which also entered the mix Friday. To confirm buyer intent here, the research team notes to watch for a daily close above resistance at 1.3067 to form.
H4 perspective:
Since the beginning of the month, the H4 candles have been busy carving out a consolidation zone between 1.3140-1.3053, which incorporates the 1.31 handle and also July’s opening level at 1.3087.
Friday saw the dollar index reclaim 97.00 to the downside and WTI prices secure marginal gains, consequently nudging the USD/CAD beneath the said consolidation to a Quasimodo support at 1.3028. Note this Quasimodo also aligns with the 161.8% daily Fibonacci ext. point highlighted above.
Areas of consideration:
Entering long in this market, particularly at current price, is an incredibly chancy move, according to technical structure presented here.
A long from the H4 Quasimodo support at 1.3028, knowing it aligns with daily Fibonacci studies, may appeal to some traders, though given resistance seen forming from the lower edge of the H4 range at 1.3053, bids appear lacking.
Instead of attempting to buy, traders may want to consider selling beneath the noted H4 Quasimodo, with an ultimate downside target set at the weekly Quasimodo support 1.2887. At its most basic, traders have two options: either sell the breakout candle beneath 1.3028 and position a protective stop-loss order above the candle’s upper shadow, or wait and see if a retest at 1.3028 as resistance forms following a break lower (traders can then enter based on the rejecting candle’s structure).
USD/CHF:
Weekly gain/loss: -0.74%
Weekly close: 0.9838
Weekly perspective:
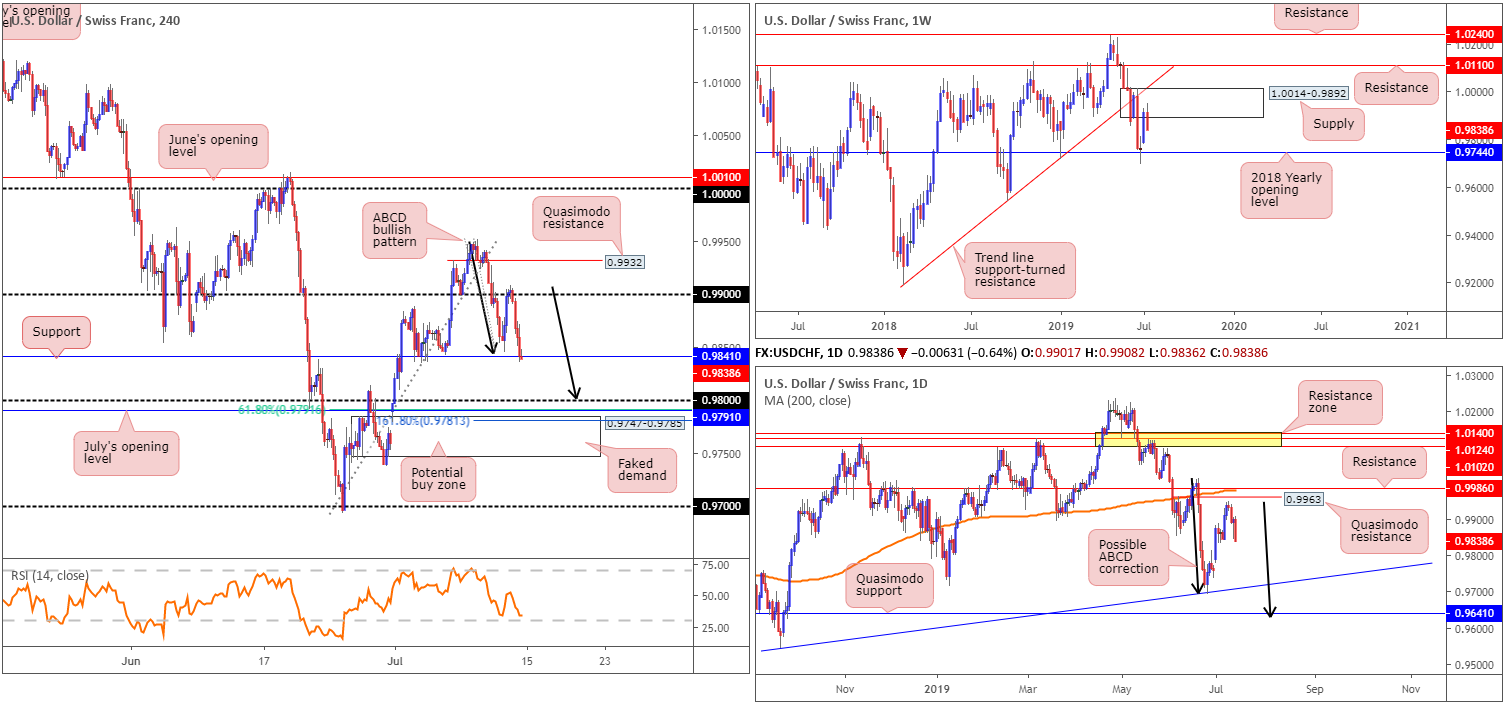
The US dollar surrendered a portion of recent gains off the 2018 yearly opening level at 0.9744 last week, following a rotation lower out of supply at 1.0014-0.9892. While this could lead to a revisit of 0.9744, traders may also find use in noting the trend line support-turned resistance (extended from the low 0.9187), closely followed by resistance at 1.0110, should we turn higher this week.
Daily perspective:
Leaving Quasimodo resistance at 0.9963 unopposed, the daily candles turned south last week. With respect to the next support target, trend line support extended from the low 0.9542 may be an option, followed then by Quasimodo support at 0.9641. What’s also notable from a technical perspective here is the ABCD bullish formation at 0.9629 (black arrows).
H4 perspective:
Friday failed to capitalise on the post-US CPI rebound, coming under pressure from 0.99 in the early hours of trade and marginally closing beneath support at 0.9841. Should further downside occur, the 0.98 handle is next in the firing range as potential support, closely trailed by July’s opening level at 0.9791 and a 61.8% Fibonacci retracement value as well as a ‘faked’ demand zone at 0.9747-0.9785. Another interesting point to note is the approach to 0.99. Should continued selling be seen, an ABCD bullish pattern will complete at 0.99 (black arrows), with its 161.8% Fibonacci ext. point residing within the upper boundary of 0.9747-0.9785 at 0.9781.
Areas of consideration:
Longer-term flow suggests selling could be in store. Not only do we have room to explore lower levels on the daily timeframe, we’re also coming from a weekly supply at 1.0014-0.9892.
Medium-term flow, on the other hand, may witness a bounce higher from the 0.98 region on the H4 scale. Generally, when considering ABCD patterns, which merges with 0.98, the first take-profit target can be drawn from the 38.2% Fibonacci retracement of legs A-D. However, traders interested in buying 0.98 are also urged to take into account we could witness a fakeout into 0.9747-0.9785 before rotating higher. Stop-loss placement, therefore, is best positioned beneath this zone at 0.9747.
Dow Jones Industrial Average:
Weekly gain/loss: +1.53%
Weekly close: 27303
Weekly perspective:
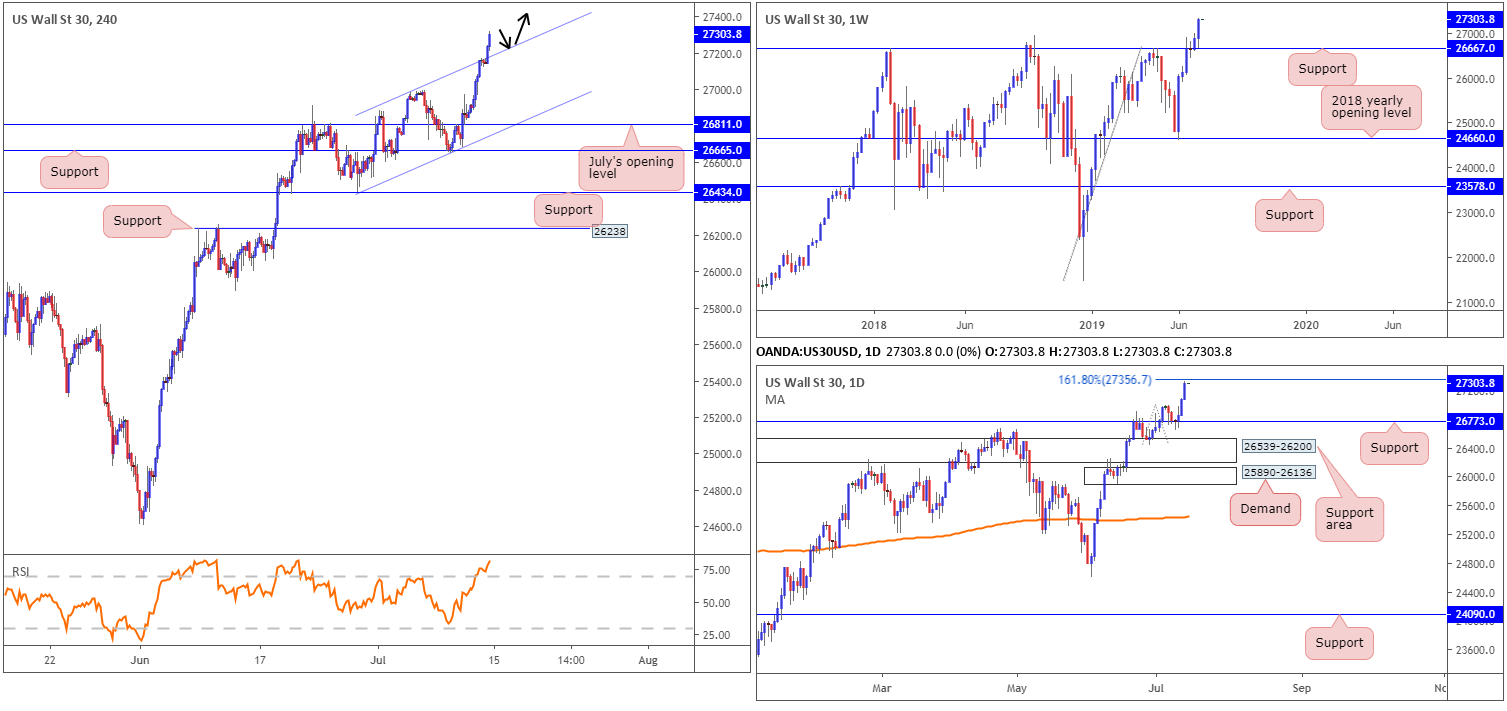
Aside from a brief spell of indecision three weeks back, the Dow Jones Industrial Average has emphasised a strong bullish tone since shaking hands with the 2018 yearly opening level at 24660 in early June. Taking out resistance at 26667 and shortly after retesting it as support propelled the index to fresh record highs of 27321 last week. With limited resistance in sight until connecting with 28070 (not visible on the screen), a 127.2% Fibonacci ext. point taken from the low 21425, additional buying could be seen over the coming weeks.
Daily perspective:
In similar fashion to weekly structure, price action retested support at 26773 in the shape of a hammer formation and advanced to fresh record highs. Resistance on the daily timeframe may enter the fold early this week off the 161.8% Fibonacci ext. point at 27356.
H4 perspective:
US equities hit fresh highs Friday, a day after the Dow closed above 27,000 points for the first time, as investors pushed shares higher on optimism the Federal Reserve will soon cut its benchmark interest rate. The Dow added 0.90%, while the S&P 500 also added 0.46% and the tech-heavy Nasdaq 100 advanced 0.59%.
Technically, we broke above the ascending channel’s upper limit Friday, extended from the high 26972. With the 161.8% Fibonacci ext. point at 27356 marked as possible resistance on the daily timeframe, the unit may pullback and retest the recently broken channel resistance-turned support for a move higher today/early week.
Areas of consideration:
With the index strongly entrenched within an uptrend at present, entering short from 27356 is chancy on the daily timeframe. Instead, as briefly highlighted above, focus has shifted to a potential retest of the H4 channel resistance-turned support. To be on the safe side, traders are encouraged to wait for a H4 bullish candlestick formation to develop before entering long (entry and risk levels can be determined according to the candle’s structure). This is simply due to the possibility of selling entering the market off 27356.
XAU/USD (GOLD):
Weekly gain/loss: +1.13%
Weekly close: 1415.3
Weekly perspective:
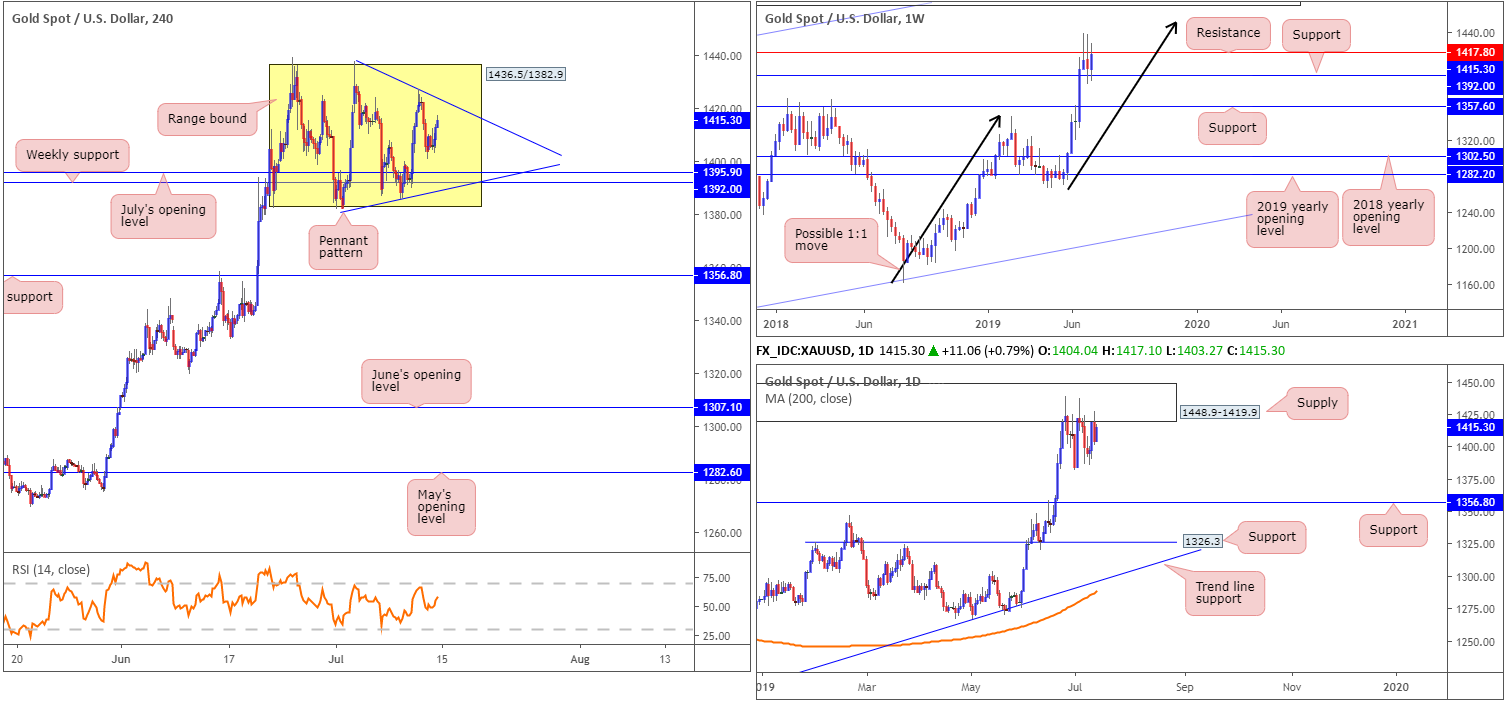
Resistance at 1417.8 held ground again last week, though failed to dethrone nearby support at 1392.0. Further upside from this point could eventually cross paths with a 1:1 correction (black arrows) around 1453.2 shaped from the 1160.3 August 13 low, whereas a move sub 1392.0 has another layer of support in view at 1357.6.
Daily perspective:
The story on the daily timeframe has the candles testing the lower edge of a supply zone at 1448.9-1419.9. Note the weekly resistance level at 1417.8 resides just beneath the said supply zone. And as we already know from the weekly timeframe, support at 1392.0 is proving a troublesome barrier to overcome, but in the event we do push lower, daily support is seen around 1356.8.
H4 perspective:
Seeing as we remain range bound on the H4 timeframe, Friday’s outlook remains unchanged:
Overall, the H4 candles have been carving out a consolidation between 1436.5/1382.9 since June 25, bolstered by weekly support at 1392.0 and July’s opening level on the H4 timeframe at 1395.9. Another development to potentially consider is the pennant pattern (blue levels – 1437.7/1381.9). This is generally considered a continuation pattern, and therefore may eventually pressure the unit to the upside.
Areas of consideration:
Also taken from Friday’s briefing:
As of current market structure on the H4, daily and weekly timeframes, the research team notes limited opportunity to trade at present. Aside from the daily timeframe suggesting a move lower from supply at 1448.9-1419.9, both the H4 and daily timeframes are in a range and in need of a breakout.
With that being said, traders may wish to attempt to trade between the H4 range limits, either the rectangle formation between 1436.5/1382.9 or the current H4 pennant pattern. Either way, it is wise to ensure you have reasonable risk/reward in place before pulling the trigger, and preferably confirmed by bullish/bearish candlestick structure (entry and risk levels can then be determined according to its extremes).
The accuracy, completeness and timeliness of the information contained on this site cannot be guaranteed. IC Markets does not warranty, guarantee or make any representations, or assume any liability with regard to financial results based on the use of the information in the site.
News, views, opinions, recommendations and other information obtained from sources outside of www.icmarkets.com.au, used in this site are believed to be reliable, but we cannot guarantee their accuracy or completeness. All such information is subject to change at any time without notice. IC Markets assumes no responsibility for the content of any linked site.
The fact that such links may exist does not indicate approval or endorsement of any material contained on any linked site. IC Markets is not liable for any harm caused by the transmission, through accessing the services or information on this site, of a computer virus, or other computer code or programming device that might be used to access, delete, damage, disable, disrupt or otherwise impede in any manner, the operation of the site or of any user’s software, hardware, data or property.


