
DXY:
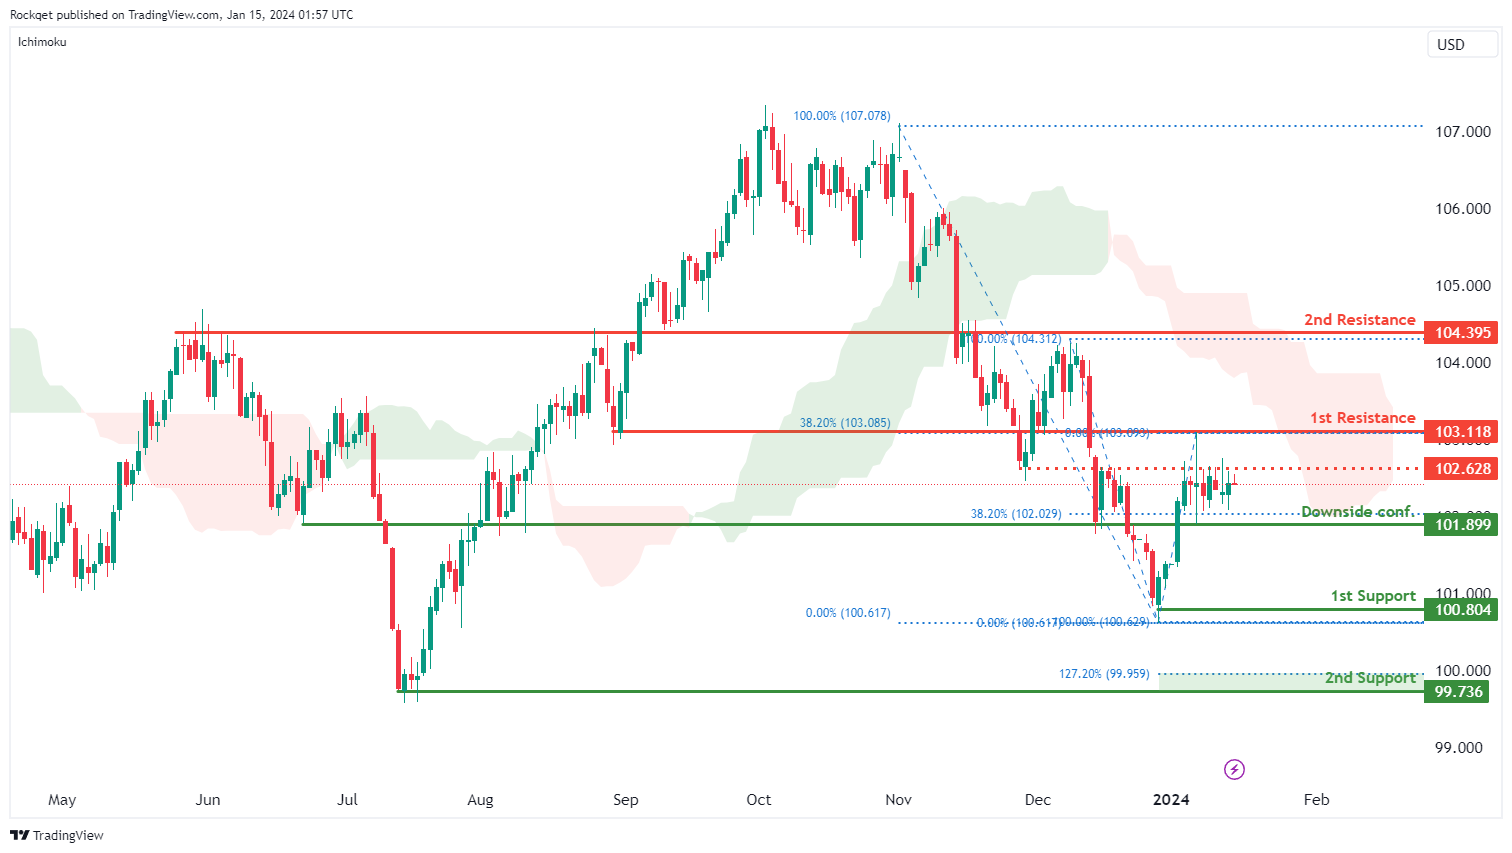
The DXY (US Dollar Index) chart currently exhibits a bearish overall momentum, indicating weakness in the US Dollar. This bearish momentum is further supported by the fact that the price is below the bearish Ichimoku cloud, which is a significant technical indicator.
There is a potential for a bearish continuation towards the 1st support level, which is located at 100.80. This level is identified as a swing low support, and it may serve as a key area where buying interest could emerge, temporarily supporting the US Dollar.
Additionally, there is a 2nd support at 100.73, categorized as an overlap support. This reinforces its significance as a potential support zone, further adding to its importance.
On the resistance side, the 1st resistance at 103.11 is marked as an overlap resistance and aligns with the 38.20% Fibonacci Retracement level. Fibonacci retracement levels are often closely watched by traders, making this resistance level noteworthy.
The 2nd resistance at 104.39 is also categorized as an overlap resistance, potentially acting as a barrier to any further upward price movement.
An intermediate resistance level at 102.62 is identified as an overlap resistance, contributing to the potential significance of this price point.
EUR/USD:
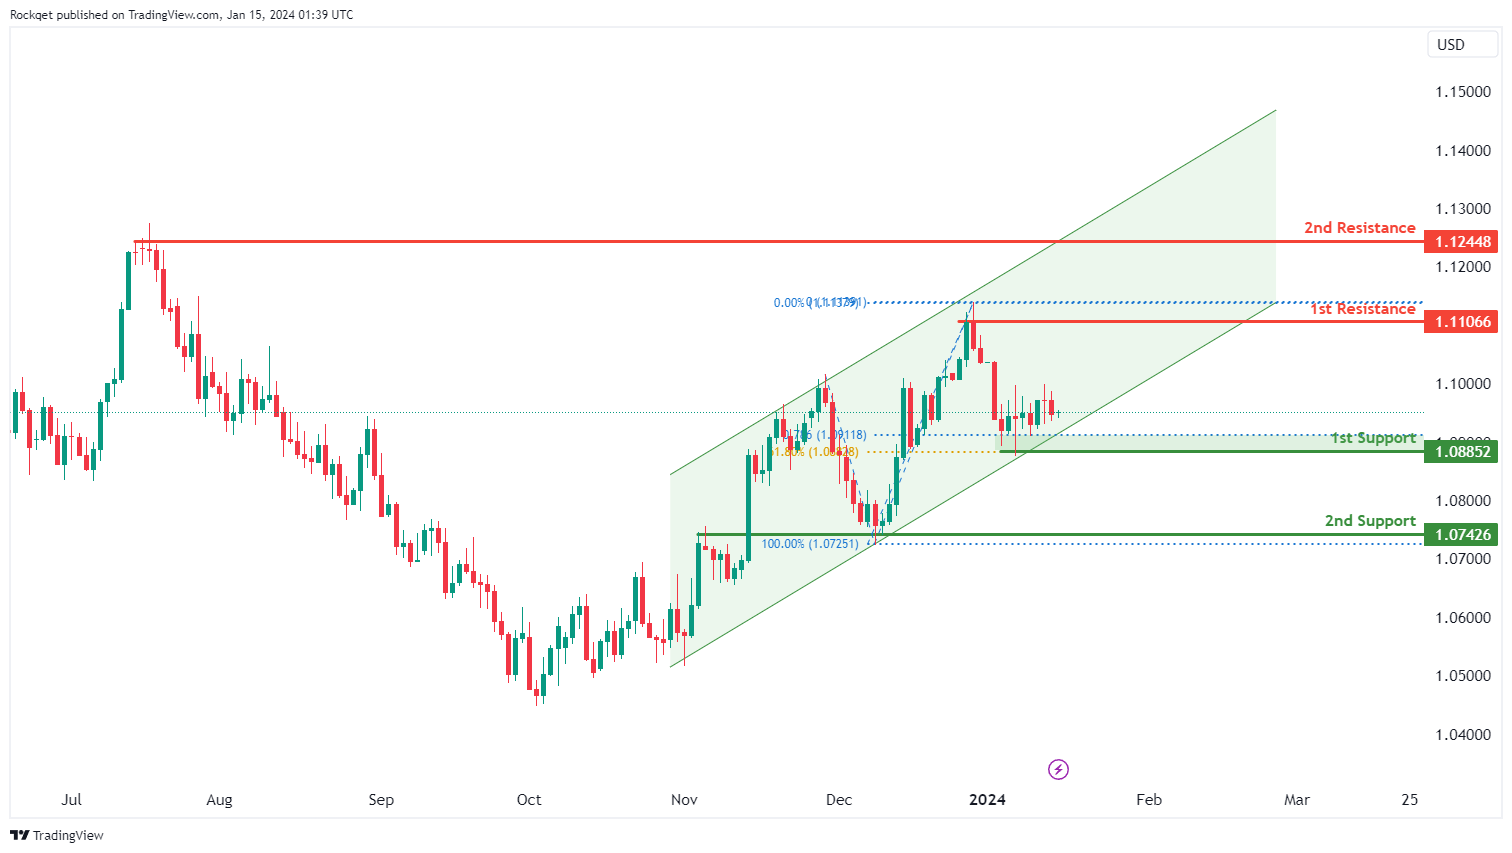
The EUR/USD chart currently has a bullish overall momentum, indicating strength in the Euro relative to the US Dollar. This momentum is supported by the fact that price is within a bullish ascending channel, which is a pattern often associated with upward price movement.
There’s a potential for a bullish continuation towards the 1st resistance level, which is at 1.1106. This level is identified as a swing high resistance, and swing highs often act as points of reversal or resistance in price movement.
The 1st support at 1.0885 is significant for several reasons. It is a swing low support, indicating a level where buying interest may emerge. Additionally, it aligns with the 61.80% Fibonacci Retracement level, adding to its significance. Fibonacci retracement levels are commonly used by traders to identify potential support and resistance areas.
There is also a 2nd support at 1.0742, categorized as an overlap support. This level further reinforces its significance as a potential support area.
On the resistance side, the 2nd resistance at 1.1244 is identified as multi-swing high resistance. These levels often present challenges for further upward price movement.
EUR/JPY:
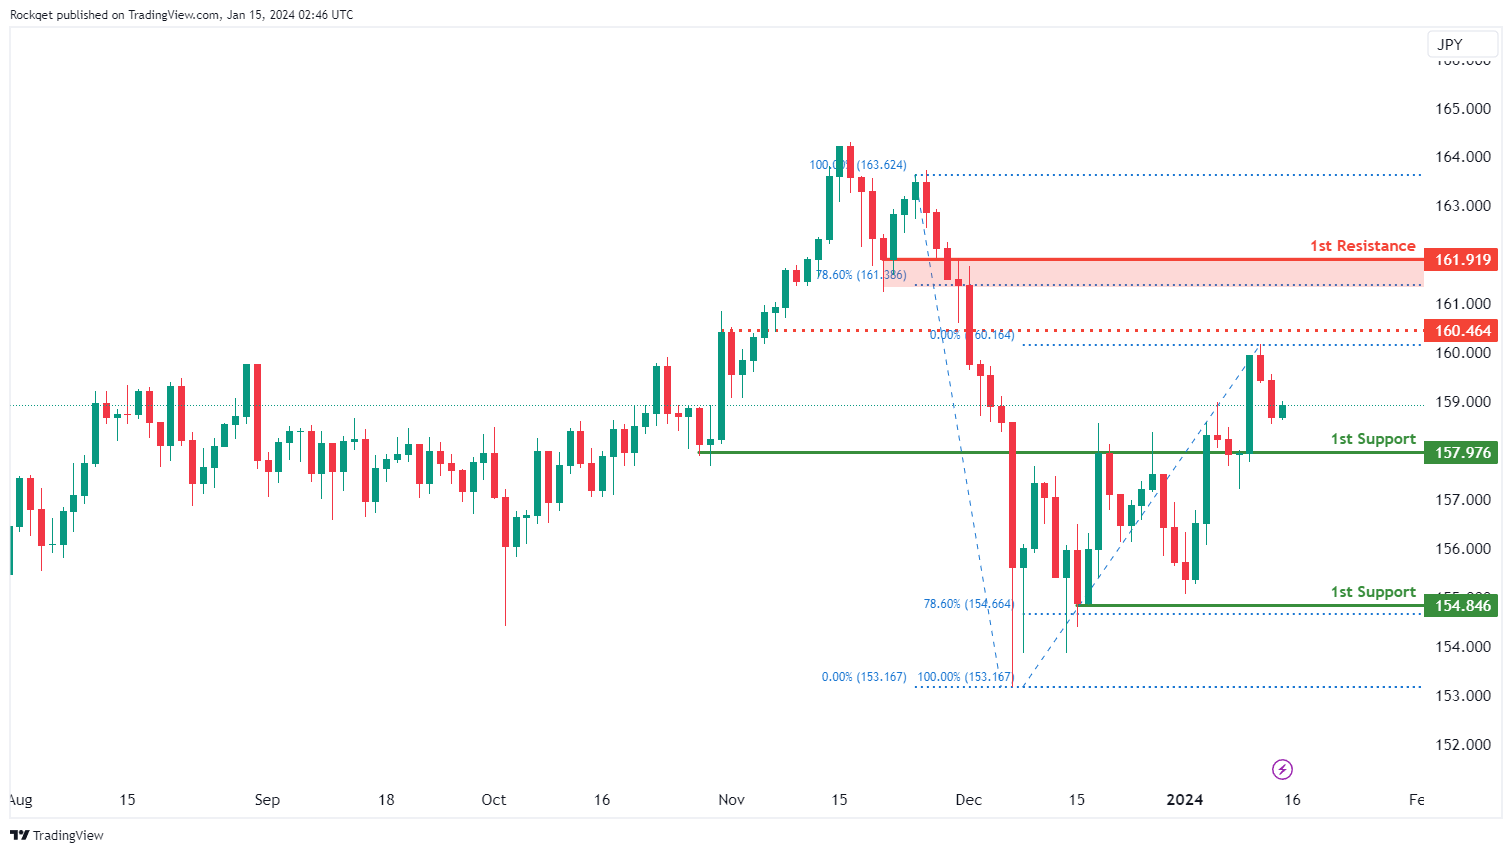
The EUR/JPY chart currently exhibits a bullish overall momentum, indicating strength in the Euro relative to the Japanese Yen. This bullish momentum is supported by the potential for a bullish continuation towards the 1st resistance level.
The 1st support at 157.97 is identified as an overlap support, suggesting a potential area where buying interest may emerge and provide temporary support for EUR/JPY.
The 2nd support at 154.84 is categorized as a swing low support, further reinforcing its significance as a potential support zone.
On the resistance side, 1st resistance at 161.91 is marked as a pullback resistance and aligns with the 78.60% Fibonacci Retracement level. This level suggests a potential area where selling pressure or resistance may be encountered, adding to its significance.
Intermediate resistance at 160.46 is also categorized as a pullback resistance, reinforcing the potential resistance zone.
EUR/GBP:
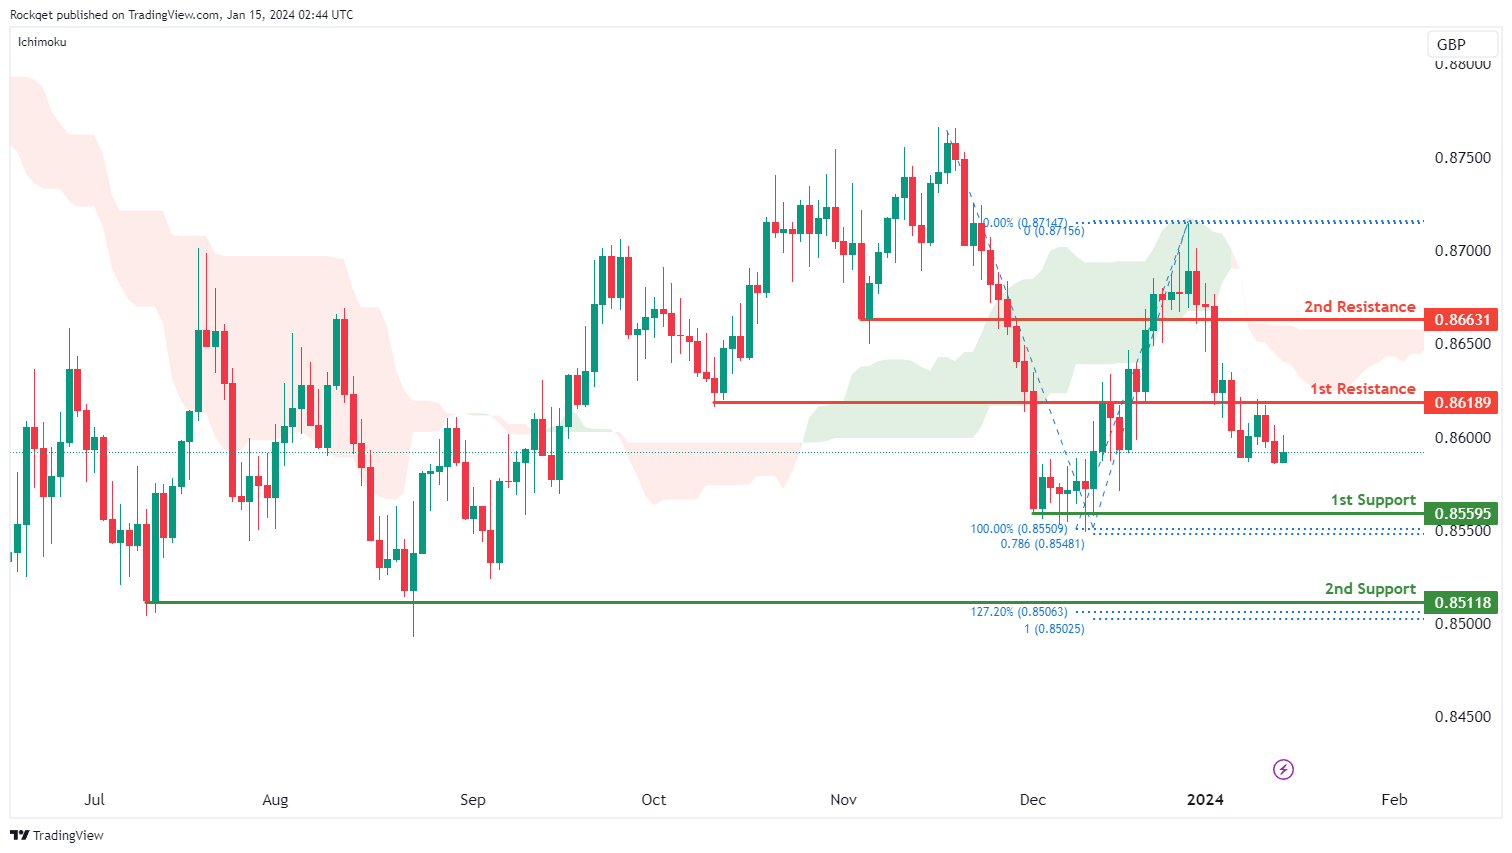
The EUR/GBP chart currently exhibits a bearish overall momentum, indicating weakness in the Euro relative to the British Pound. This bearish momentum is supported by the fact that the price is below the bearish Ichimoku cloud, signifying a potentially bearish trend continuation.
The 1st support at 0.8559 is identified as multi-swing low support, and it aligns with the 78.60% Fibonacci Projection level. This level suggests a potential area where buying interest may emerge, providing temporary support for EUR/GBP.
Additionally, the 2nd support at 0.8511 is categorized as multi-swing low support, and it reinforces its significance with the presence of the 127.20% Fibonacci Extension and 100% Fibonacci Projection, indicating Fibonacci confluence.
On the resistance side, 1st resistance at 0.8618 is marked as an overlap resistance, and it could act as a barrier for any potential upward price movement.
2nd resistance at 0.8663 is categorized as pullback resistance, further strengthening its role as a potential resistance level.
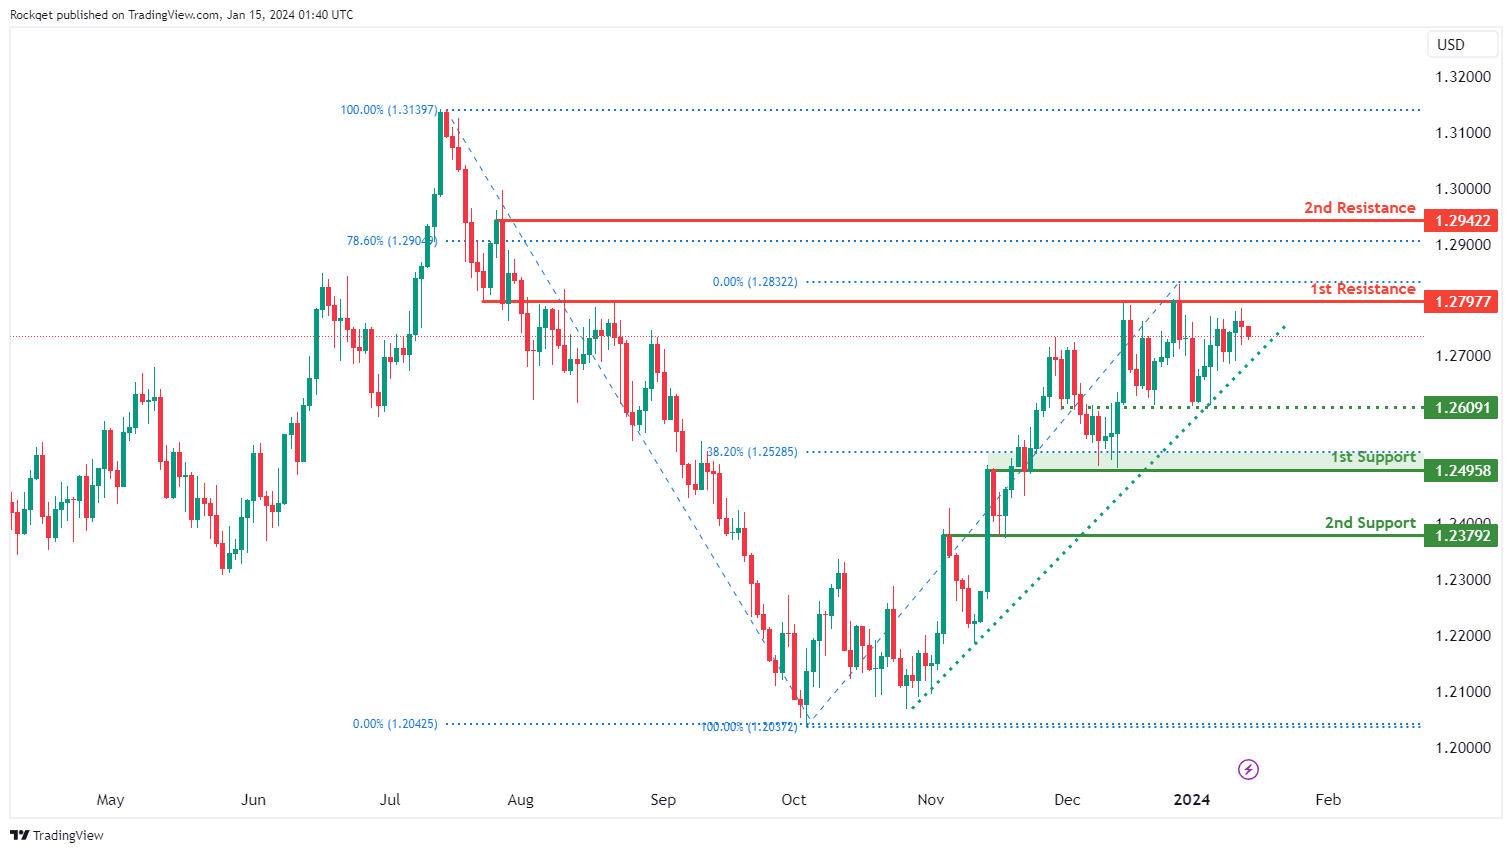
GBP/USD:
The GBP/USD chart currently exhibits a bullish overall momentum, indicating strength in the British Pound relative to the US Dollar. This momentum is supported by the fact that price is within a bullish ascending channel, a pattern often associated with upward price movement.
There’s a potential for a bullish continuation towards the 1st resistance level at 1.2797. This level is identified as an overlap resistance, suggesting it has acted as a significant price barrier in the past.
The 1st support at 1.2495 is considered a strong support level for several reasons. It is an overlap support, meaning it aligns with previous price levels where buying interest emerged. Additionally, it coincides with the 38.20% Fibonacci Retracement level, adding to its significance. Fibonacci retracement levels are commonly used by traders to identify potential support and resistance zones.
There is also a 2nd support at 1.2379, categorized as an overlap support, which further reinforces its significance as a potential support area.
On the resistance side, the 2nd resistance at 1.2942 is identified as a swing high resistance. Swing highs are often points of reversal or resistance in price movement. Additionally, this level aligns with the 78.60% Fibonacci Retracement, indicating potential Fibonacci confluence.
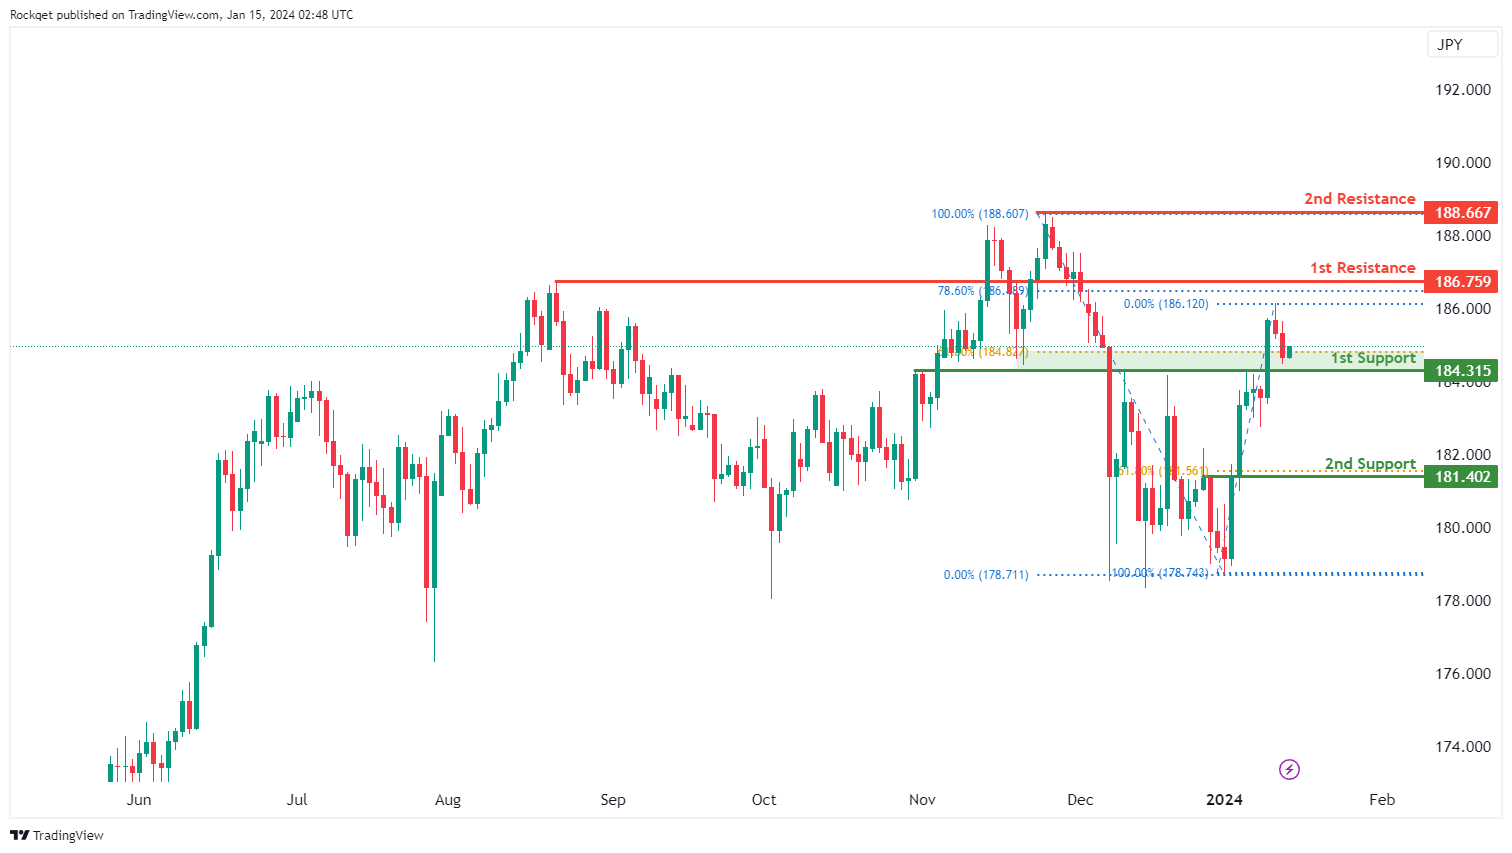
GBP/JPY:
The GBP/JPY chart currently exhibits a bullish bias, indicating strength in the British Pound against the Japanese Yen. This bullish sentiment is supported by the fact that the price has the potential to rebound from the 1st support level and make its way towards the 1st resistance level.
The 1st support at 184.31 is considered a reliable support level as it aligns with the concept of a pullback support, coinciding with the 61.80% Fibonacci Retracement. This level suggests the possibility of a temporary zone where buying interest may emerge, providing a brief period of support for GBP/JPY.
Additionally, the 2nd support at 181.40 shares the characteristics of a pullback support and further strengthens its significance by aligning with the 61.80% Fibonacci Retracement.
On the resistance side, the 1st resistance level at 186.75 is identified as a pullback resistance, closely associated with the 78.60% Fibonacci Retracement. This level could potentially act as a substantial barrier to any potential upward price movement.
Furthermore, the 2nd resistance level at 188.66 is categorized as a swing high resistance, highlighting its potential role as a significant hurdle for GBP/JPY in the future.”
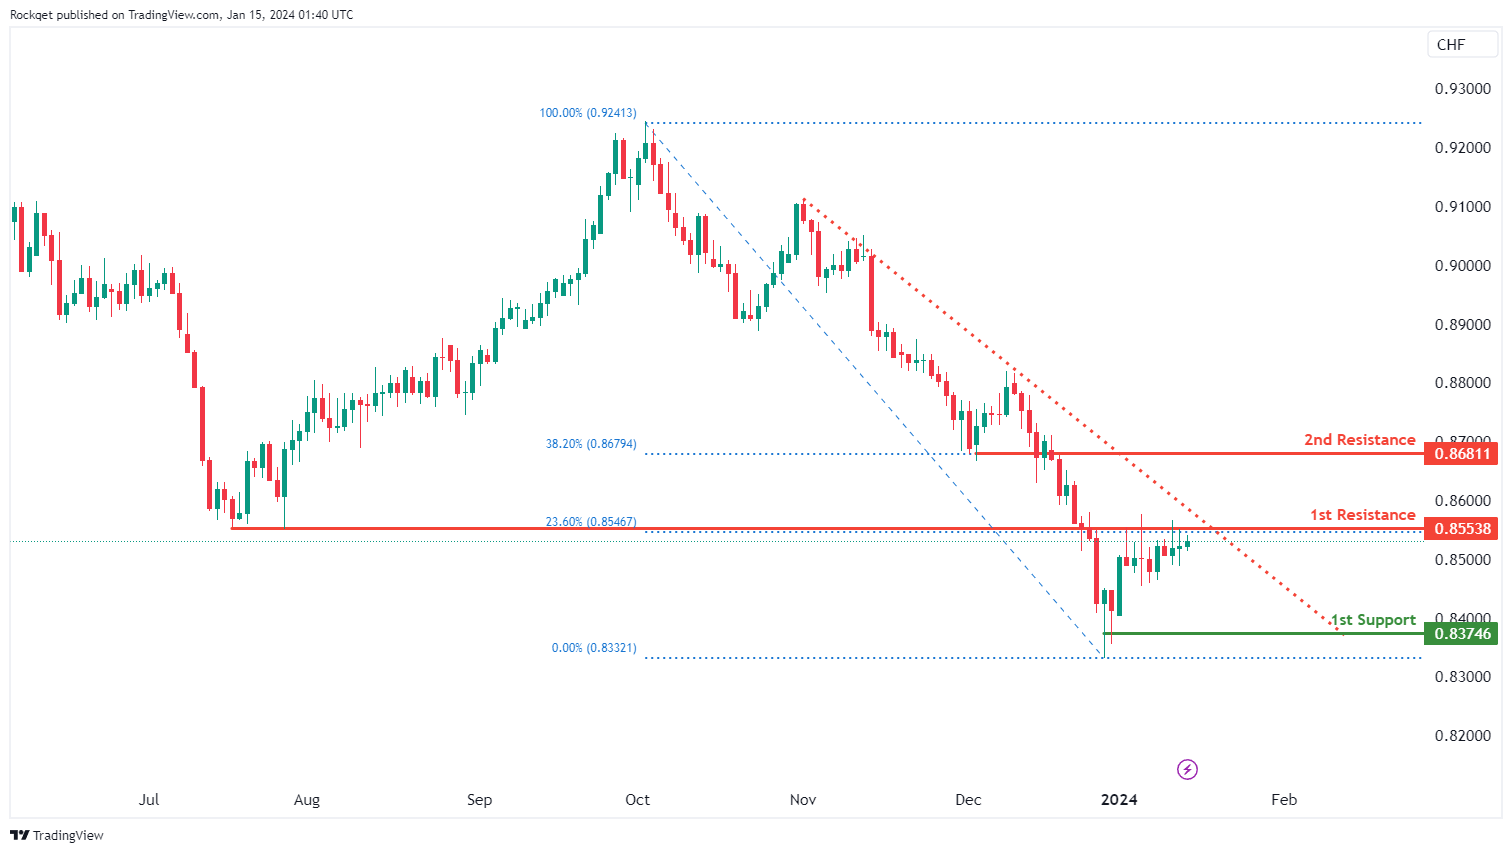
USD/CHF:
The USD/CHF chart currently has a bearish overall momentum, indicating weakness in the US Dollar relative to the Swiss Franc. This bearish momentum is supported by the fact that price is below a major descending trend line, suggesting that further bearish pressure may be on the horizon.
In the short term, there’s potential for a rise towards the 1st resistance level at 0.8553. This level is identified as an overlap resistance and aligns with the 23.60% Fibonacci Retracement, indicating potential resistance based on both historical price action and Fibonacci analysis.
The 2nd resistance at 0.8681 is categorized as a pullback resistance, further reinforcing its significance as a potential barrier for the price. This level coincides with the 38.20% Fibonacci Retracement, adding to its importance as a potential reversal point.
On the support side, the 1st support at 0.8374 is considered a strong support level as it is a swing low support. Swing lows often act as areas where buying interest can emerge, providing temporary support for the currency pair.
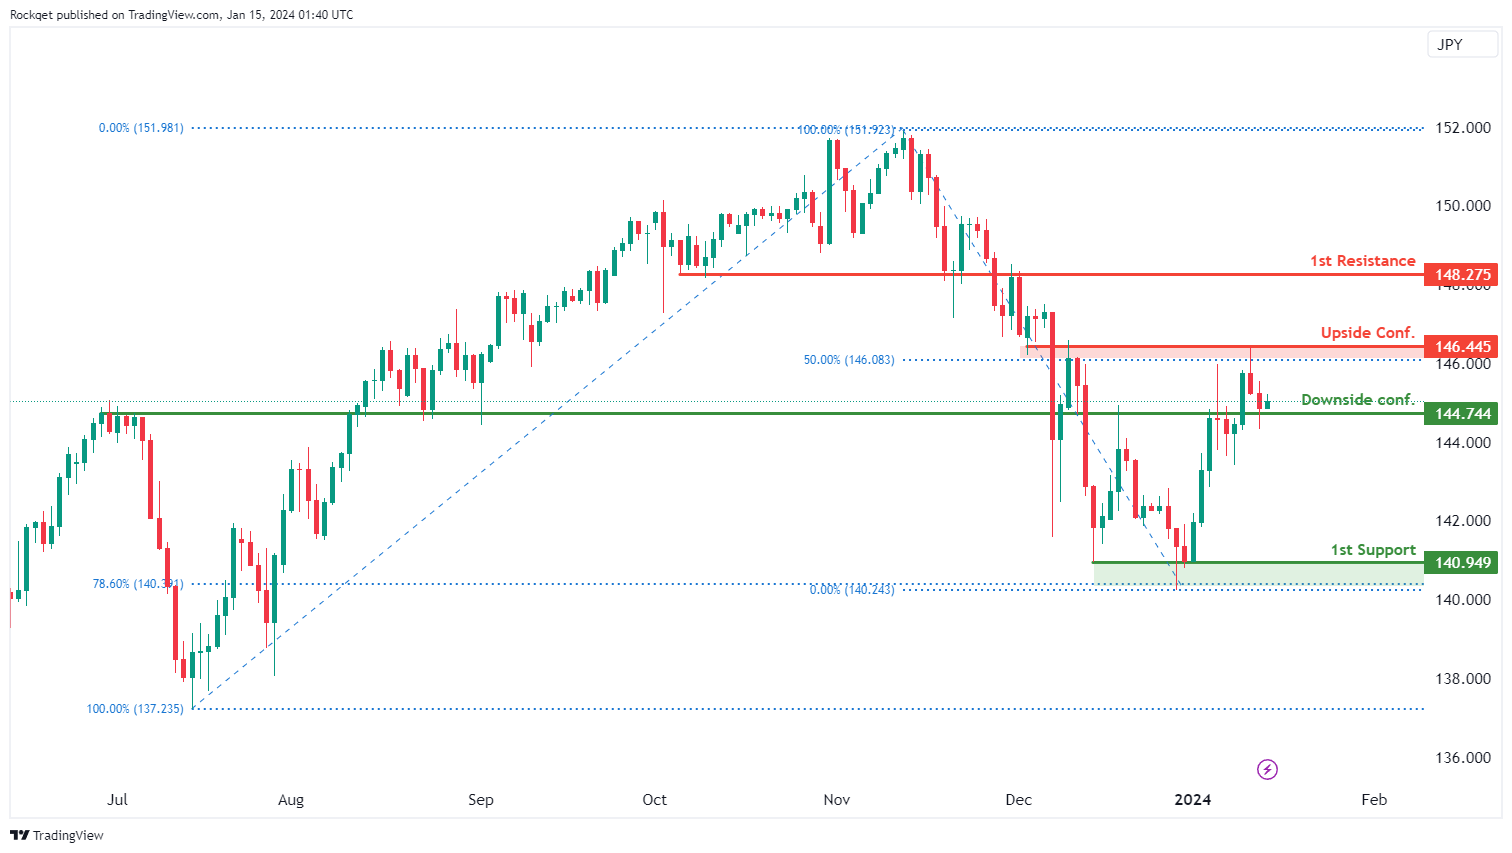
USD/JPY:
The USD/JPY chart currently exhibits a bearish overall momentum, suggesting weakness in the US Dollar relative to the Japanese Yen. This bearish momentum indicates the potential for a continuation of the downtrend.
The 1st support at 140.94 is significant as it is a multi-swing low support. This level has historically acted as a point where buying interest has emerged, making it a potential area for a temporary pause or reversal in the downtrend.
For downside confirmation, the level at 144.74 is identified as an overlap support. This level aligns with historical price action, adding to its significance as a potential support area.
On the upside, the level at 146.44 is categorized as an overlap resistance. This level also coincides with the 50% Fibonacci Retracement level, indicating potential resistance based on both historical price action and Fibonacci analysis.
The 1st resistance at 148.27 is marked as an overlap resistance, suggesting it could act as a barrier for any potential upward movement.
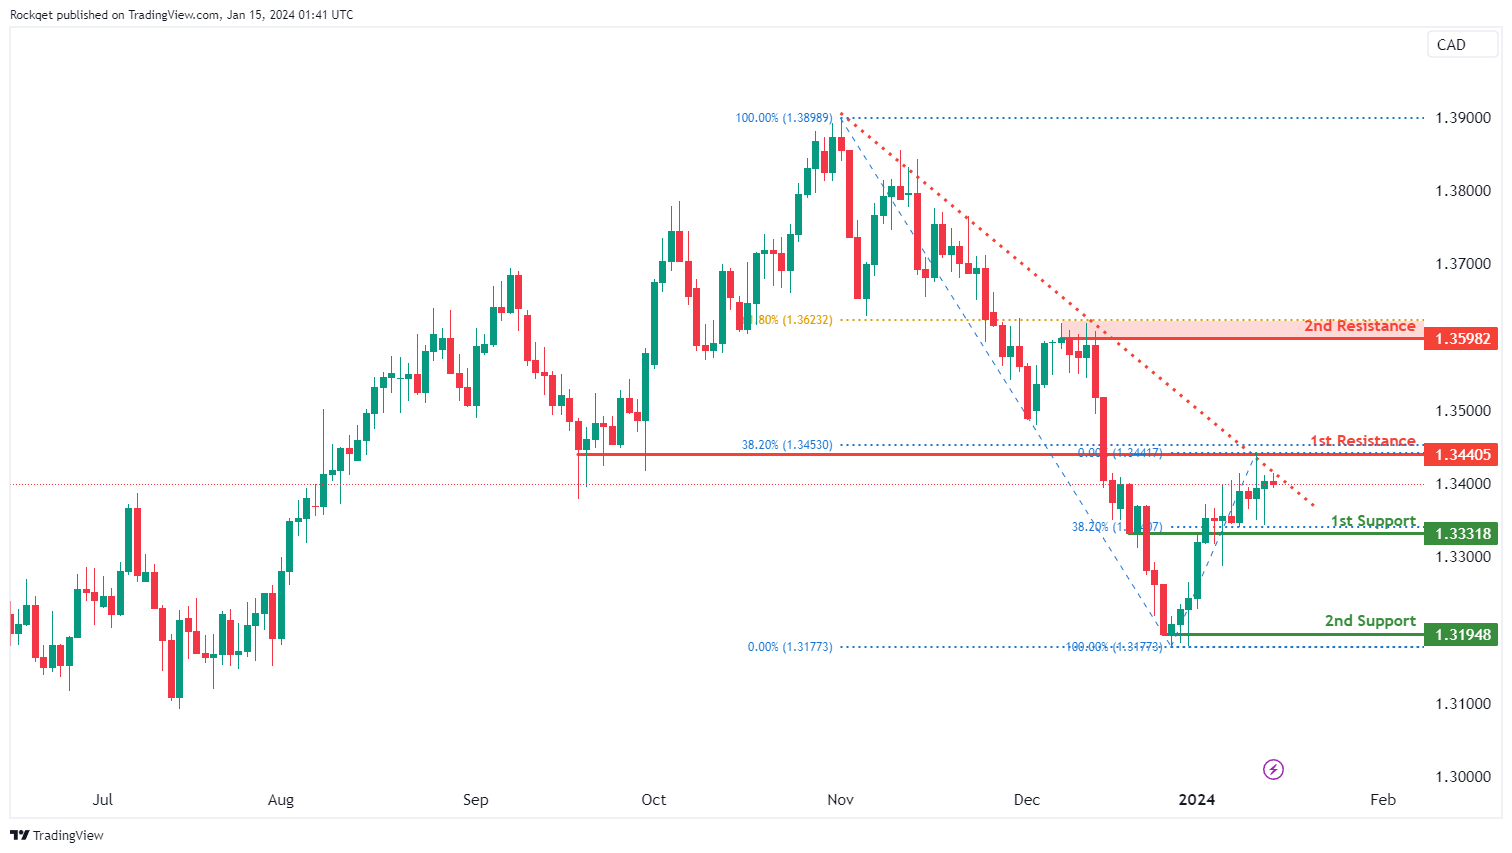
USD/CAD:
The USD/CAD chart currently shows a bearish overall momentum, indicating a downward trend in the US Dollar relative to the Canadian Dollar. This bearish momentum is supported by the fact that price is within a bearish descending channel, suggesting a potential for further downside movement.
Price could potentially make a bearish continuation towards the 1st support level, which is identified at 1.3331. This level is significant as it coincides with an overlap support and the 38.20% Fibonacci Retracement level, indicating a potential area where buying interest may emerge and provide temporary support for USD/CAD.
The 2nd support at 1.3194 is categorized as a multi-swing low support, further reinforcing its significance as a potential support zone in the bearish scenario.
On the resistance side, 1st resistance at 1.3440 is marked as an overlap resistance and aligns with the 38.20% Fibonacci Retracement level. This level suggests a potential area where selling pressure or resistance may be encountered.
2nd resistance at 1.3598 is identified as an overlap resistance and coincides with the 61.80% Fibonacci Retracement level, adding to its importance as a potential barrier for the price.
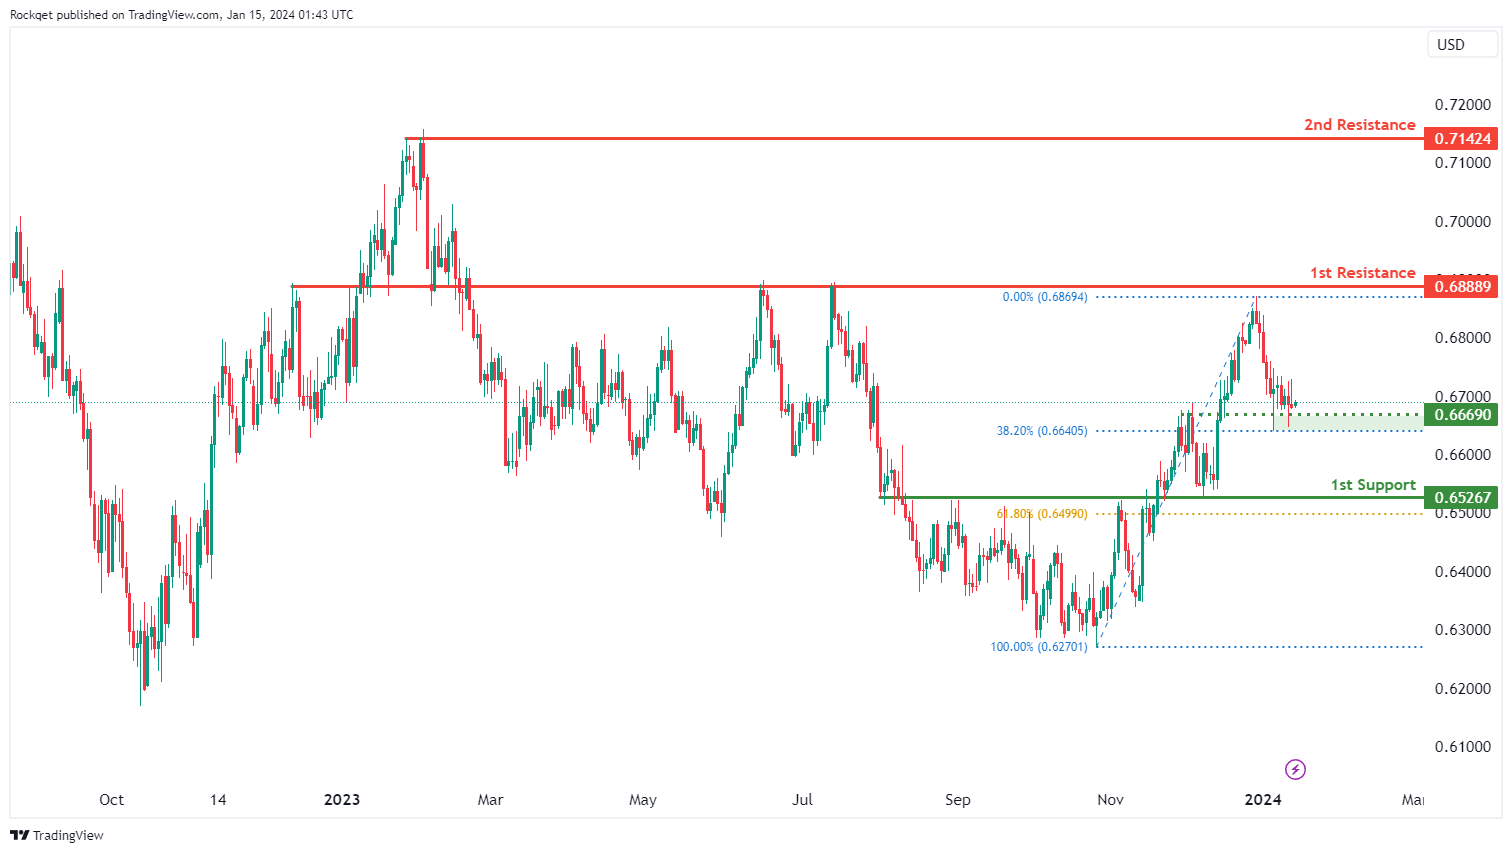
AUD/USD:
The AUD/USD chart currently exhibits a bearish overall momentum, indicating a downward trend in the Australian Dollar relative to the US Dollar. This bearish momentum suggests the potential for a bearish continuation towards the 1st support level.
Intermediate support at 0.6669 is identified as an overlap support and coincides with the 38.20% Fibonacci Retracement level. This level holds significance as it indicates a potential area where buying interest may emerge, providing temporary support for AUD/USD.
1st support at 0.6526 is marked as an overlap support and aligns with the 61.80% Fibonacci Retracement level, further reinforcing its importance as a potential support zone.
On the resistance side, 1st resistance at 0.6888 is categorized as an overlap resistance, suggesting a potential area where selling pressure or resistance may be encountered.
2nd resistance at 0.7142 is identified as a swing high resistance, indicating a significant level where price reversals or strong resistance might occur.
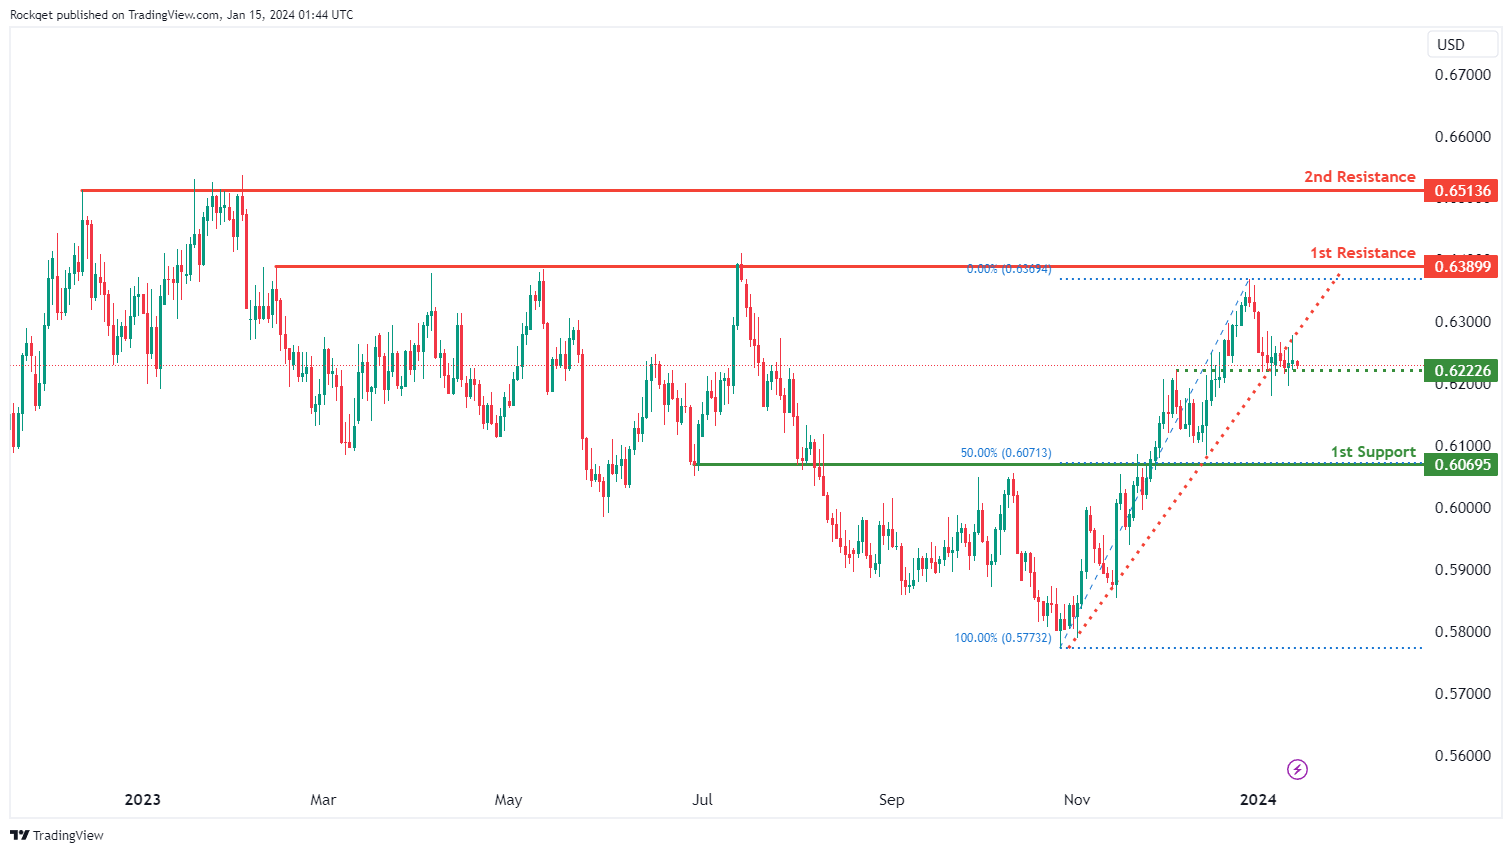
NZD/USD
The NZD/USD chart currently exhibits a bearish overall momentum, indicating a downward trend in the New Zealand Dollar relative to the US Dollar. This bearish momentum is driven by the fact that the price has broken below an ascending support line, triggering the potential for a bearish move.
Intermediate support at 0.6222 is considered significant as it has acted as a multi-swing low support in the past. Traders may look to this level for potential buying interest and temporary support.
1st support at 0.6069 is marked as an overlap support and coincides with the 50% Fibonacci Retracement level. It holds significance as it suggests a potential area where buying pressure may emerge.
On the resistance side, 1st resistance at 0.6389 is identified as a multi-swing high resistance, indicating the potential for price reversals or resistance at this level.
2nd resistance at 0.6513 is also categorized as a multi-swing high resistance, further reinforcing the potential resistance zone for the price.
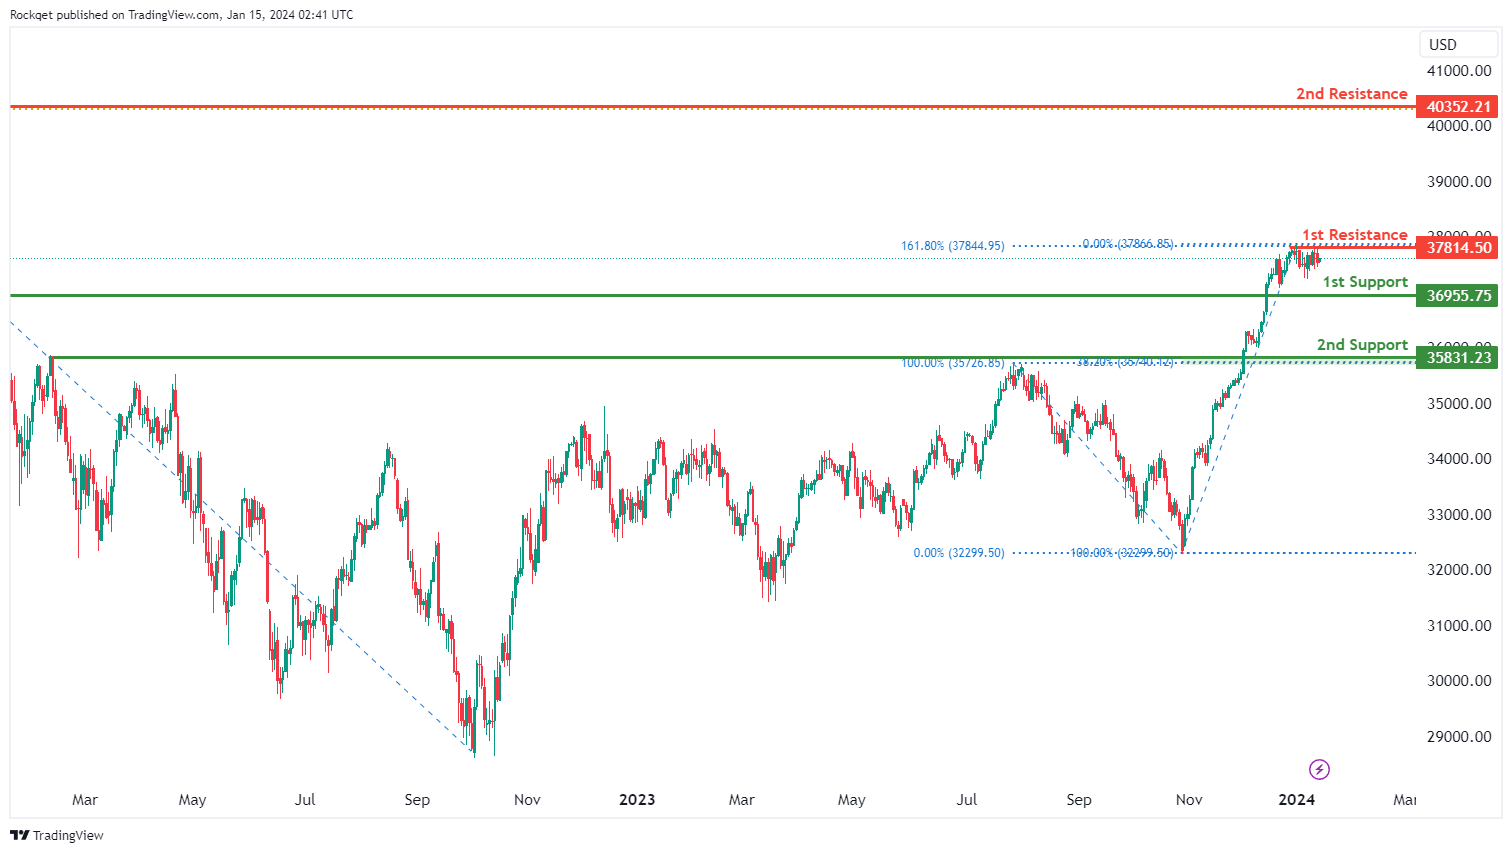
DJ30:
The DJ30 chart currently displays an overall bullish momentum. In this context, there is a potential The DJ30 chart currently exhibits a neutral overall momentum, indicating a lack of a clear bullish or bearish bias in the market. Given this neutral stance, it is expected that the price may fluctuate within a range defined by the 1st support and 1st resistance levels.
The 1st support level is identified at 36955.75, and it is considered a notable support level due to its characteristics as a pullback support. This level suggests a potential area where buyers may step in, offering support to the DJ30.
Similarly, the 2nd support level at 35831.23 also serves as a pullback support, reinforcing its significance as a potential zone for price support in the neutral market conditions.
On the resistance side, the 1st resistance level is positioned at 37814.50. This level holds significance as a multi-swing high resistance and is further strengthened by its alignment with the 161.80% Fibonacci Extension, indicating its potential to act as a strong barrier to upward price movement.
Furthermore, the 2nd resistance level at 40352.21 is categorized as a significant resistance level due to its association with the 61.80% Fibonacci Projection.
GER40:
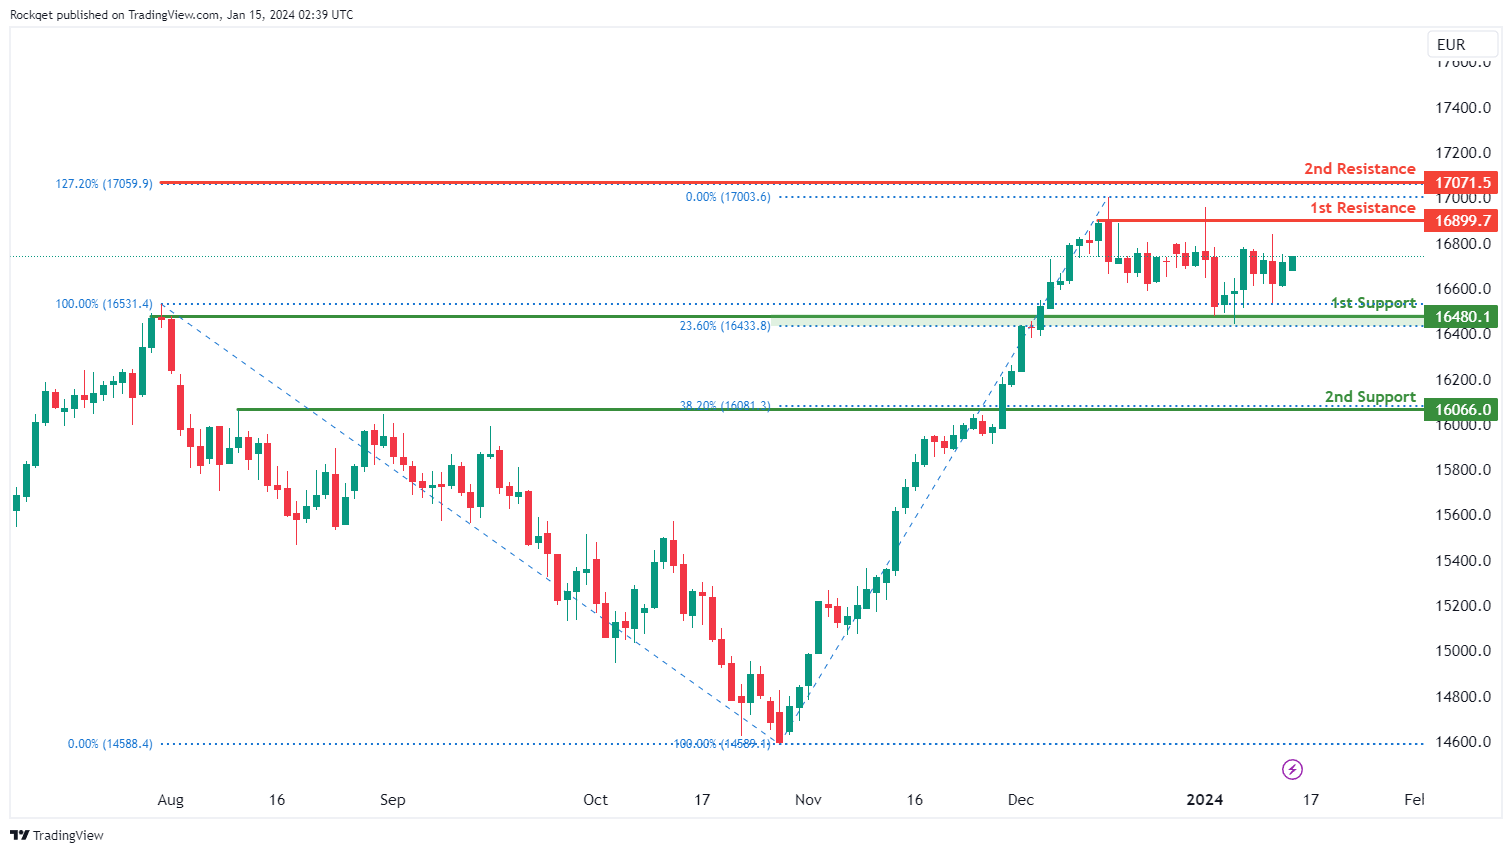
The GER40 chart currently exhibits a neutral overall momentum, suggesting a lack of a clear trend direction. Several factors contribute to this neutral momentum, and as a result, the price could potentially make fluctuations between the 1st resistance and 1st support levels.
The 1st support at 16480.10 is considered favorable due to its identification as an overlap support and coincides with the 23.60% Fibonacci Retracement, suggesting historical significance as a level where buying interest has previously emerged.
The 2nd support at 16066.00 is recognized as a pullback support and aligns with the 38.20% Fibonacci Retracement, adding confluence to its potential as a support level.
On the resistance side, the 1st resistance at 16899.70 is identified as a swing high resistance. The 2nd resistance at 17071.50 is noteworthy for the presence of the 127.20% Fibonacci Extension, adding significance to this potential resistance level.
US500:
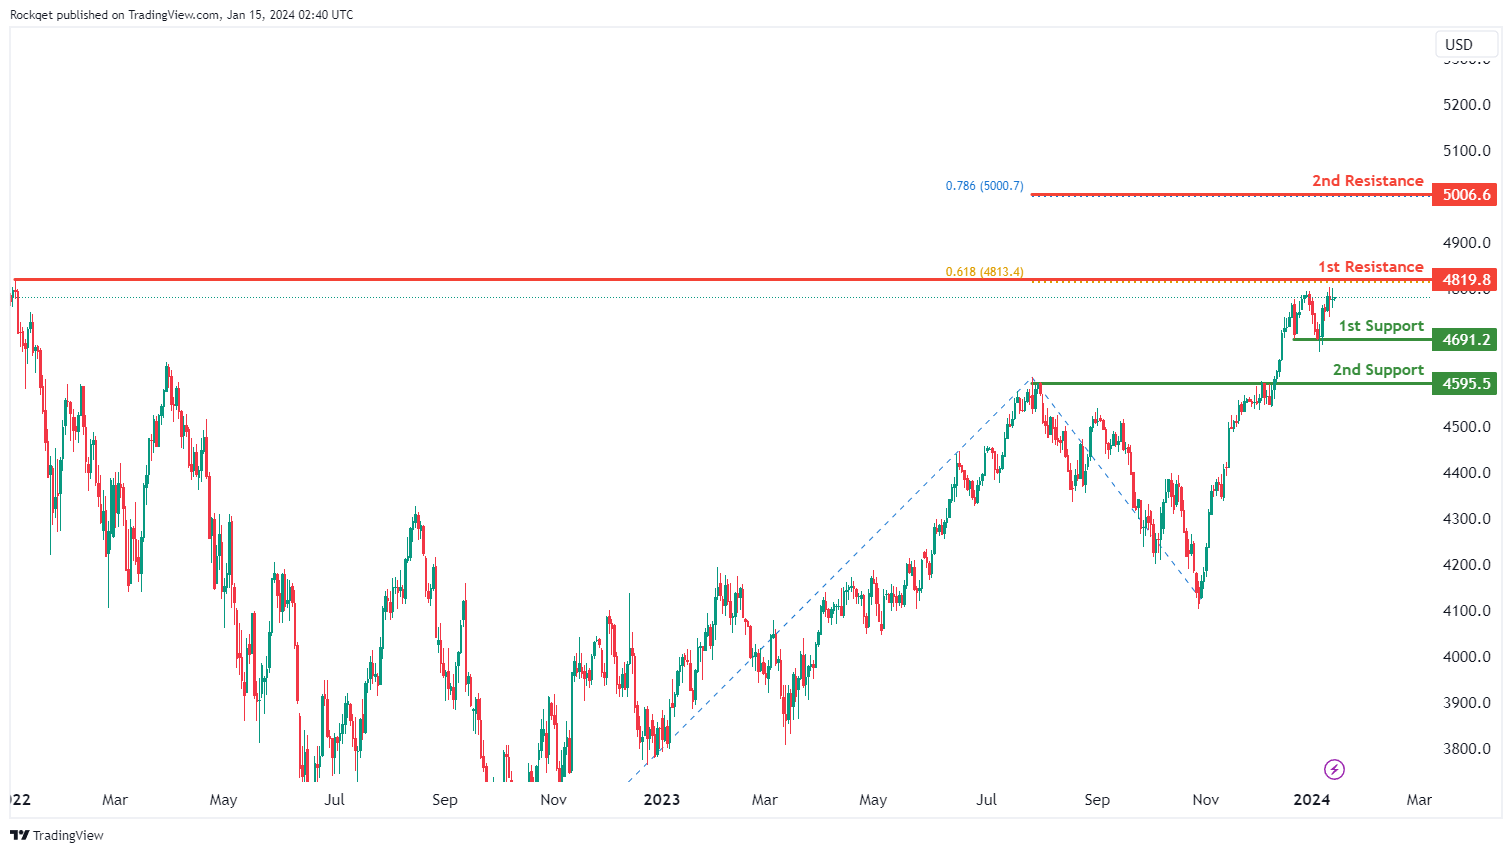
The US500 chart currently demonstrates a bullish overall momentum, indicating an upward trend. There is a potential scenario for a bullish continuation towards the 1st resistance.
The 1st support at 4691.2 is considered advantageous as a pullback support, suggesting historical significance as a level where buying interest has previously emerged.
The 2nd support at 4595.5 is recognized as another pullback support, adding to its potential as a support level.
On the resistance side, the 1st resistance at 4819.8 is identified as a swing high resistance and aligns with the 61.80% Fibonacci Projection, potentially acting as a barrier where selling interest could materialize.
The 2nd resistance at 5006.6 is noteworthy for the presence of the 78.60% Fibonacci Projection, adding significance to this potential resistance level.
BTC/USD:
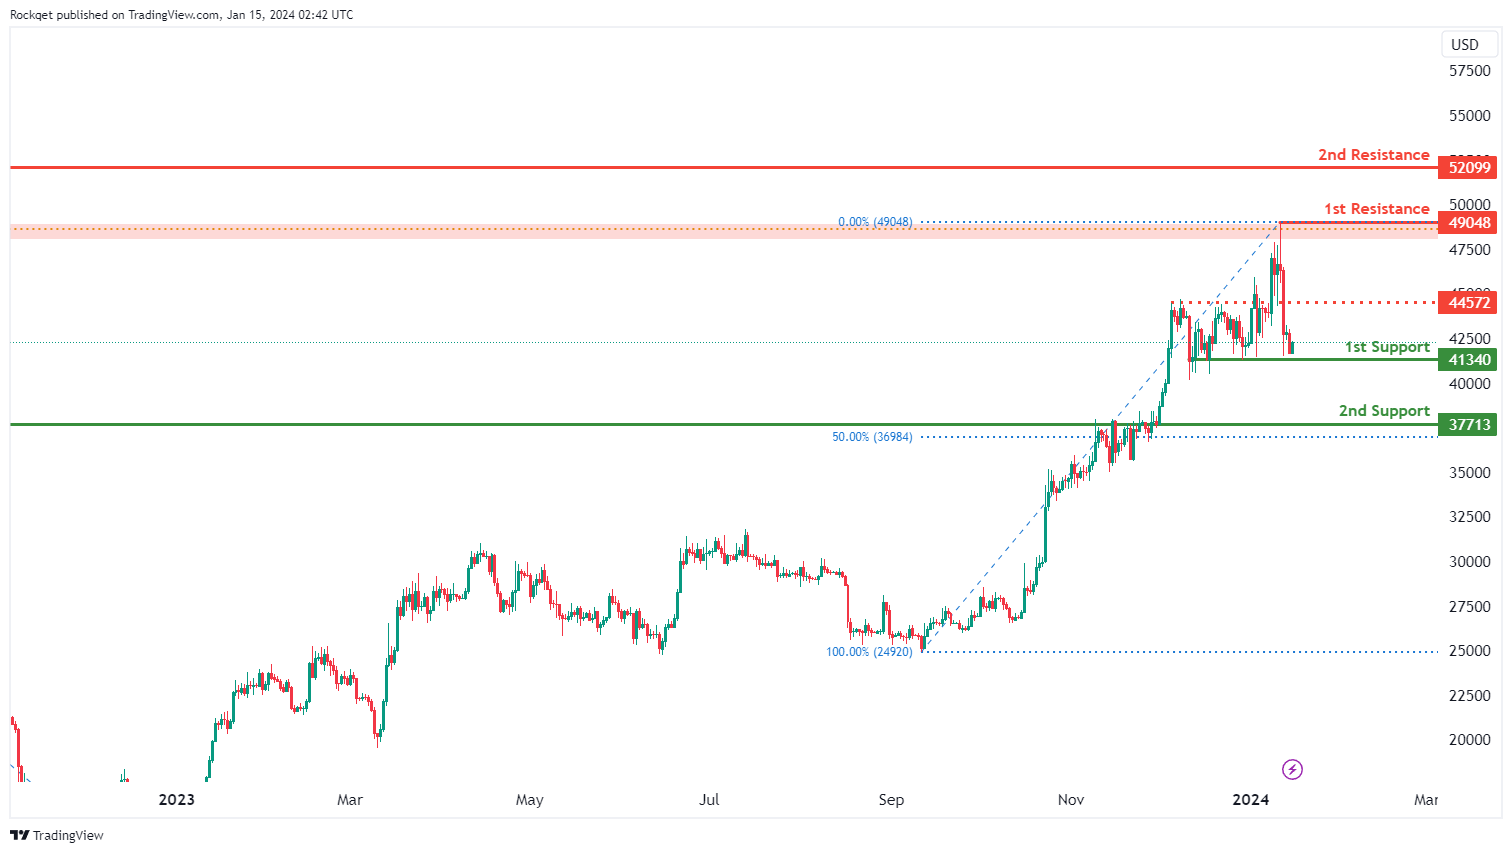
The BTC/USD chart currently indicates a bearish overall momentum, suggesting a potential downward trend. There is a scenario in which the price could make a bearish reaction off the 1st resistance and drop towards the 1st support.
The 1st support at 41340 is considered favorable as it is identified as a multi-swing low support, implying historical significance as a level where buying interest has previously emerged.
The 2nd support at 37713 is recognized as a pullback support, adding to its potential as a support level.
On the resistance side, the intermediate resistance at 44572 is identified as a pullback resistance, suggesting a level where selling interest could materialize.
The 1st resistance at 49048 is considered significant as it aligns with a swing high resistance, potentially acting as a barrier. The 2nd resistance at 52099 is also recognized as a swing high resistance.
ETH/USD:
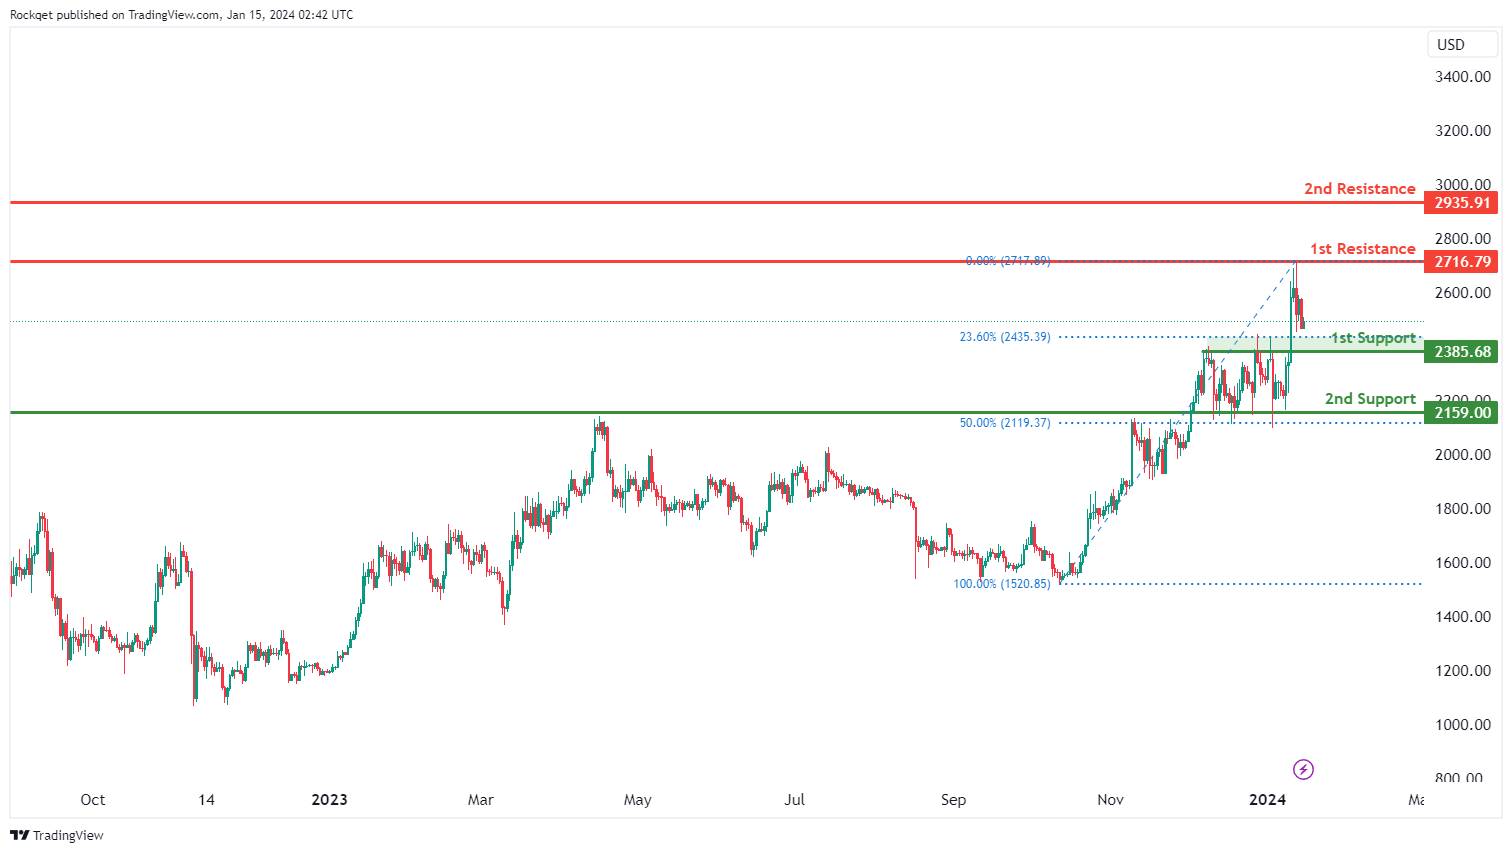
The ETH/USD chart currently exhibits a bearish overall momentum, indicating a potential downward trend. There is a scenario in which the price could make a bearish continuation towards the 1st support.
The 1st support at 2385.68 is considered advantageous due to its identification as a pullback support and its alignment with the 23.60% Fibonacci Retracement, suggesting historical significance as a level where buying interest has previously emerged.
The 2nd support at 2159.00 is recognized as an overlap support, adding to its potential as a support level.
On the resistance side, the 1st resistance at 2716.79 is deemed significant as it aligns with a swing high resistance, potentially acting as a barrier where selling interest could materialize. The 2nd resistance at 2935.91 is also recognized as a swing high resistance.
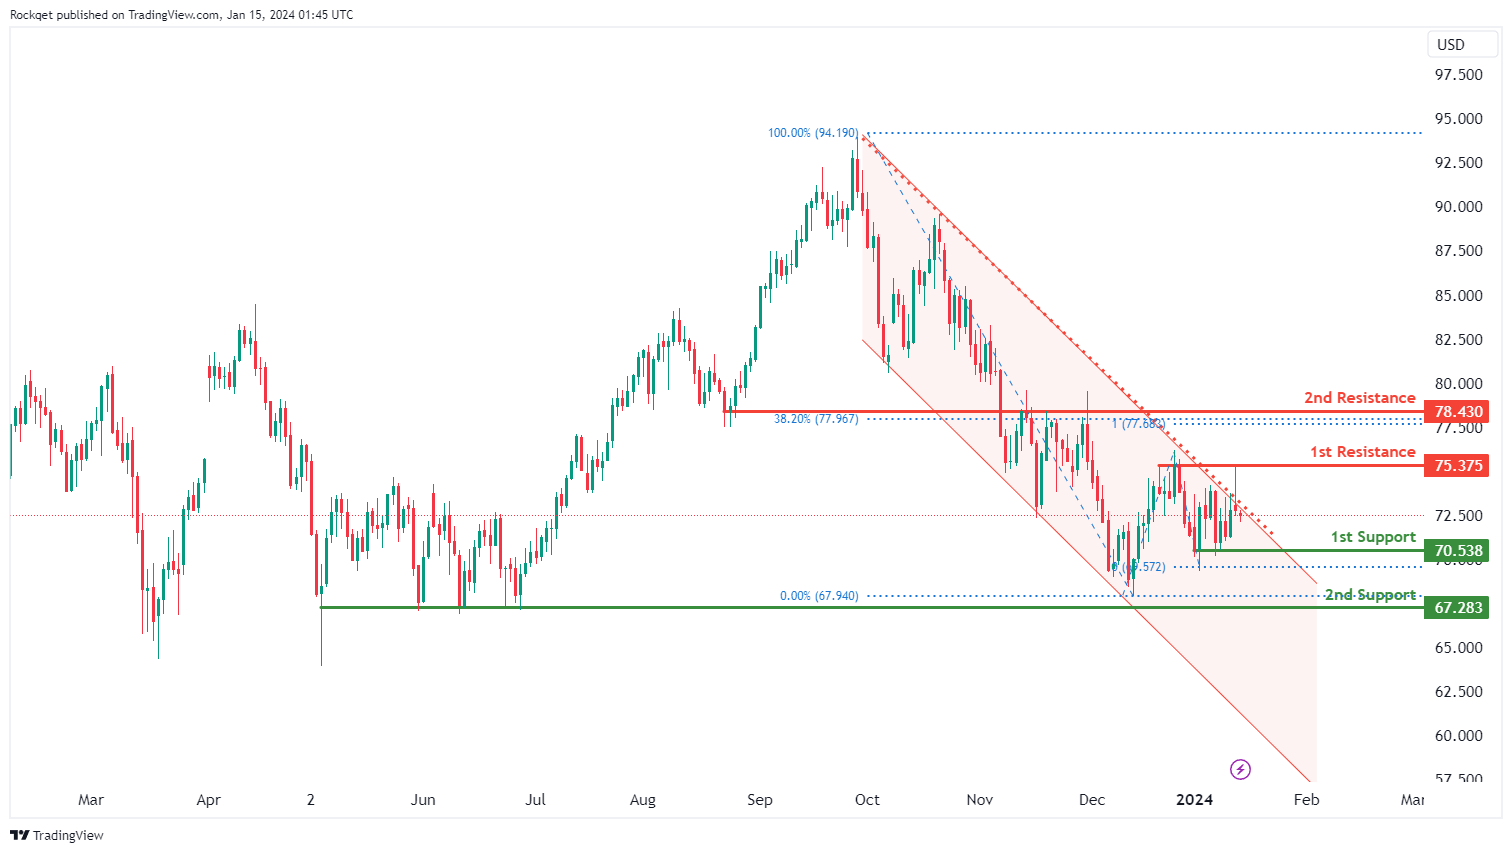
WTI/USD:
The WTI (West Texas Intermediate) chart currently exhibits a bearish overall momentum, indicating a downward trend in the price of oil. This bearish momentum is characterized by the fact that the price is within a bearish descending channel, suggesting the potential for further declines.
The 1st support level at 70.53 is considered significant as it has acted as a multi-swing low support in the past. This level may attract buying interest and provide temporary support for the price if it reaches this point.
The 2nd support at 67.28 is also categorized as a multi-swing low support, reinforcing its significance as a potential support zone in case of a price drop.
On the resistance side, the 1st resistance at 75.37 is marked as a multi-swing high resistance, signifying the potential for price reversals or resistance at this level.
The 2nd resistance at 78.43 is categorized as an overlap resistance. Notably, it aligns with the 38.20% Fibonacci Retracement level and the 100% Fibonacci Projection, indicating Fibonacci confluence. This makes it a strong potential barrier for the price.
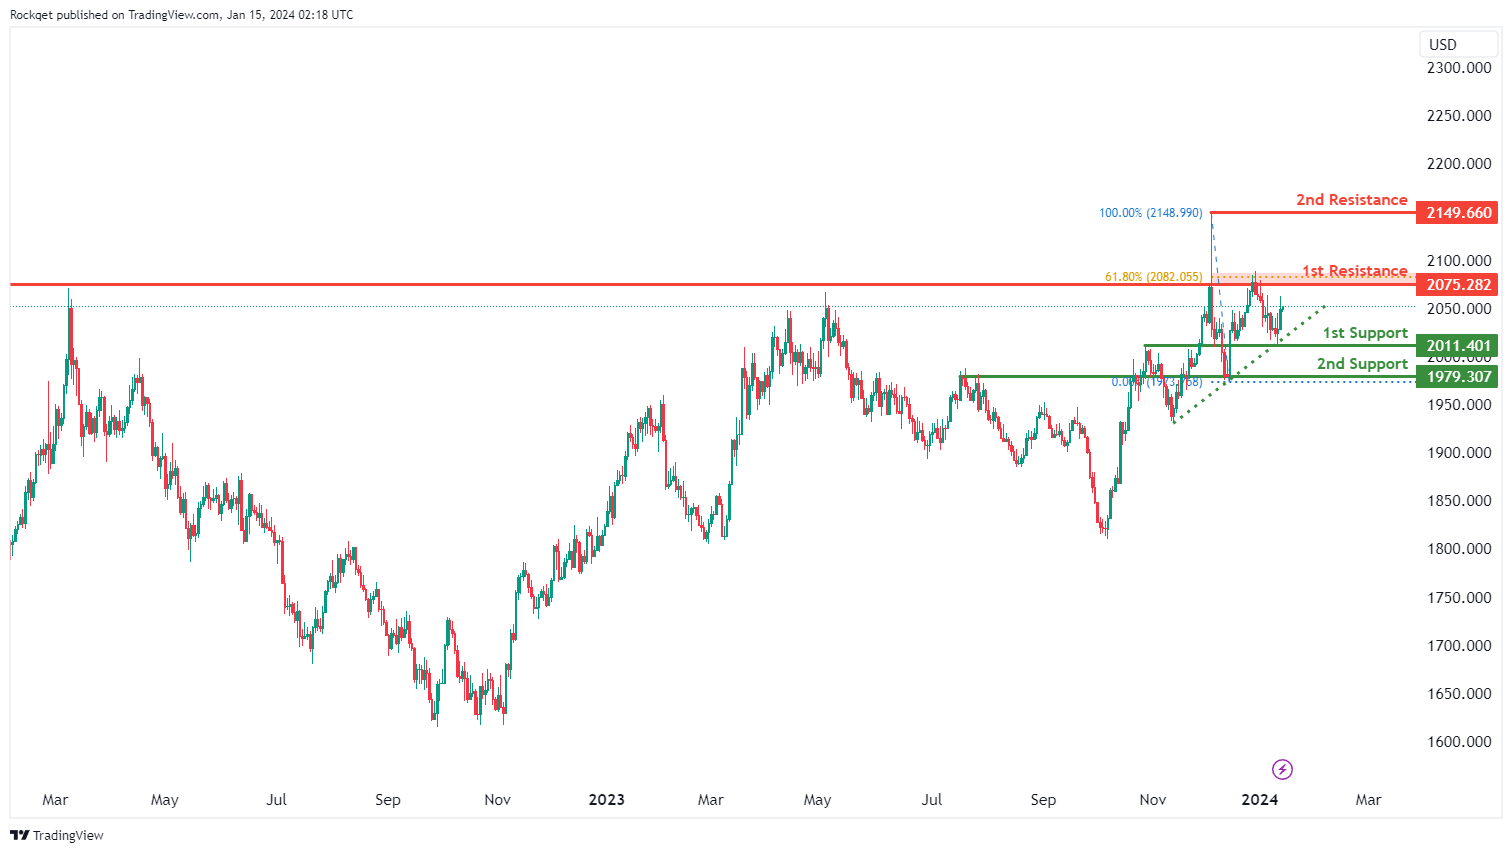
XAU/USD (GOLD):
The XAU/USD chart currently has a bullish overall momentum, indicating strength in the price of Gold (XAU) relative to the US Dollar (USD). This bullish momentum is supported by the fact that price is above a major ascending trend line, suggesting that further upward movement may be in store.
The 1st support at 2011.40 is identified as an overlap support level. This means it has acted as a significant level of support in the past and could potentially provide buying interest if the price retraces.
The 2nd support at 1979.30 is also categorized as an overlap support, further reinforcing its significance as a potential support area.
On the resistance side, the 1st resistance at 2075.28 is marked as an overlap resistance. Additionally, it aligns with the 61.80% Fibonacci Retracement level, making it a strong potential barrier for the price.
The 2nd resistance at 2149.66 is categorized as a swing high resistance. Swing highs often represent points of reversal or resistance in price movement.
The accuracy, completeness and timeliness of the information contained on this site cannot be guaranteed. IC Markets does not warranty, guarantee or make any representations, or assume any liability regarding financial results based on the use of the information in the site.
News, views, opinions, recommendations and other information obtained from sources outside of www.icmarkets.com, used in this site are believed to be reliable, but we cannot guarantee their accuracy or completeness. All such information is subject to change at any time without notice. IC Markets assumes no responsibility for the content of any linked site.
The fact that such links may exist does not indicate approval or endorsement of any material contained on any linked site. IC Markets is not liable for any harm caused by the transmission, through accessing the services or information on this site, of a computer virus, or other computer code or programming device that might be used to access, delete, damage, disable, disrupt or otherwise impede in any manner, the operation of the site or of any user’s software, hardware, data or property.


