
EUR/USD:
Weekly gain/loss: +0.75%
Weekly close: 1.1298
Weekly perspective:
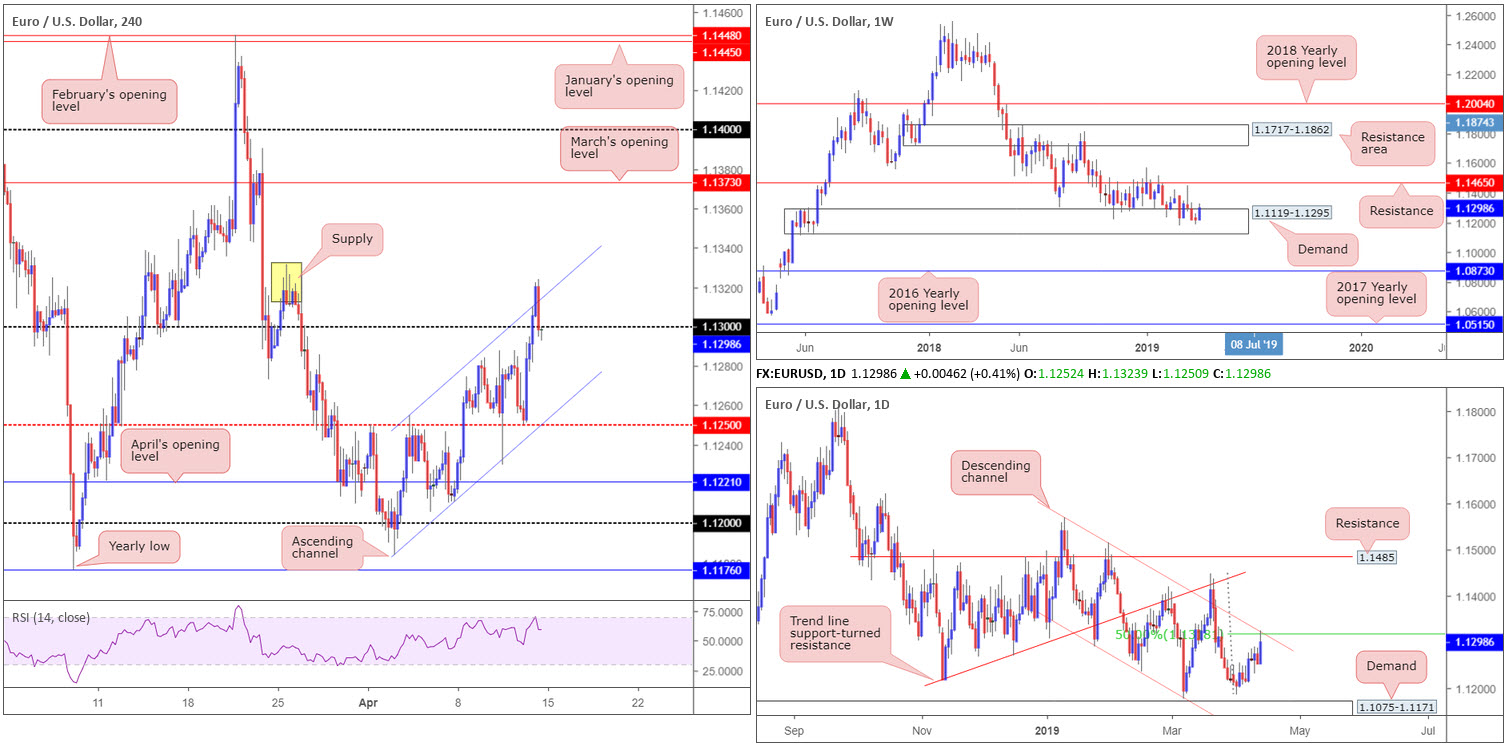
Trading within the parapets of demand at 1.1119-1.1295, the single currency, in the shape of a near-full-bodied bullish candle, wrapped up the week on strong footing. Further upside this week has hefty resistance at 1.1465 to target, a level that’s capped downside since October 2018.
Additional areas worth chalking up are a long-standing resistance zone plotted at 1.1717-1.1862, and the 2016 yearly opening level priced in at 1.0873.
Daily perspective:
Counter to weekly structure, price action on the daily timeframe shook hands with channel resistance (extended from the high 1.1569) and a merging 50.0% resistance value at 1.1318 into the week’s close. Friday’s response from this angle, along with the channel’s robust history, may spur additional selling this week, targeting the 1.1183 Apr 2 low, shadowed closely by demand at 1.1075-1.1171 (glued to the underside of the current weekly demand area).
H4 perspective:
Friday’s session kicked off on a strong note in Asia, advancing north of 1.1250 support and eventually reclaiming 1.13+ status going into London trade, a level not seen since late March. Despite an enthusiastic break above 1.13, supply at 1.1331/1.1310 (yellow), along with channel resistance (taken from the high 1.1254), capped upside and chucked the candles back under 1.13 by the close. Note the aforementioned supply zone also fuses with the daily channel resistance highlighted above.
The mild close beneath 1.13 could draw the market back towards 1.1250 today/early week, though do remain cognizant of the possibility price action could find support prior to this at channel support (etched from the low 1.1183).
Areas of consideration:
UNTIL the current H4 channel resistance is consumed as well as the H4 supply (yellow) and its merging daily channel resistance, entering long is precarious, irrespective of weekly structure.
In terms of selling this week, the research team notes possible opportunity beneath 1.13, targeting H4 channel support (see above) as the initial take-profit zone. Before pulling the trigger, though, traders are urged to wait and see if H4 prints a bearish candlestick formation. That way, not only can traders identify seller intent, the pattern also offers strict entry and risk levels to work with.
Today’s data points: Limited.
GBP/USD:
Weekly gain/loss: +0.25%
Weekly close: 1.3064
Weekly perspective:
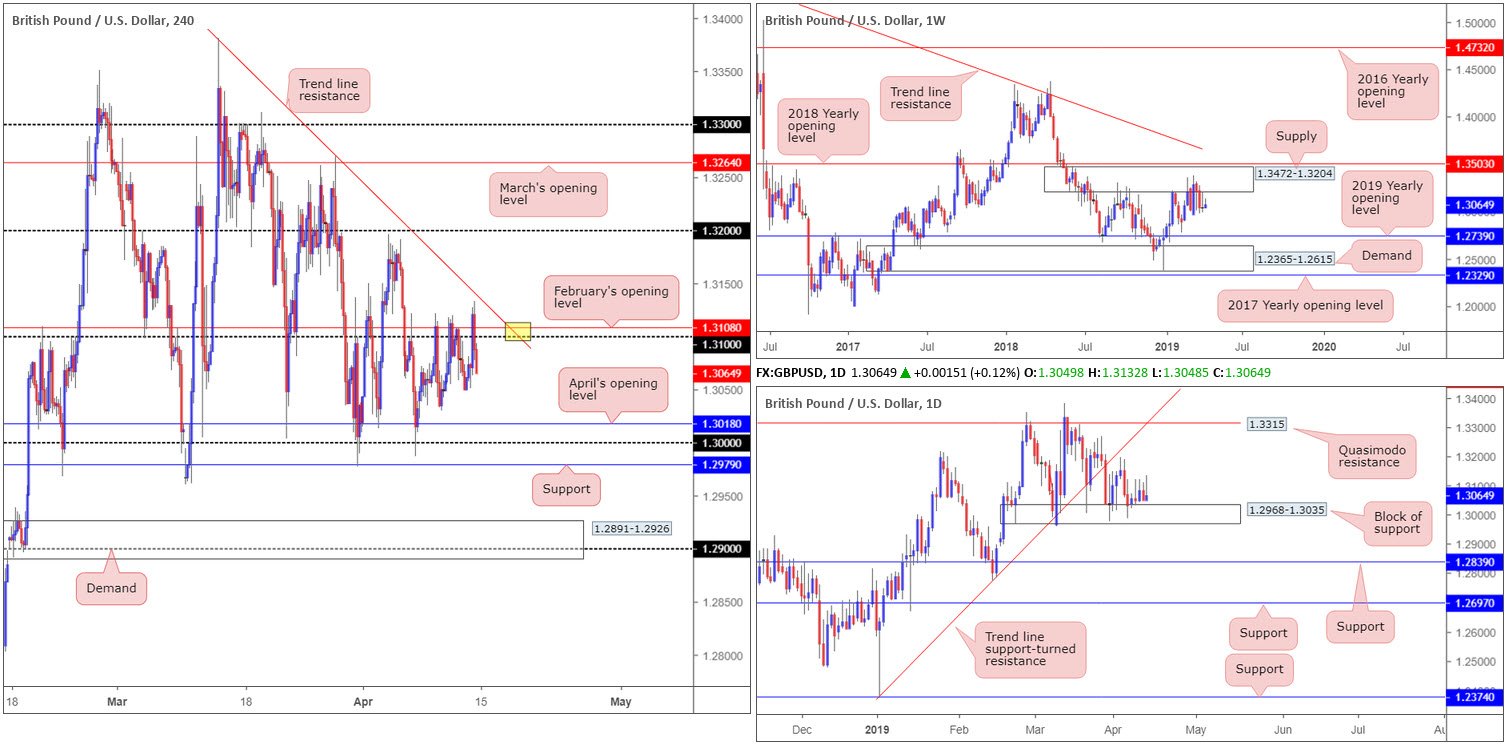
Weekly movement continues to consolidate around the underside of supply at 1.3472-1.3204, situated a few points south of the 2018 yearly opening level at 1.3503. Since the end of February this supply area has been home to many traders.
With the next obvious downside target not realised on this timeframe until the 2019 yearly opening level at 1.2739, followed by demand coming in at 1.2365-1.2615, sellers still have plenty of room to manoeuvre if they press lower.
Daily perspective:
Against the backdrop of weekly flow, daily activity remains teasing a block of support at 1.2968-1.3035. Buying from here is likely to find resistance at a Quasimodo formation drawn from 1.3315, closely followed by a trend line support-turned resistance (extended from the low 1.2373).
In the event the current support fails, as weekly structure suggests, support coming in at 1.2839 is in sight, alongside another layer of support at 1.2697 (at this point we’ll be trading below the 2019 yearly opening level on the weekly timeframe).
H4 perspective:
Sterling, at the outset, benefitted from a risk-on environment Friday, advancing to a weekly high at 1.3132. Despite an encouraging effort, the GBP/USD failed to preserve its upside presence and retreated from the said peak, consequently drawing under 1.31 into the closing bell.
The key observation on the H4 timeframe, therefore, remains at 1.31, which dovetails closely with February’s opening level at 1.3108. Close by, the research team also notes trend line resistance (etched from the high 1.3380). Support, on the contrary, has Tuesday’s low 1.3030 on the radar, tailed by April’s opening level at 1.3018, key figure 1.30 and support priced in at 1.2979.
Areas of consideration:
In similar fashion to previous reports, higher-timeframe structure offers an indecisive picture at present, leaving traders with only H4 levels to work with at the moment.
The point the current H4 trend line resistance (1.3380) merges with 1.3108/1.31 (yellow) offers attractive confluence and, therefore, is likely to produce a bounce if tested this week. Although this area draws in reasonably robust confluence from the H4 timeframe, the base lacks higher-timeframe convergence. For that reason, waiting for additional H4 confirmation to form prior to pulling the trigger is recommended (entry/risk levels can be determined according to this structure).
Traders interested in entering long from the 1.30 region, according to our technical studies, bring with them a clear block of daily support mentioned above at 1.2968-1.3035, along with nearby H4 supports highlighted in bold. Though this region is likely to encourage buyers, the main concern is on the weekly timeframe: supply at 1.3472-1.3204. As a result, it may also be worth considering waiting for H4 confirmation to form here as well.
Today’s data points: MPC Member Haskel Speaks.
AUD/USD:
Weekly gain/loss: +0.97%
Weekly close: 0.7171
Weekly perspective:
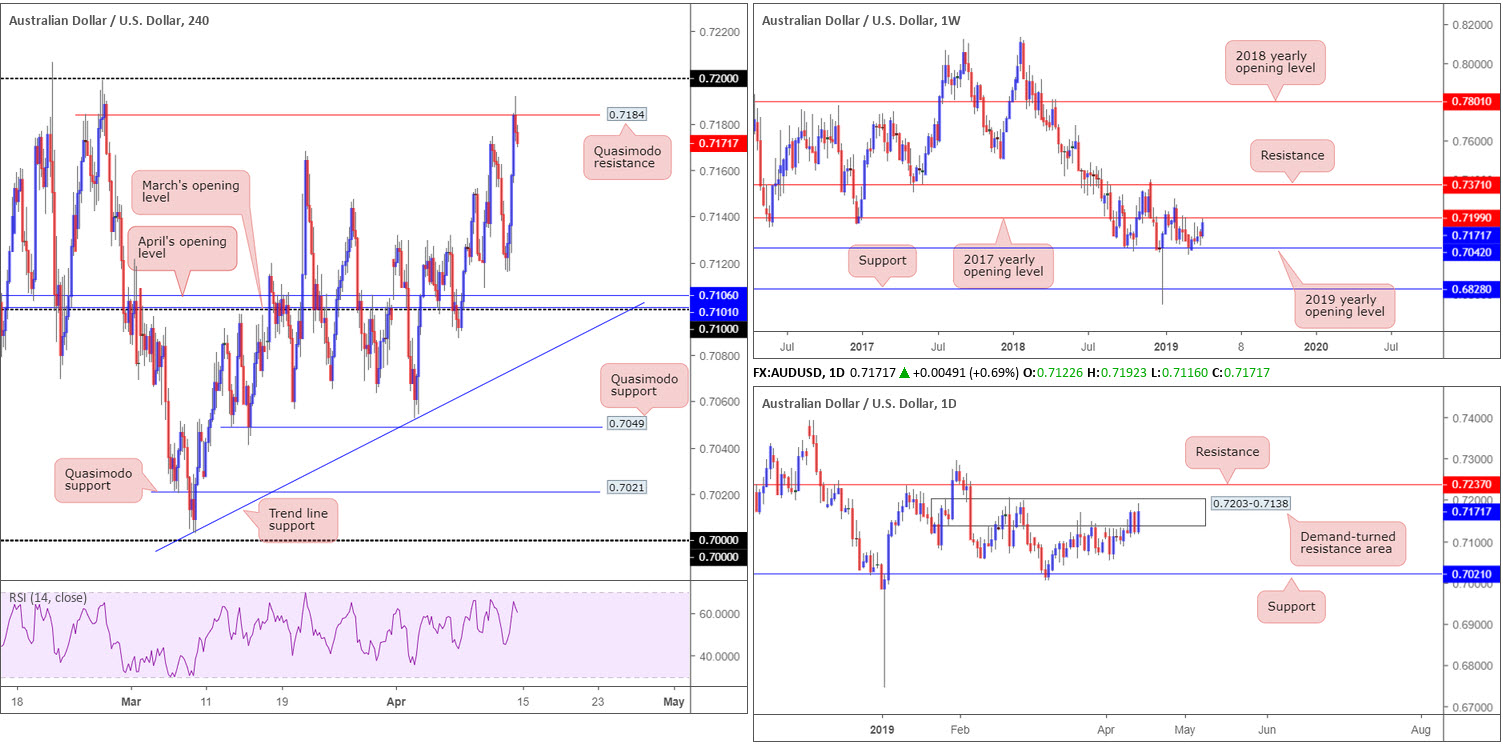
Since mid-February, the weekly candles have been carving out a reasonably tight consolidation between the 2017/2019 yearly opening levels at 0.7199/0.7042. As you can see, last week’s movement wrapped up a few pips south of the upper limit of this range, therefore the outlook on this scale potentially bodes well for sellers this week.
Daily perspective:
Following a modest rebound off support at 0.7021 early March, the pair, since March 20, has been clinging to the underside of a demand-turned resistance area at 0.7203-0.7138. A push higher from here may eventually land the unit at resistance drawn from 0.7237.
H4 perspective:
A brief overview of Friday’s session on the H4 timeframe reveals the commodity-linked currency gained traction amid a strong risk-on environment. Further fuelling the advance were Chinese trade figures, which surprised to the upside. The day ended with the piece crossing swords with a Quasimodo resistance at 0.7184 and mildly paring gains.
Although the current Quasimodo is holding as resistance, the temptation to climb higher and draw in sellers from the 0.72 handle is there due to its connection with the 2017 yearly opening level on the weekly timeframe at 0.7199. It is also worth bearing in mind 0.72 is tucked within the upper limits of the daily demand-turned resistance area at 0.7203-0.7138.
Areas of consideration:
Further selling from the aforementioned H4 Quasimodo resistance level is a possibility today/early week, though the 0.71 handle is the more attractive resistance, according to our technical studies. Should the unit test 0.72 and hold by way of a H4 bearish candlestick pattern (or any confirmation method of your choosing – entry/risk levels to be determined according to this structure), the odds of a selloff emerging from here are high. The ultimate downside target from 0.72 falls in around 0.71 (note April and March’s opening levels here at 0.7106/0.7101), but do bear in mind the unit could, in theory, reach as far south as 0.7042: the 2019 yearly opening level mentioned above on the weekly timeframe.
Today’s data points: Limited.
The accuracy, completeness and timeliness of the information contained on this site cannot be guaranteed. IC Markets does not warranty, guarantee or make any representations, or assume any liability with regard to financial results based on the use of the information in the site.
News, views, opinions, recommendations and other information obtained from sources outside of www.icmarkets.com.au, used in this site are believed to be reliable, but we cannot guarantee their accuracy or completeness. All such information is subject to change at any time without notice. IC Markets assumes no responsibility for the content of any linked site. The fact that such links may exist does not indicate approval or endorsement of any material contained on any linked site.
IC Markets is not liable for any harm caused by the transmission, through accessing the services or information on this site, of a computer virus, or other computer code or programming device that might be used to access, delete, damage, disable, disrupt or otherwise impede in any manner, the operation of the site or of any user’s software, hardware, data or property.


