
Key risk events today:
Limited.
(Previous analysis as well as outside sources – italics).
EUR/USD:
Weekly gain/loss: -0.09%
Weekly close: 1.2109
Weekly perspective:
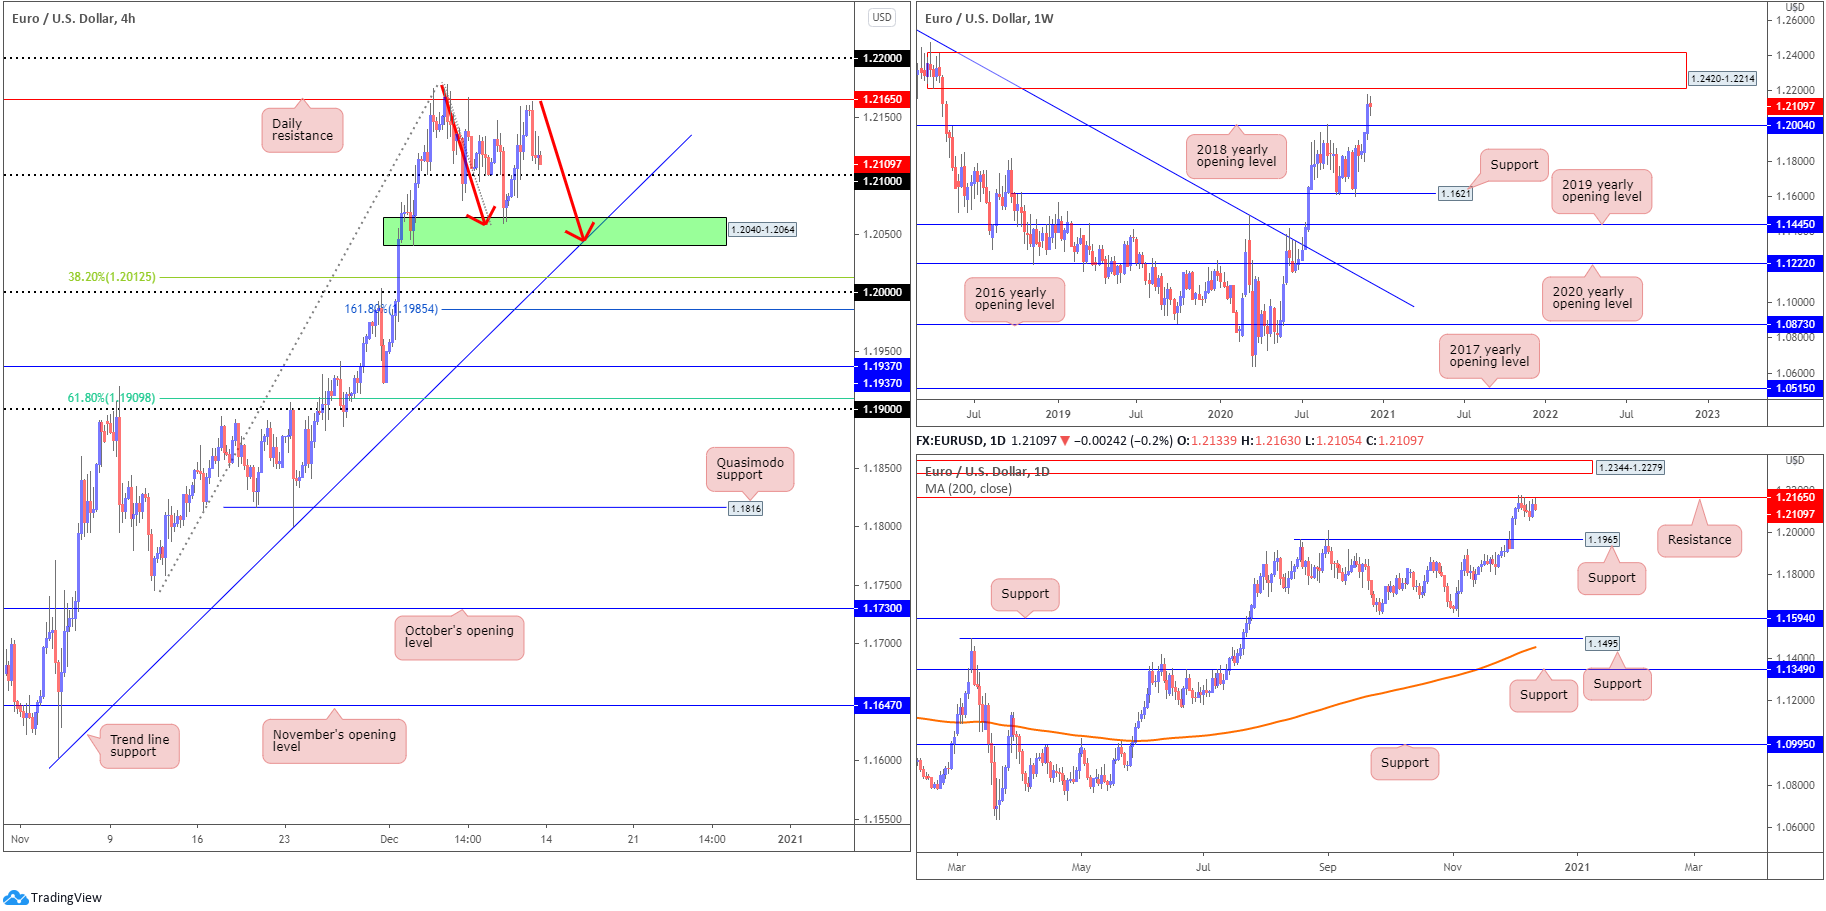
Europe’s single currency wrapped up the week mostly unmoved against its US counterpart, clutching the upper bounds of the prior week’s action.
The technical picture on the weekly chart reveals EUR/USD recently overwhelmed the 2018 yearly opening value at 1.2004, drawing out supply at 1.2420-1.2214.
In terms of trend, it seems upside remains favoured, more so if price overthrows the 1.2555 February 12 high (2018). The above implies buyers could remain at the wheel this week until testing the aforementioned supply zone.
Daily perspective:
Before reaching weekly supply, buyers must contend with daily resistance at 1.2165, a level that made an appearance at the beginning of December.
A solid rejection here shines the spotlight on support at 1.1965, a previous Quasimodo resistance. A 1.2165 break, on the other hand, swings the pendulum in favour of a run to supply drawn from 1.2344-1.2279 (sited within the parapets of current weekly supply).
H4 perspective:
Friday, as you can see, finished on the backfoot, spinning south of daily resistance underlined above at 1.2165. While 1.22 stands as the next port of resistance above 1.2165, the 1.21 handle is considered possible support, with a break shifting attention to demand plotted at 1.2040-1.2064 and trend line support, extended from the low 1.1602. What’s also technically appealing on this scale is the possible formation of an ABCD bullish pattern (red arrows) terminating at the aforementioned trend line support, around 1.2042.
Should price reach the noted demand this week, traders are also urged to pencil in the possibility of a drop to test the key figure 1.20, bracketed within a 38.2% Fibonacci retracement ratio at 1.2012 and a 161.8% Fibonacci extension point at 1.1985.
Areas of consideration:
- The uptrend remains healthy, seen clearly from both the weekly and daily timeframes.
- H4 demand at 2040-1.2064, in addition to trend line support and ABCD convergence, is an interesting point. Though pushing beyond these areas shines the spotlight on 1.20 and nearby Fibonacci studies.
- Daily resistance at 1.2165 is perhaps a level to have noted this week, due to the number of times buyers failed to overthrow the barrier.
- 1 22 is also a significant ceiling to watch, one which could entice sellers. A mild fakeout above the level, a whipsaw that not only taps into any buy-stops above 1.22 but also tests the underside of weekly supply at 1.2214 (potentially strong offers), unlocks the possibility of fresh sellers making an appearance.
GBP/USD:
Weekly gain/loss: -1.57%
Weekly close: 1.3217
Weekly perspective:
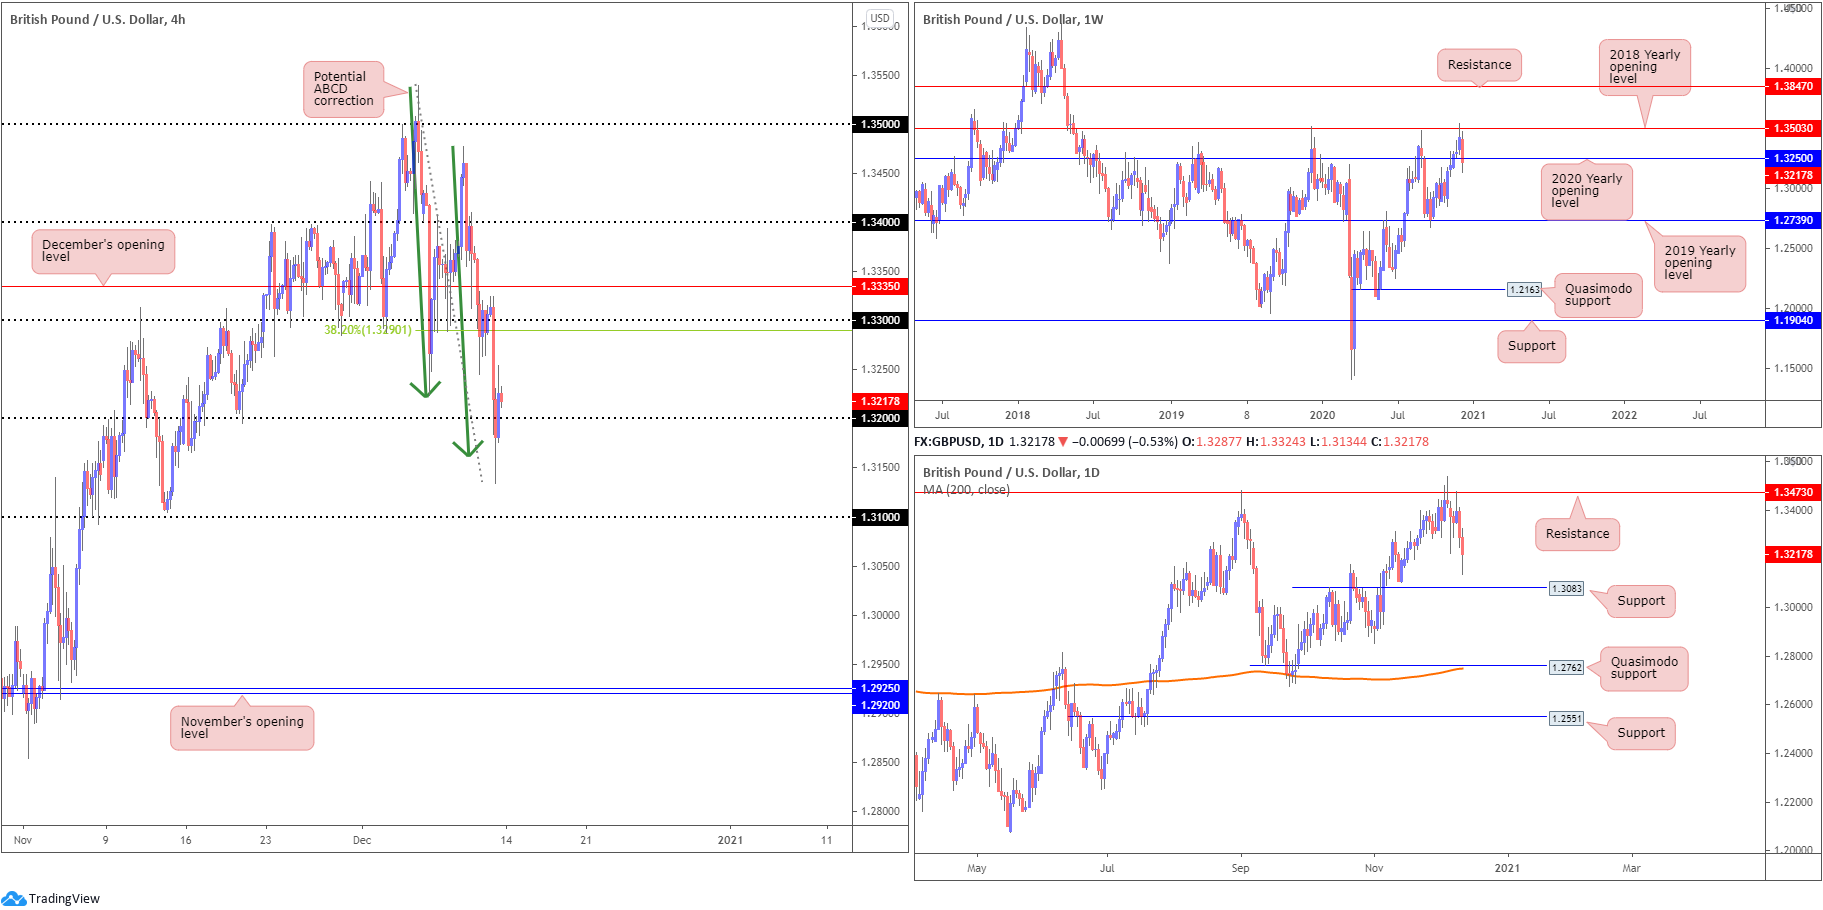
After registering fresh YTD highs the week prior, and shaking hands with the 2018 yearly opening value at 1.3503, the British pound was a clear laggard last week, recoiling more than 200 pips against the buck. Settling just south of the 2020 yearly opening value at 1.3250, and snapping a five-week bullish phase, sellers may strengthen their grip this week, ultimately targeting the 2019 yearly opening value at 1.2739.
Despite the recent correction, buyers have governed control since March.
Daily perspective:
The daily chart, as you can see, provides a magnified view of the current uptrend.
The chart also parades resistance at 1.3473, with Wednesday establishing a shooting star pattern off the level, and Thursday and Friday’s sessions responding strongly to the downside. Interestingly, a lack of support is seen until reaching the 1.3083 region, a previous Quasimodo resistance barrier.
H4 perspective:
Sterling unwound Brexit optimism last week after UK Prime Minister Boris Johnson announced that there was a strong possibility the UK will exit the EU without a deal.
Friday’s technical framework witnessed H4 action dip its toe in waters south of the 1.32 handle, filling a number of stops and crossing swords with an ABCD bullish pattern (green arrows) at 1.3162. Buying pressure reclaimed 1.32+ status in the later hours of trading, and refocused attention towards the 1.33 vicinity and 38.2% Fibonacci retracement ratio at 1.3290.
Note that 1.3290 is likely viewed as the initial take-profit level from the ABCD bullish pattern.
Areas of consideration:
- Should H4 remain north of 1.32, ABCD longs are likely to target the 1.33ish region in early trading this week. This may even reignite interest off weekly support at 1.3250 (the 2020 yearly opening value).
- Brushing aside 1.32 (H4), however, signals a bearish theme, with technical eyes perhaps focussed on the 1.31 handle and daily support seen close by at 1.3083.
AUD/USD:
Weekly gain/loss: +1.42%
Weekly close: 0.7530
Weekly perspective:
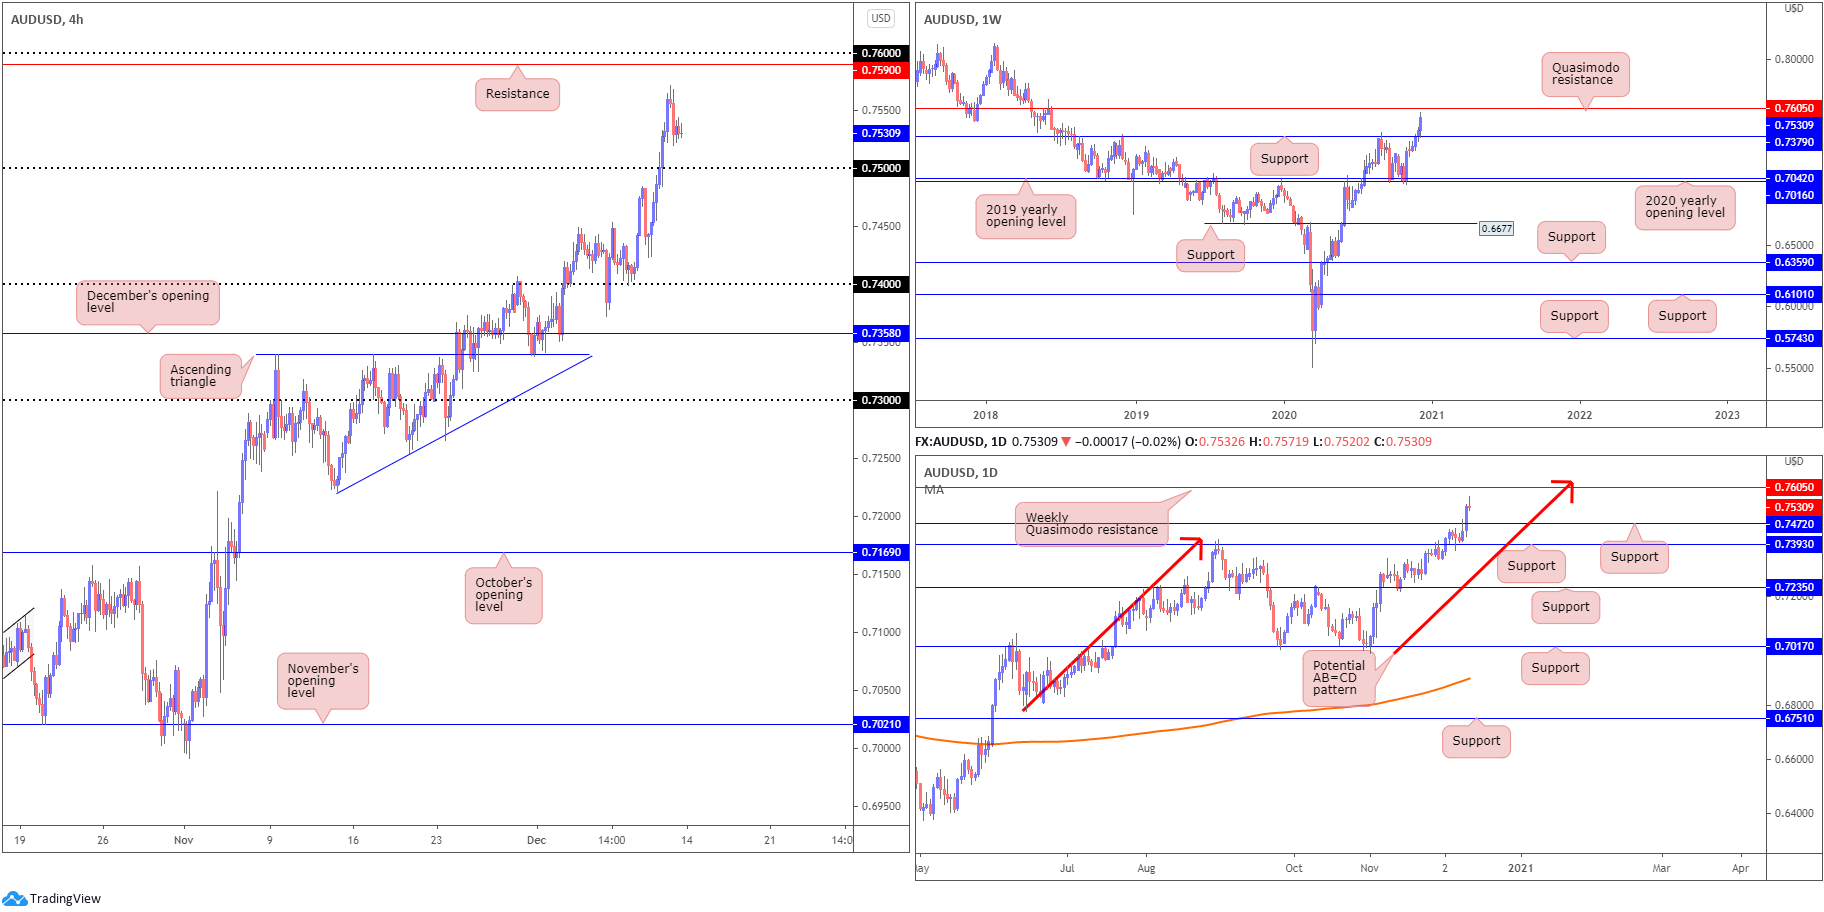
AUD/USD decorated the weekly chart with another cheerful week, gaining more than 100 pips and refreshing YTD highs following a surge in iron ore prices.
Following a retest of support at 0.7379, the pair recorded a fourth consecutive weekly advance. In view of this market trending higher since early 2020, buyers may be eyeballing Quasimodo resistance parked at 0.7605 this week.
Daily perspective:
Friday’s focus likely rests on the shooting star candle pattern, formed off YTD peaks. Although lacking resistance, this could prompt mild selling early week, possibly driving a retest at support drawn from 0.7472.
To the north of price, weekly Quasimodo resistance mentioned above at 0.7605 is seen, accompanied by a daily AB=CD approach (red arrows) at 0.7624.
H4 perspective:
Potential support is observed around the 0.75 handle on the H4 scale and resistance stands in at the 0.7590 point, closely shadowed by 0.76. It is also worth highlighting that just beneath 0.75, daily support rests at 0.7472, while circling just above 0.76 we have weekly Quasimodo resistance plotted at 0.7605.
Areas of consideration:
- The combination of daily support at 0.7472 and the 0.75 handle on the H4 is stimulating support.
- 76 on the H4 echoes robust resistance, placed nearby H4 resistance at 0.7590 and weekly Quasimodo resistance at 0.7605.
USD/JPY:
Weekly gain/loss: -0.20%
Weekly close: 103.96
Weekly perspective:
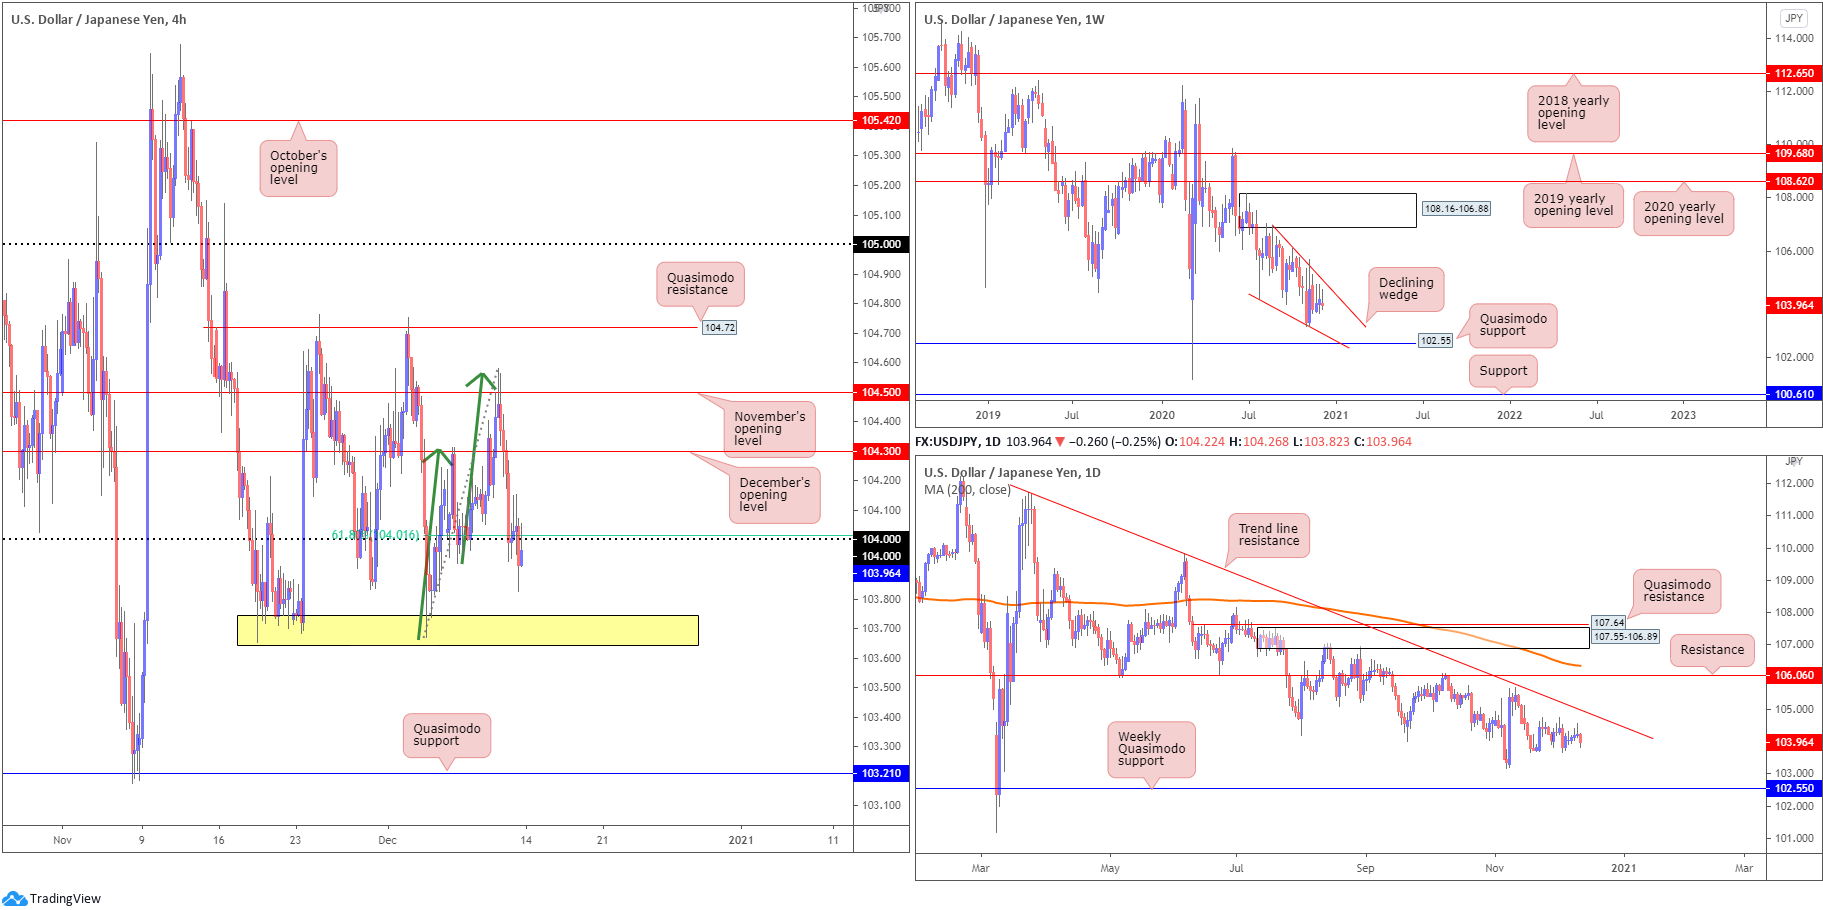
Since connecting with the underside of weekly supply at 108.16-106.88 in August, price has gradually shifted lower and developed a weekly declining wedge (106.94/104.18). Quasimodo support at 102.55 is also in the picture, with a break revealing support plotted at 100.61. A strong bounce from 102.55, however, may provide enough impetus for buyers to attempt a breakout above the current declining wedge.
Daily perspective:
The technical landscape on the daily timeframe reveals scope to close in on trend line resistance, extended from the high 111.71. Sellers taking over this week, nevertheless, could lead price to the 103.17 November 6 low, followed by the noted weekly Quasimodo support at 102.55.
H4 perspective:
For those who read Friday’s technical briefing you may recall the following (italics):
USD/JPY welcomed a soft tone on Thursday, pressured by the DXY fading 91.00. Technically, H4 candles connected with November’s opening value priced in at 104.50 and formed an AB=CD bearish pattern (green arrows) at 104.56. This led the unit back under December’s opening value at 104.30, and shifted focus to the 104 handle (and 61.8% Fibonacci retracement ratio at 104.01). The plot of support below 104, around 103.70 (yellow), also remains important.
As evident from the H4 scale, Friday’s session appears to have cleared bids from around the 104 region, clocking session troughs at 103.82. With 104 to perhaps serve as resistance, this week could welcome 103.70 support into the picture and possibly the H4 Quasimodo support framed at 103.21.
Areas of consideration:
- 104 resistance could be an area that may interest intraday players today/early week, targeting 103.70 on the H4 scale.
- Removing H4 support around 103.70 moves H4 Quasimodo support at 103.21 on to the radar as a possible downside objective for intraday bearish scenarios.
USD/CAD:
Weekly gain/loss: -0.11%
Weekly close: 1.2768
Weekly perspective:
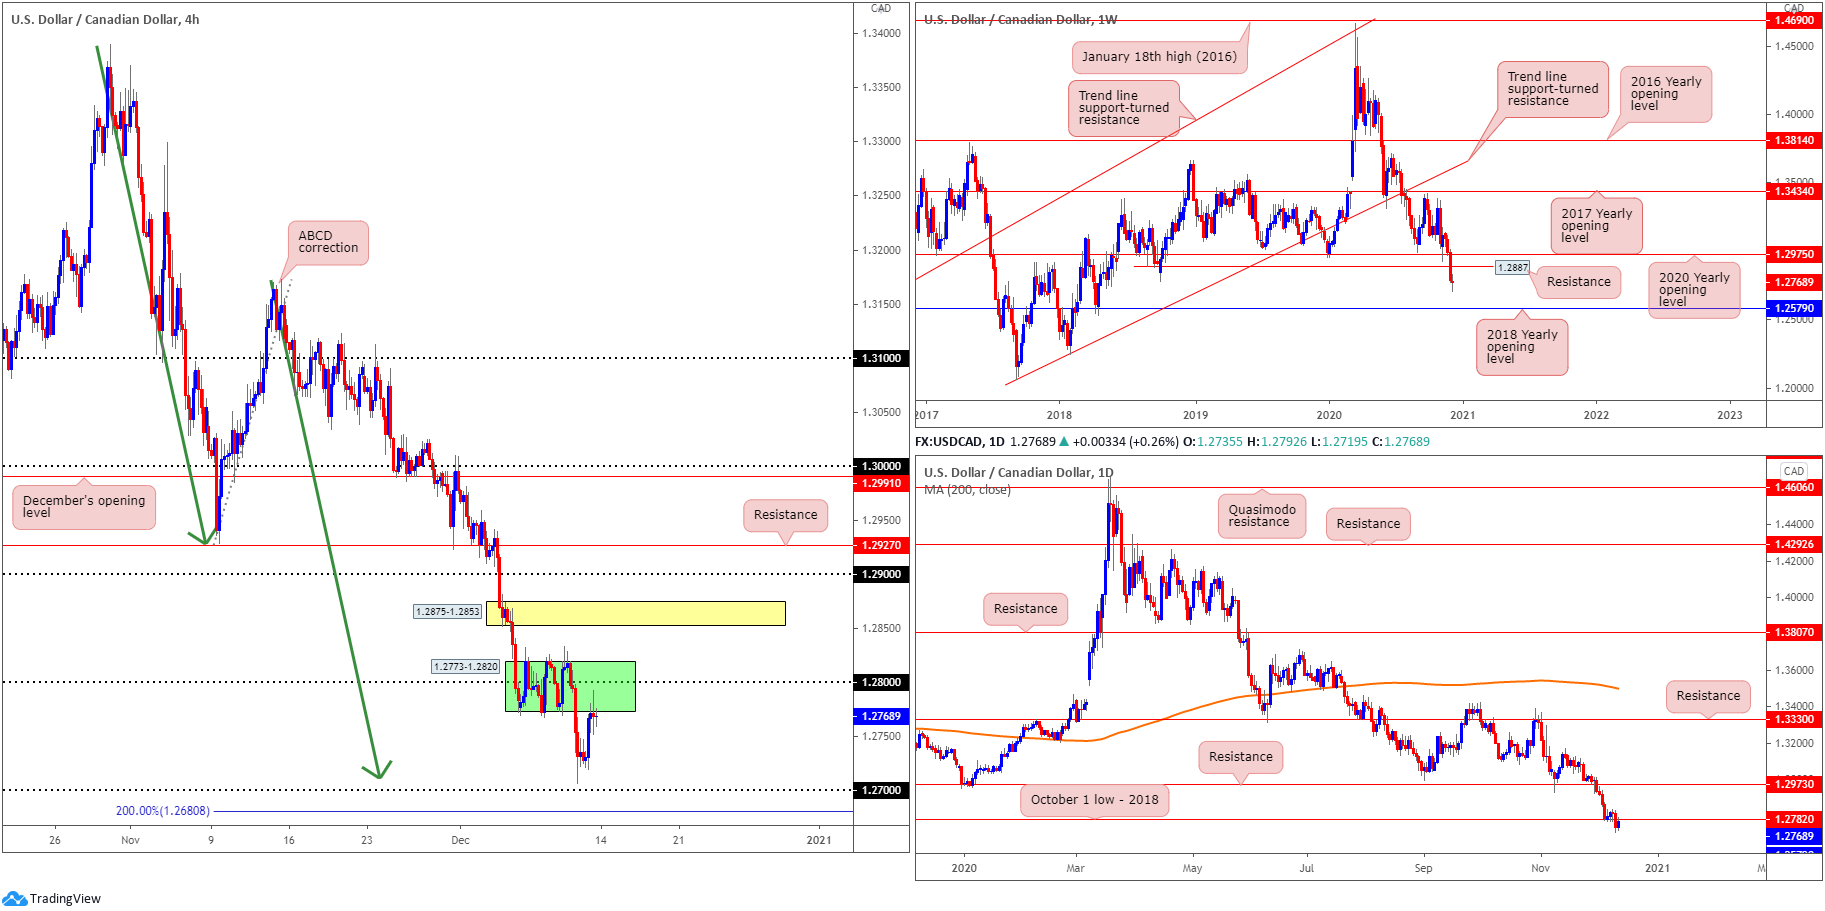
The past four weeks has seen USD/CAD obliterate the 2020 yearly opening value at 1.2975 and Quasimodo support coming in at 1.2887, collectively dropping more than 360 pips.
With both 1.2975 and 1.2887 depicting resistance this week, sustained downside places the 2018 yearly opening value at 1.2579 in the firing line.
Also important to note is that long-term flow has been pointing lower since topping in March.
Daily perspective:
According to the daily timeframe, last week’s selling set aside bids at daily support from 1.2782 (October’s low, 2018), consequently enhancing the weekly timeframe’s bearish stance towards the 2018 yearly opening value.
H4 perspective:
For those who read Friday’s technical briefing you may recall the following (italics):
Since the beginning of the week, H4 candles have been busy carving out a consolidation around the 1.28 area between 1.2773-1.2820 (green). As you can see, the lower edge of this range was taken out yesterday, scoring multi-year lows just north of the 1.27 handle, a psychological level accompanied by an ABCD correction (green arrows) at 1.2711 and a 2.0 BC projection.
USD/CAD, as you can see, modestly recovered ahead of multi-year lows Friday, leaving 1.27 unchallenged and testing the lower edge of the H4 range at 1.2773. Note this area also happens to converge with daily resistance underlined above at 1.2782.
Areas of consideration:
- Although H4 technicals display reasonably bright support, composed of the 1.27 handle, an ABCD correction at 1.2711 and a 2.0 BC projection at 1.2680, buyers are unlikely to commit. Not only is the daily timeframe retesting resistance at 1.2782, the weekly timeframe recently cleared key support, highlighting room to reach for the 2018 yearly opening value at 1.2579.
- In light of the above, bearish scenarios may form between the underside of the H4 range at 1.2773 and the round number 1.28, targeting 1.27 and possibly, according to the higher timeframes, the 1.26 handle.
USD/CHF:
Weekly gain/loss: -0.25%
Weekly close: 0.8893
Weekly perspective:
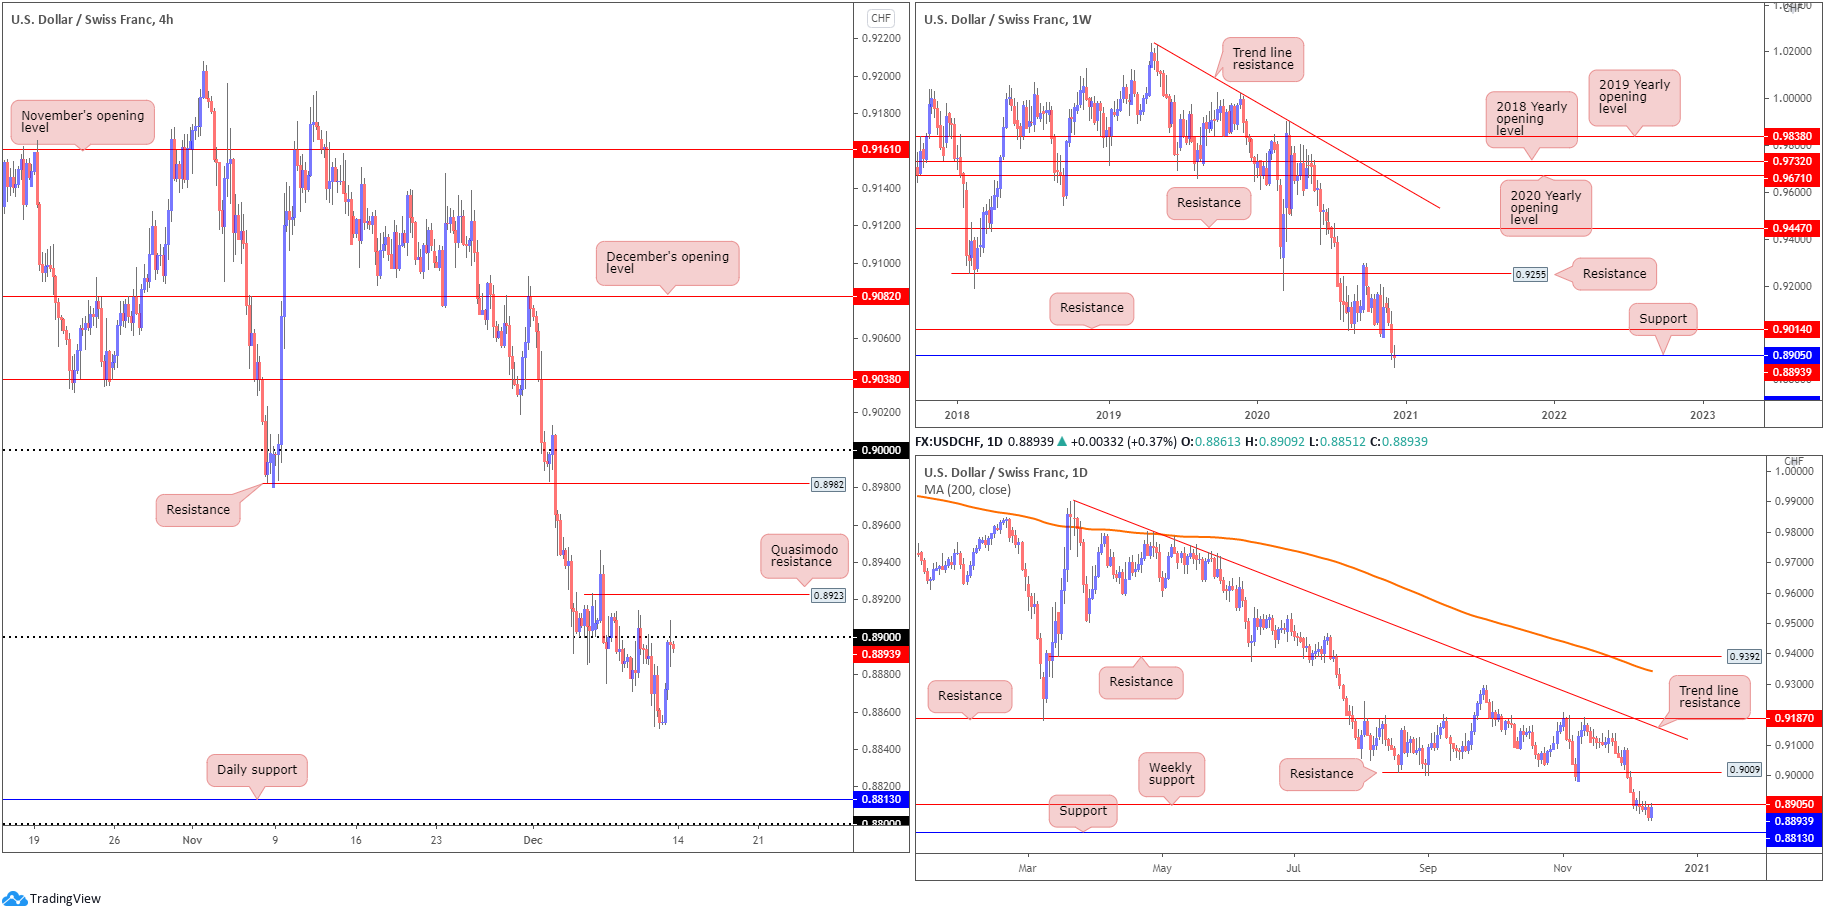
Modestly extending the prior week’s 120-pip decline, detailing a fourth consecutive weekly loss, price action on the weekly scale continues to probe bids around support at 0.8905. While buyers could attempt a recovery off 0.8905 this week, traders are urged to pencil in the possibility of refreshing multi-year lows and shining the limelight on support at 0.8696.
Interestingly, the trend in this market has been lower since early 2019.
Daily perspective:
The framework on the daily timeframe reveals candle action hovering under weekly support at 0.8905. In fact, Friday wrapped up retesting the level as resistance.
Below weekly support at 0.8905 on the daily scale, support is seen at 0.8813, while should buyers stage a recovery this could reignite interest in daily resistance at 0.9009.
H4 perspective:
Strengthened on the back of a moderate revival in the US dollar index on Friday, USD/CHF recovered from multi-year lows and tested highs at 0.8909. With H4 holding the lower side of the 0.89 handle, this could, given the daily timeframe showing weekly support at 0.8905 having its underside tested as resistance, spark bearish themes this week, shifting interest towards daily support at 0.8813 and the 0.88 handle.
Areas of consideration:
- All three timeframes indicate thin buy-side liquidity until reaching 0.88ish, therefore bearish strategies forming off 0.89 on the H4 may interest sellers.
- Should 0.89 fail to provide a ceiling, sellers are likely to shift attention towards H4 Quasimodo resistance at 0.8923.
Dow Jones Industrial Average:
Weekly gain/loss: -0.36%
Weekly close: 30,048
Weekly perspective:
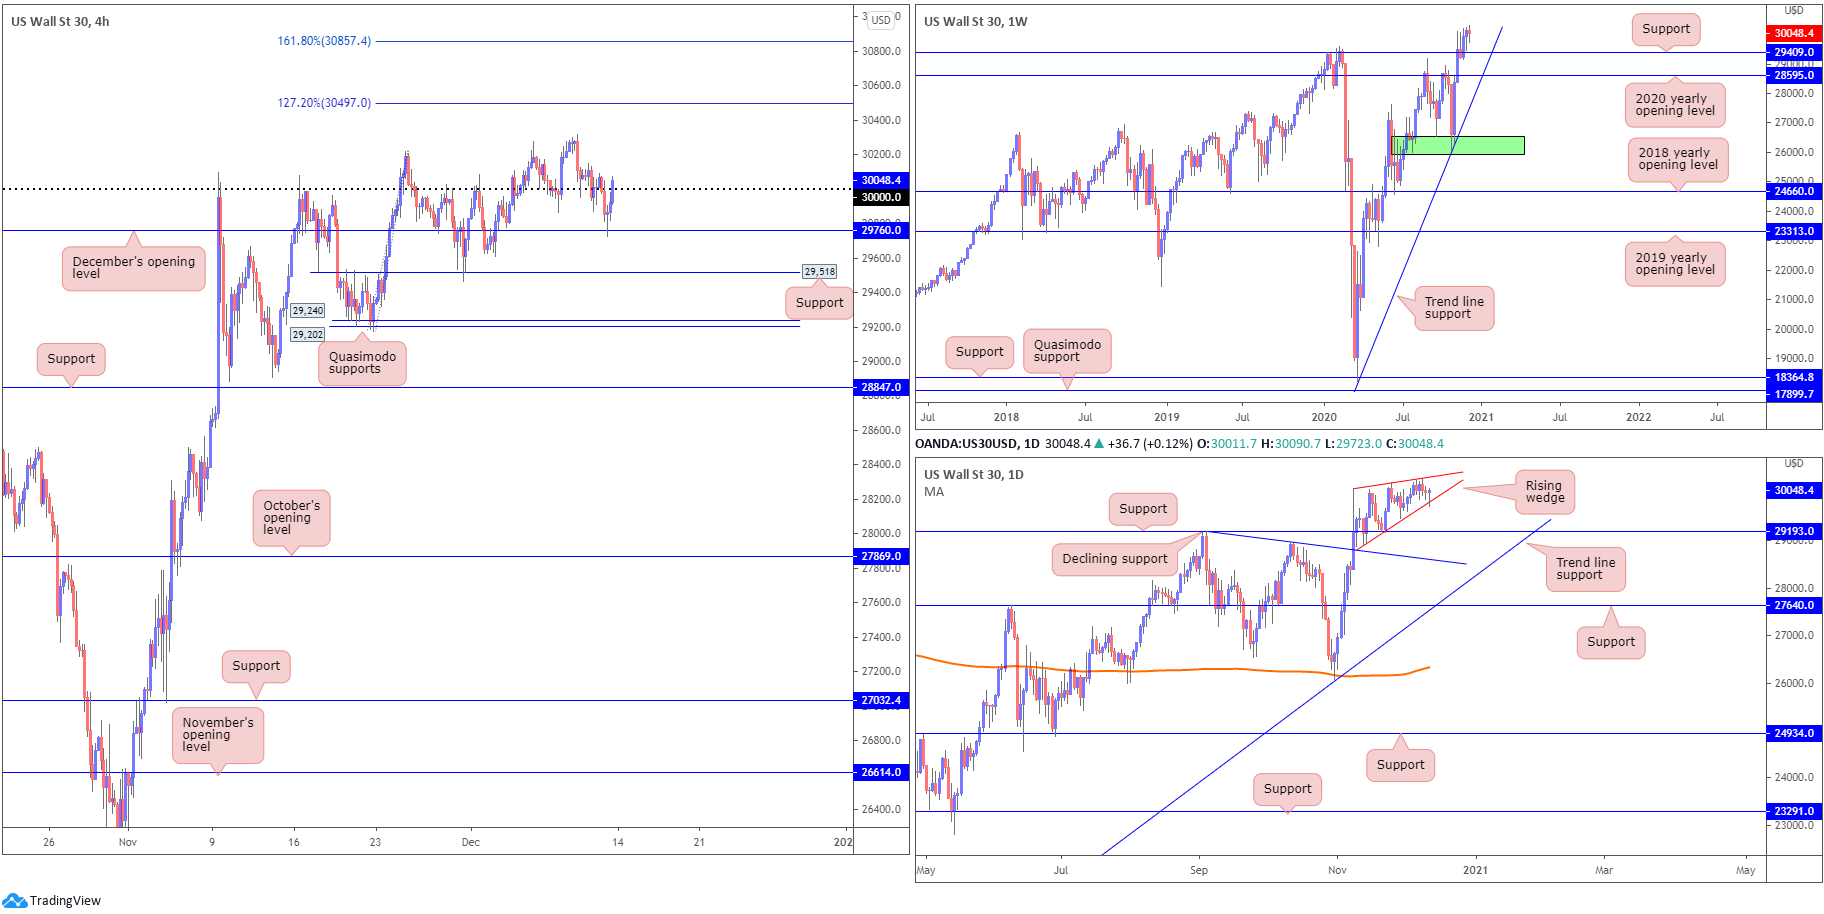
Recent trading, as you can see, clocked fresh records at 30,314 and finished the session considerably off lows. Follow-through breakout buying, therefore, may unfold this week.
However, in the event a correction materialises, support at 29,409 (prior Quasimodo resistance) could be an area dip-buyers find interest in.
The 2020 yearly opening value from 28,595 is also in the frame, tied together with trend line support, taken from the low 18,213.
Daily perspective:
According to the daily timeframe, support is seen at 29,193.
Pattern traders may also acknowledge the rising wedge forming between 28,940/30,097, with Friday establishing a hammer candle pattern off the lower edge of the formation.
H4 perspective:
US equity benchmarks ended Friday mostly lower on stimulus concerns. The Dow Jones Industrial Average advanced 47.11 points, or 0.16%; the S&P 500 dropped 4.64 points, or 0.13% and the Nasdaq shed 27.94 points, or 0.23%.
On the technical front for the H4 timeframe, the widely watched 30,000 figure surrendered on Friday and permitted a test of December’s opening value at 29,760 (aligning closely with the lower edge of the daily rising wedge). The confidence derived from 29,760 elevated the index back above 30,000 into the closing stages of the week.
Subsequent upside could have buyers eventually form fresh all-time peaks and test the 127.2% Fibonacci projection point at 30,497, followed by the 161.8% Fibonacci projection point at 30,857.
Areas of consideration:
- Assuming H4 maintains a bullish position above 30,000, this week may have buyers attempt to refresh all-time records and reach 30,497 and 30,857. Conservative buyers are likely to want to see at least a retest at 30,000 form before taking action.
- A break below the daily rising wedge pattern could see sellers force a retest of daily support at 29,193.
XAU/USD (GOLD):
Weekly gain/loss: +0.03%
Weekly close: $1,839
Weekly perspective:
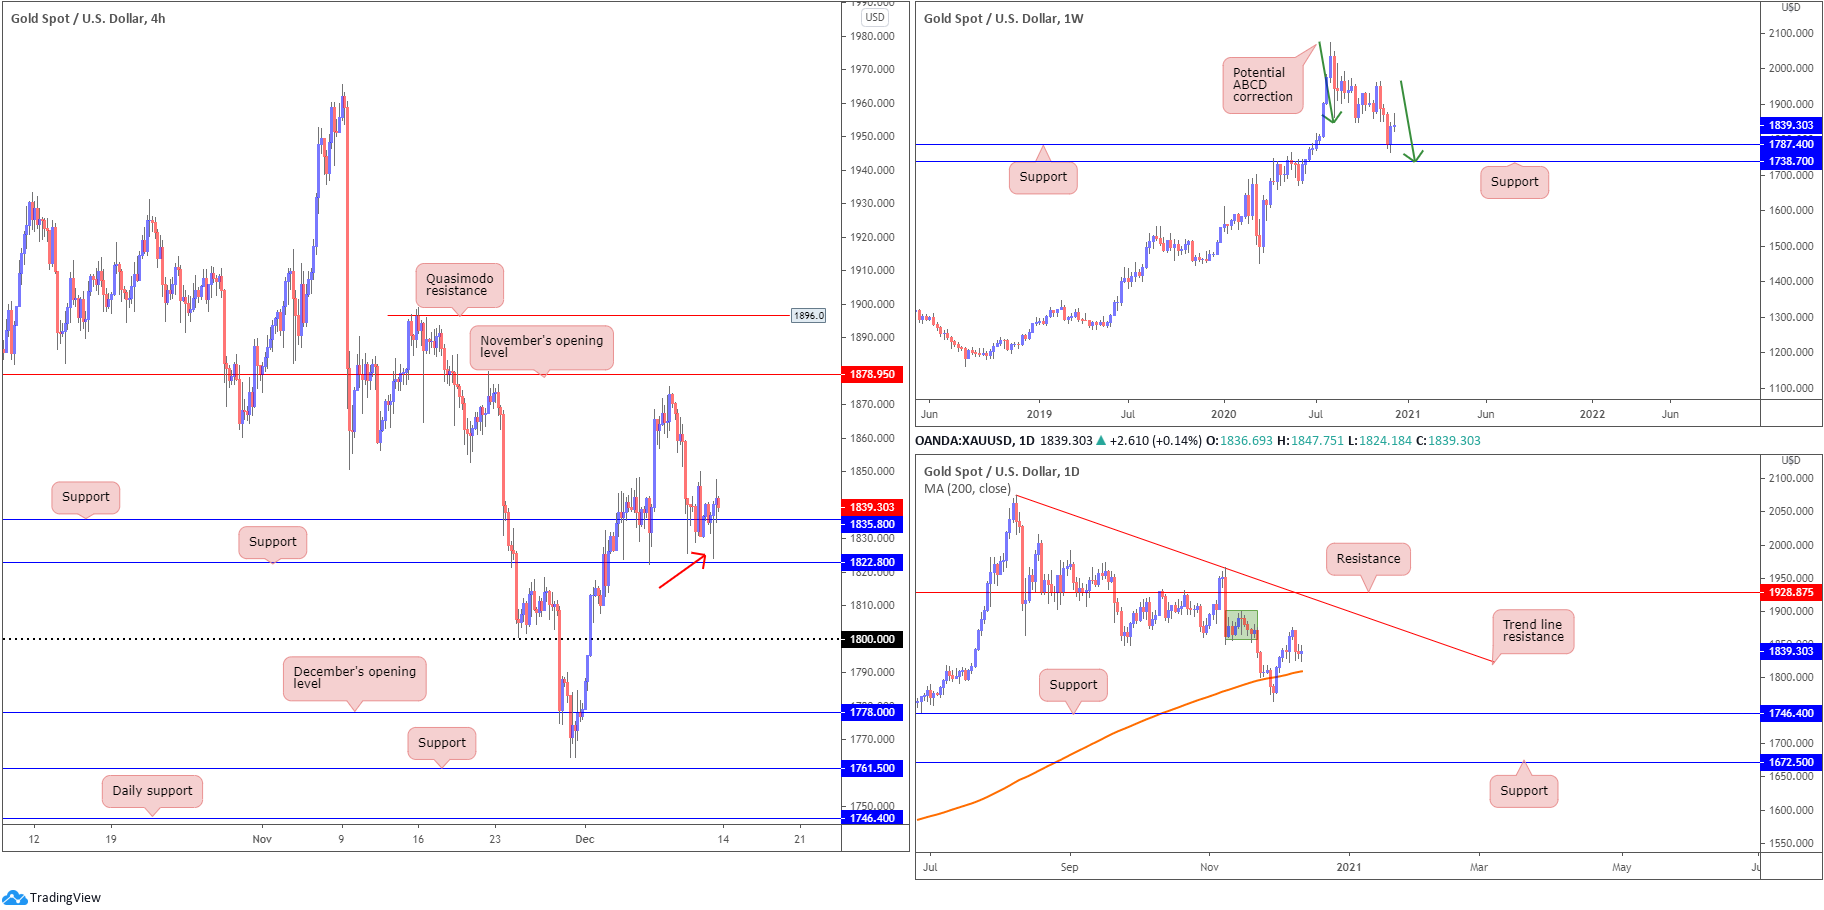
Despite last week finishing considerably off best levels, forming what some analysts may label a gravestone doji candle pattern, support at $1,787 (sited ahead of another support at $1,738 and a potential ABCD correction [green arrows]) remains in play. The fact the yellow metal has been decisively trending higher since the beginning of 2016 adds to the bullish narrative off $1,787.
Daily perspective:
Meanwhile, on the daily chart, supply around $1,878ish (green zone) held upside last week. With this, in spite of the back-to-back indecision candles formed into the close, the 200-day SMA (orange – $1,809) could be retested sometime this week.
H4 perspective:
The price of gold, in $ terms, spent Thursday and Friday’s sessions fluctuating around support priced in at $1,835, forming a hammer candlestick pattern (red arrow), fixed just north of H4 support at $1,822.
Below, focus may shift to the $1,800 region, while journeying higher could challenge November’s opening value at $1,878.
Areas of consideration:
- Buyers appear free to take things higher, according to the trend and weekly support at $1,787.
- The retest at H4 support from $1,835 could still entice buyers, particularly after Friday’s H4 hammer candle, towards November’s opening value at $1,878, though traders are urged to prepare for the possibility of a break to another nearby H4 support at $1,822.
- Below the aforementioned H4 supports, the 200-day SMA is seen as possible support, hovering ahead of $1,800.
The accuracy, completeness and timeliness of the information contained on this site cannot be guaranteed. IC Markets does not warranty, guarantee or make any representations, or assume any liability regarding financial results based on the use of the information in the site.
News, views, opinions, recommendations and other information obtained from sources outside of www.icmarkets.com.au, used in this site are believed to be reliable, but we cannot guarantee their accuracy or completeness. All such information is subject to change at any time without notice. IC Markets assumes no responsibility for the content of any linked site.
The fact that such links may exist does not indicate approval or endorsement of any material contained on any linked site. IC Markets is not liable for any harm caused by the transmission, through accessing the services or information on this site, of a computer virus, or other computer code or programming device that might be used to access, delete, damage, disable, disrupt or otherwise impede in any manner, the operation of the site or of any user’s software, hardware, data or property