
Waiting for lower timeframe confirmation is our main tool to confirm strength within higher timeframe zones, and has really been the key to our trading success. It takes a little time to understand the subtle nuances, however, as each trade is never the same, but once you master the rhythm so to speak, you will be saved from countless unnecessary losing trades. The following is a list of what we look for:
- A break/retest of supply or demand dependent on which way you’re trading.
- A trendline break/retest.
- Buying/selling tails/wicks – essentially we look for a cluster of very obvious spikes off of lower timeframe support and resistance levels within the higher timeframe zone.
We typically search for lower-timeframe confirmation between the M15 and H1 timeframes, since most of our higher-timeframe areas begin with the H4. Stops are usually placed 1-3 pips beyond confirming structures.
EUR/USD:
Weekly gain/loss: +0.50%
Weekly closing price: 1.1662
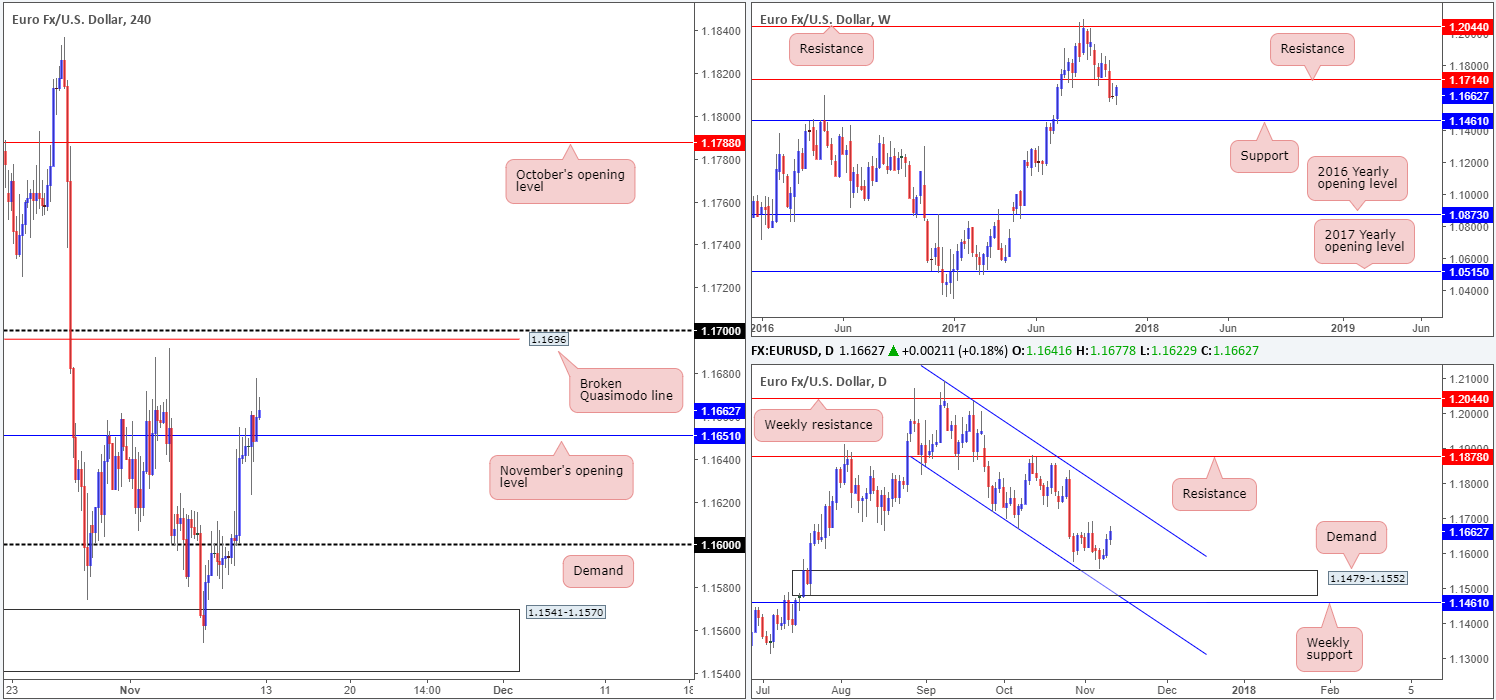
Over the course of last week’s sessions, the single currency managed to recoup some of its recent losses. As can be seen on the weekly timeframe, this has positioned the unit within striking distance of a resistance line pegged at 1.1714. Boasting a reasonably strong history, we feel this line will very likely cap upside this week.
On Tuesday, daily price came within a few pips of shaking hands with the top edge of a demand base seen at 1.1479-1.1552, which happens to be sited just ahead of the aforementioned weekly support. Cleary managing to attract the attention of the buyers here, the euro spent the remainder of week clocking fresh highs. According to the daily timeframe, the sticks could continue to advance this week as the next upside target does not come on to the radar until we reach the channel resistance etched from the high 1.2092.
For those who follow our reports on a regular basis you may recall that in last week’s weekly report the desk underscored a prospective buy trade from a H4 demand area penciled in at 1.1541-1.1570. Our buy order was filled at 1.1567 amid the early hours of Tuesday’s segment, and the stop-loss order was positioned a few pips below the aforesaid H4 demand area at 1.1540. As 1.16 was touched on Wednesday, our first take-profit target, the team decided to reduce risk to breakeven here and bank some profits. Thursday’s advance, however, brought the unit up to our second take-profit zone: November’s opening level at 1.1651. Further profits were banked at this point and the stop-loss order moved up to 1.1595.
Suggestions: Going into the new week, we intend on holding our current long trade as on Friday the H4 candles eventually conquered November’s opening level. We have also moved the stop-loss order up to 1.1621. Positioned a few pips beneath weekly resistance at 1.1714, we decided that the 1.17 handle will be the final take-profit zone for this trade. With it being a nice-looking zone to sell it makes for a strong final target.
Should you have missed the initial long call, and also the second opportunity to buy on the retest of 1.16 on Thursday, you may be given a third opportunity to catch some of the move if H4 price retests 1.1651 this week. From here you could drill down to the lower timeframes (see the top of this report for ideas on how to use lower-timeframe structure to enter) and search for an entry, targeting 1.17.
Data points to consider: FOMC member Harker speaks at 12.10am GMT.
Levels to watch/live orders:
- Buys: 1.1567 ([live] stop loss: 1.1621).
- Sells: Flat (stop loss: N/A).
GBP/USD:
Weekly gain/loss: +0.89%
Weekly closing price: 1.3189
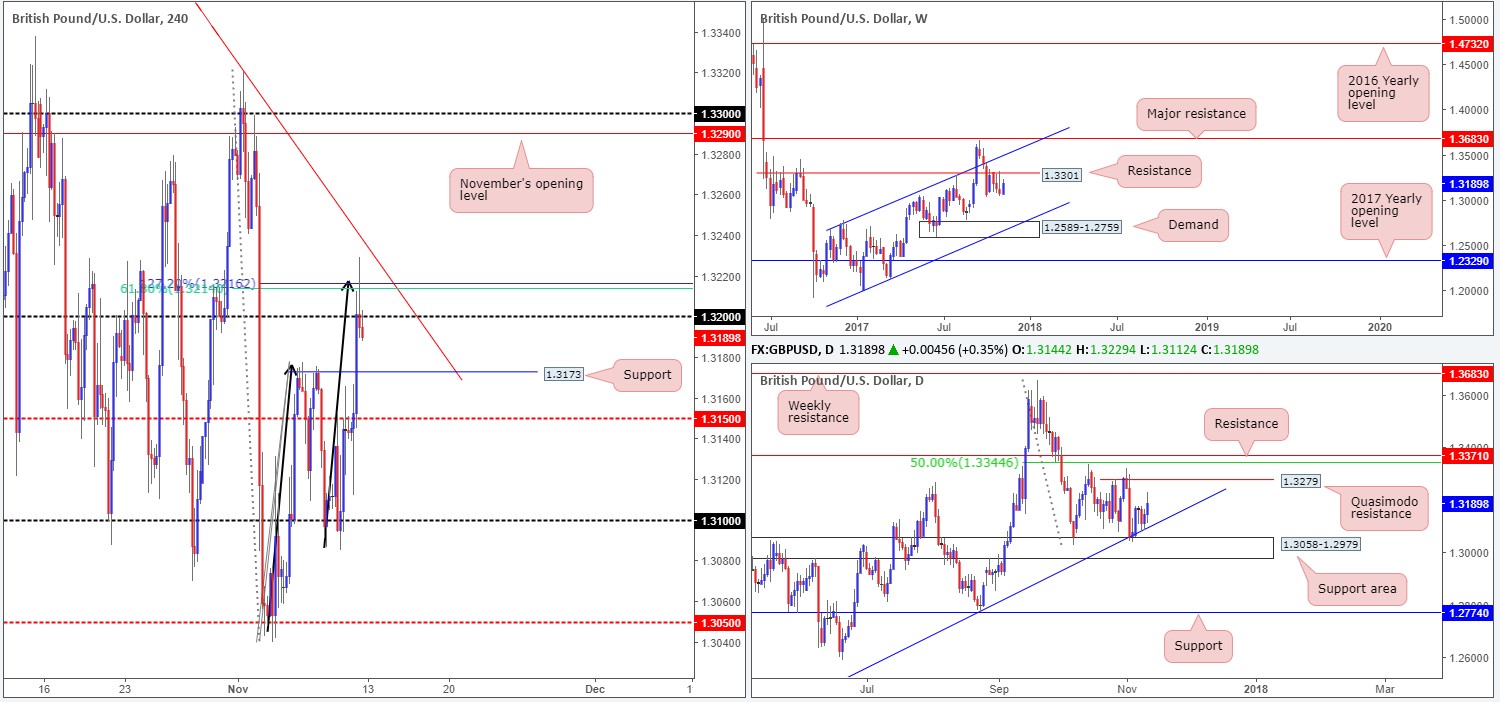
Since early October, the British pound has been consolidating underneath a weekly resistance level plotted at 1.3301. Although the market did chalk up a reasonably healthy gain last week, let’s not forget that three weeks prior to this, three consecutive bearish candles had printed, each one tapping the underside of the noted weekly resistance!
Capping downside in this market, however, is a daily support area seen at 1.3058-1.2979, along with an interconnecting daily trendline support extended from the low 1.2108. One other thing to keep in mind here is the fact that the market, at least from current price on the daily scale, displays room to rally as far north as 1.3279: a daily Quasimodo resistance line. Considering that 1.3279 is located only a few pips beneath the said weekly resistance, this suggests the possibility of an additional test of this weekly line this week.
The impact of Friday’s UK manufacturing figures elevated the GBP, breaking above mid-level resistance 1.3150 which shortly after was retested as support. H4 bulls continued to reassert dominance from this point, consequently concluding the day’s session whipsawing through the 1.32 handle and closing at 1.3189. The other key thing to note here is the H4 AB=CD bearish formation (black arrows) currently in play. Notice how price tapped the AB=CD 127.2% Fib ext. point at 1.3216 (and the 61.8% Fib resistance at 1.3214) before closing sub 1.32.
Suggestions: In view of the higher-timeframe candles potentially being drawn back up to the 1.33 neighborhood this week, a short from the 1.32 handle is somewhat chancy, despite strong H4 confluence surrounding the number! The most we see H4 price tumbling to from 1.32 is the nearby support coming in at 1.3173. For that reason, this is not a trade we would brand high probability.
As such, opting to stand on the sidelines here may very well be the best path to take today.
Data points to consider: FOMC member Harker speaks at 12.10am GMT.
Levels to watch/live orders:
- Buys: Flat (stop loss: N/A).
- Sells: Flat (stop loss: N/A).
AUD/USD:
Weekly gain/loss: +0.13%
Weekly closing price: 0.7657
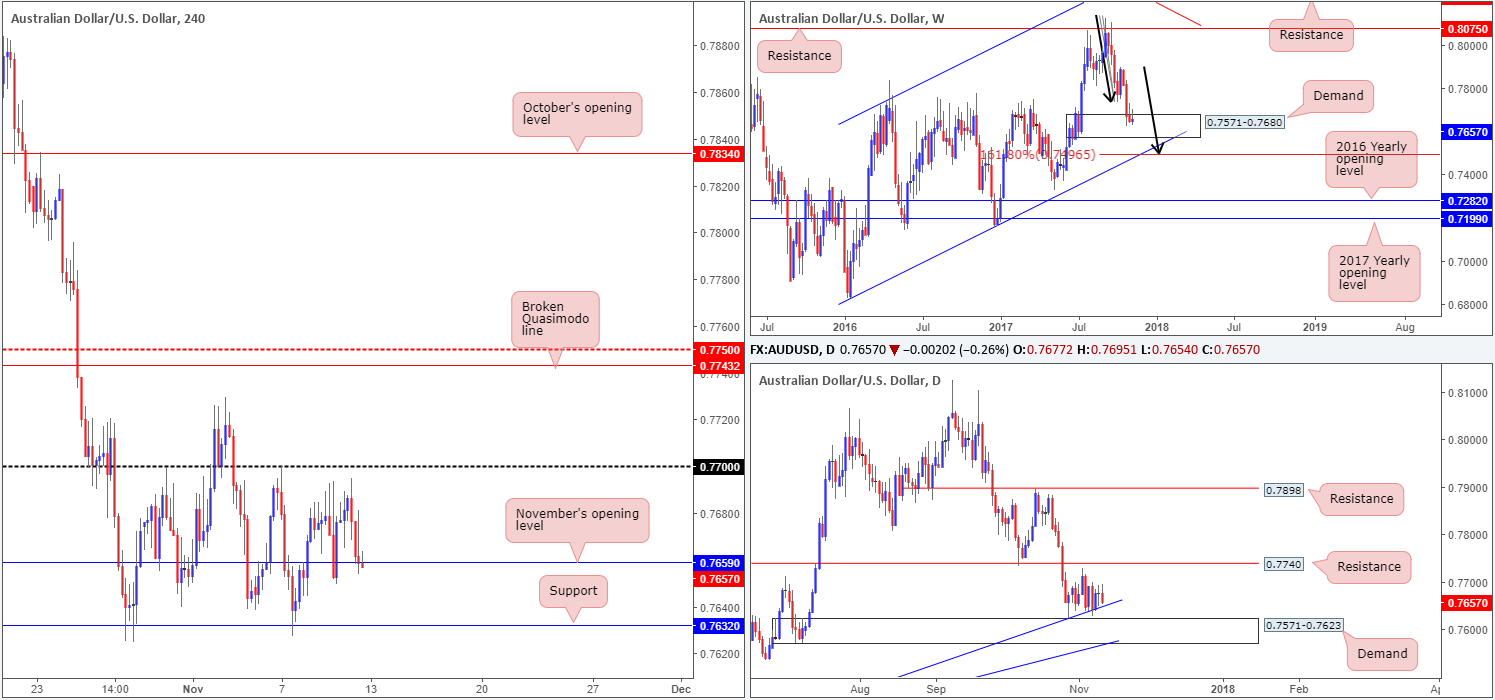
Although the commodity currency managed to chalk up a borderline gain last week, is it enough to convince buyers to long this market from the current weekly demand base at 0.7571-0.7680? Given the recently printed weekly selling wick, we feel the majority of the market is going to be cautious here! In the event that the bears punch lower this week, we could possibly see the noted demand taken out and the weekly channel support extended from the low 0.6827 brought into the fray. What’s tasty about this channel support is the fact that it aligns with an AB=CD (see black arrows) 161.8% Fib ext. at 0.7496.
Down on the daily timeframe, the candles spent last week consolidating above a trendline support etched from the low 0.7328. Perhaps the most compelling factor here though is the daily demand area seen plotted within the lower limits of the aforesaid weekly demand area at 0.7571-0.7623.
In the early hours of Friday’s sessions, the RBA’s monetary policy statement was published. This (seen clearer on the M30 candles) immediately sent the market to a low of 0.7664, but was a short-lived move as price swiftly recoiled. Going into the London session, nevertheless, the unit topped just ahead of the 0.77 handle and fell to November’s opening level at 0.7659 by the day’s end.
Suggestions: This is not an appealing market right now. With weekly buyers looking incredibly vulnerable within demand and daily price lacking enthusiasm at the current trendline support, as well as little H4 confluence see right now, this leaves us with little choice but to remain flat going into the week.
Data points to consider: FOMC member Harker speaks at 12.10am GMT.
Levels to watch/live orders:
- Buys: Flat (stop loss: N/A).
- Sells: Flat (stop loss: N/A).
USD/JPY:
Weekly gain/loss: -0.46%
Weekly closing price: 113.50
Over the past few weeks, the weekly supply at 115.50-113.85 has been on the radar. Although the sellers have yet to register anything noteworthy from here, this is not your average run-of-the-mill supply as it has held price lower on two separate occasions so far this year. Therefore, there’s a chance that we may see history repeat itself.
Turning our attention to the daily timeframe, we can see that Monday’s action came within 20 or so pips of connecting with a Quasimodo resistance level based at 114.95. It’s a shame price failed to hit this line as we were looking to short from here! The week ended with price basing just ahead of a demand area coming in at 112.29-112.92, which happens to be positioned just ahead of a support line at 111.91.
Friday’s UoM Consumer Sentiment survey eased to 97.8 vs. a 100.8 expectation. In consequence to this, a H1 buying tail printed which sported a bullish follow-through up to just ahead of November’s opening line at 113.65 by the closing bell.
Suggestions: The only opportunity jumping out at us so far is a short from November’s opening level mentioned above at 113.65 (see black arrows). Downside is free on both the weekly and daily charts, at least until the daily demand base comes into the picture at 112.29-112.92. In addition to this, there’s little H4 structure stopping the unit from connecting with the 113 handle.
To secure a sell from 113.65, nonetheless, we would require a full or near-full-bodied H4 bearish candle to form. This will help confirm if there are still active sellers residing here, since sell orders may have already been filled during Thursday’s retest.
Data points to consider: FOMC member Harker speaks at 12.10am; BoJ Gov. Kuroda speaks at 5.45pm GMT.

Levels to watch/live orders:
- Buys: Flat (stop loss: N/A).
- Sells: 113.65 region ([waiting for a reasonably sized H4 bearish candle to form – preferably a full or near-full-bodied candle – is advised] stop loss: ideally beyond the candle’s wick).
USD/CAD:
Weekly gain/loss: -0.63%
Weekly closing price: 1.2684
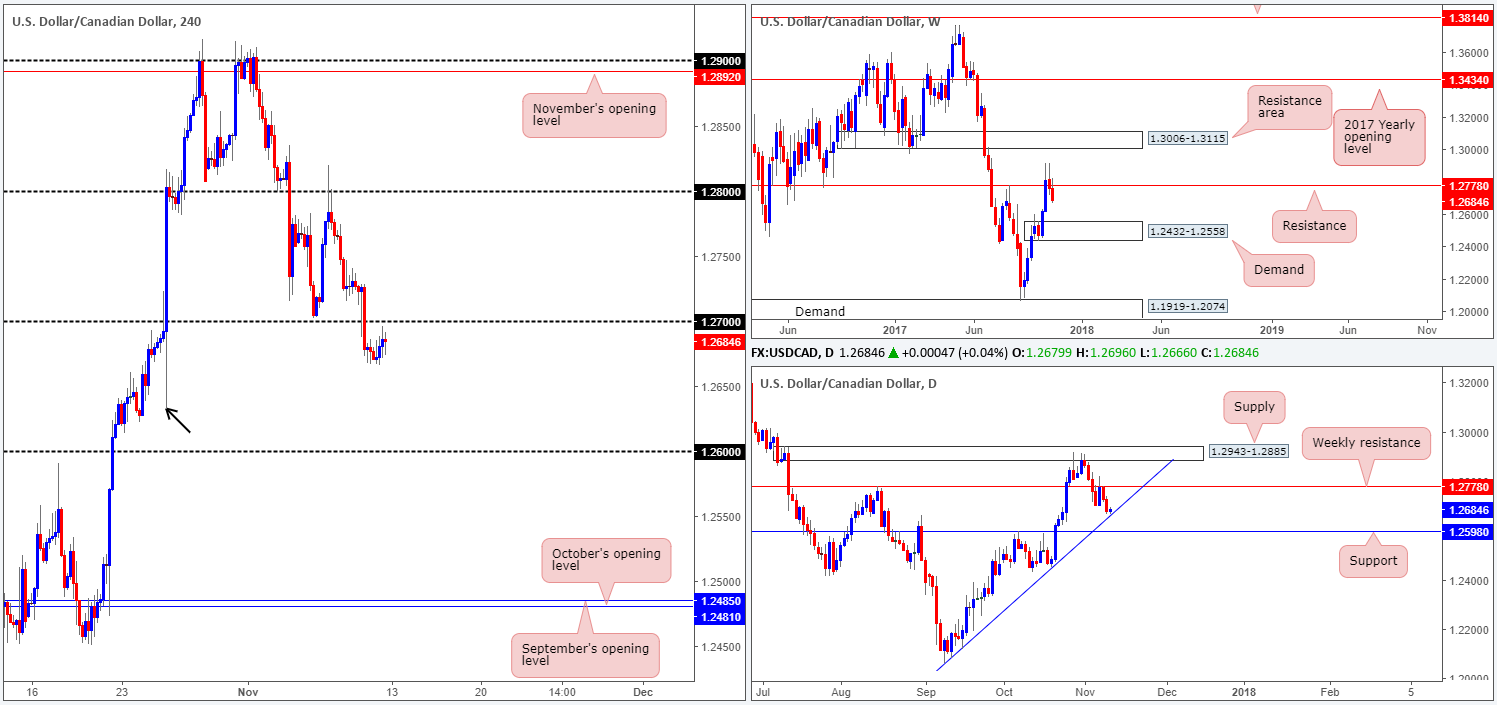
Following a borderline close below 1.2778 the week prior (now a weekly resistance), the USD/CAD extended losses last week. This move could potentially spark further selling this week down to a weekly demand area coming in at 1.2432-1.2558. Boasting a strong base, this demand area communicates strength and, therefore, will likely hold back sellers should the area come into play.
A closer look at the action on the daily timeframe shows that although the weekly candles look poised to stamp lower, sellers still have to contend with the possibility of fresh buyers coming in from the daily trendline support carved from the low 1.2061.
On Thursday the pair came under pressure, outmuscling bids around the 1.27 handle and clocking a low of 1.2667. As is evident from the H4 timeframe, Friday’s movement was quiet as trading volume thinned out due to an empty economic calendar and US banks being closed in observance of Veteran’s Day.
According to the H4 structure, the recent move sub 1.27 possibly unlocked the path south down to the 1.26 handle. The large H4 tail marked with a black arrow at 1.2631 has likely cleared a truckload of bids with this move. Downside is, as highlighted above, further influenced by the fact that weekly price is seen trading strongly beneath resistance at 1.2778. While further selling seems favored right now, knowing that a sell below 1.27 would almost immediately land one within striking distance of the aforementioned daily trendline support makes this a somewhat risky sell, in our book.
Suggestions: On account of the above structure, the team has come to the conclusion that it’d be best to remain flat for the time being. Selling into a daily trendline support, despite weekly and H4 confluence, is not something our team would ever brand high probability.
Data points to consider: FOMC member Harker speaks at 12.10am GMT. Canadian banks will be closed in observance of Remembrance Day.
Levels to watch/live orders:
- Buys: Flat (stop loss: N/A).
- Sells: Flat (stop loss: N/A).
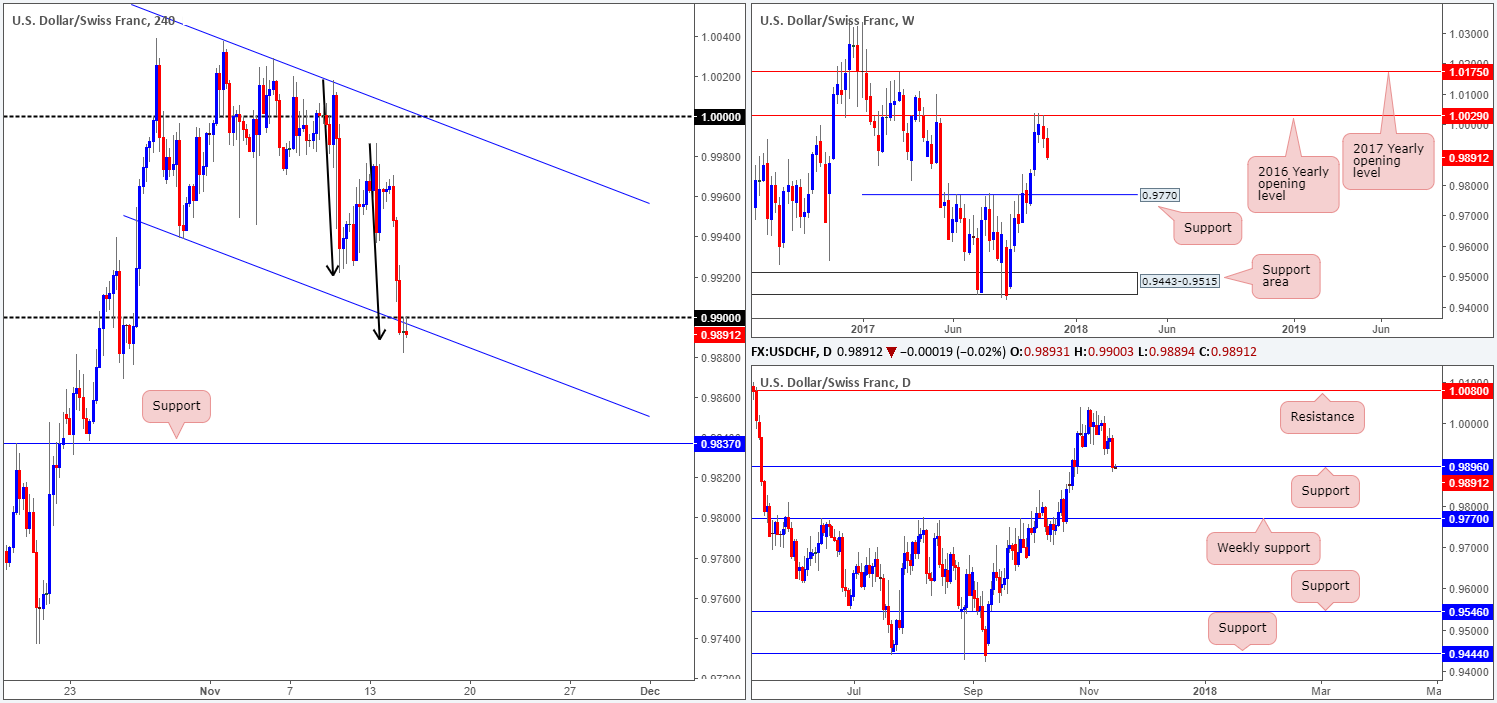
USD/CHF:
Weekly gain/loss: -0.47%
Weekly closing price: 0.9956
After crossing swords with the 2016 yearly opening level seen on the weekly chart at 1.0029 three weeks ago, the sellers finally made an entrance last week. Wiping out all of the prior week’s gains, the downside move could extend as far south as weekly support at 0.9770 in the coming weeks.
Bouncing down to the daily candles, we can noticeably see that since the 27th October price has been trading within a consolidation in between a daily resistance level at 1.0080 and a daily support logged in at 0.9896. Given the push south from the noted 2016 yearly opening level, however, the aforesaid daily support is likely going to enter the fray sometime this week.
Switching over to the H4 timeframe, the Swissie spent Friday treading water around the 0.9928 mark and retested the underside of a trendline resistance taken from the low 0.9938. Of particular interest here should be the fact that fusing with this trendline is a 38.2% Fib resistance at 0.9966 and a local resistance level coming in at 0.9974 (lower green box).
Suggestions: Considering that the daily support does not come into the picture until we reach 0.9896 (essentially the 0.99 handle), and weekly price is showing promise from the 2016 yearly opening level, a sell from the lower green H4 zone could be an option today. If, on the other hand, you fancy a short from parity (1.0000) seen just above, there’s also attractive confluence on display there as well (H4 trendline resistance taken from the high 1.0037 and a 61.8% Fib resistance at 0.9993).
Personally, we favor parity for a sell given that it garners far more attention, as does the 61.8% Fib level over the 38.2% band. Be that as it may, we will only consider a sell valid from here if, and only if, a H4 full or near-full-bodied bearish candle forms. This would be enough evidence to warrant a short, targeting 0.99/daily support at 0.9896.
Data points to consider: FOMC member Harker speaks at 12.10am GMT.
Levels to watch/live orders:
- Buys: Flat (stop loss: N/A).
- Sells: 1.0000 region ([waiting for a reasonably sized H4 bearish candle to form – preferably a full or near-full-bodied candle – is advised] stop loss: ideally beyond the candle’s wick).
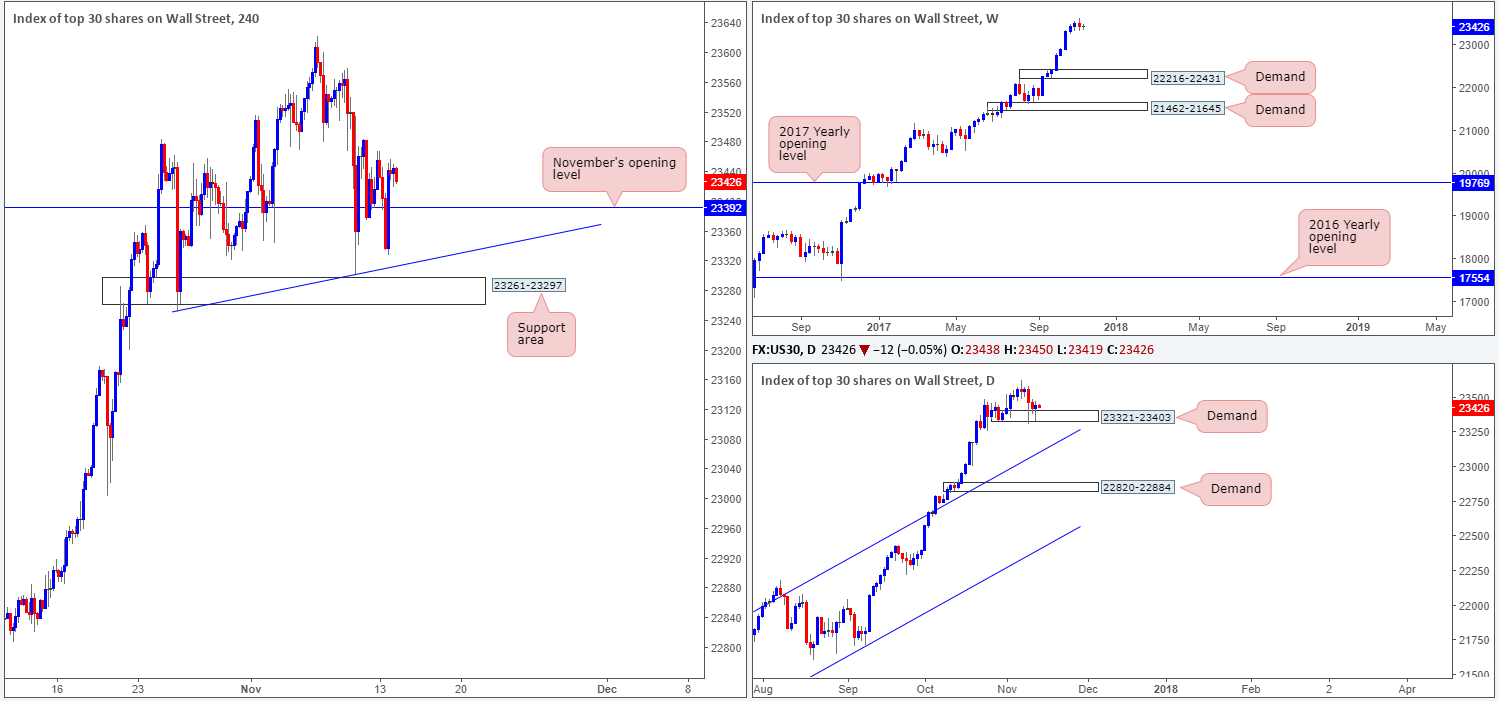
DOW 30:
Weekly gain/loss: -0.50%
Weekly closing price: 23416
Although the index managed to print a fresh record high of 23622 last week, the unit failed to extend gains. Breaking an eight-week bullish phase, the concluding weekly candle chalked up a rather nice-looking bearish engulfing formation. Could this, considering the underlying trend right now, be sufficient enough to entice sellers into the market this week?
Before sellers are convinced that there is some oomph behind last week’s downturn, the daily demand at 23321-23403 will likely need to be consumed. This would, according to our technical drawings, clear the runway south down to at least the daily trendline support etched from the high 21541.
Apart from a brief selloff down to November’s opening level at 23392 on Friday, the H4 candles displayed little change, due to US banks being closed in observance of Veteran’s Day. For the weekly bearish engulfing candle to work, not only do H4 sellers need to overcome 23392, they also need to crack through a H4 trendline support taken from the low 23250 as well as a H4 support area at 23261-23297 (positioned beneath the aforementioned daily demand).
Suggestions: Buying this market after a weekly bearish engulfing candle is not something the team would stamp high probability. Likewise, we would not consider becoming sellers on the basis of this weekly candlestick formation until the noted H4 support area is taken out. To that end, we’ll likely be sidelined during today’s segment.
Data points to consider: FOMC member Harker speaks at 12.10am GMT.
Levels to watch/live orders:
- Buys: Flat (stop loss: N/A).
- Sells: Flat (stop loss: N/A).
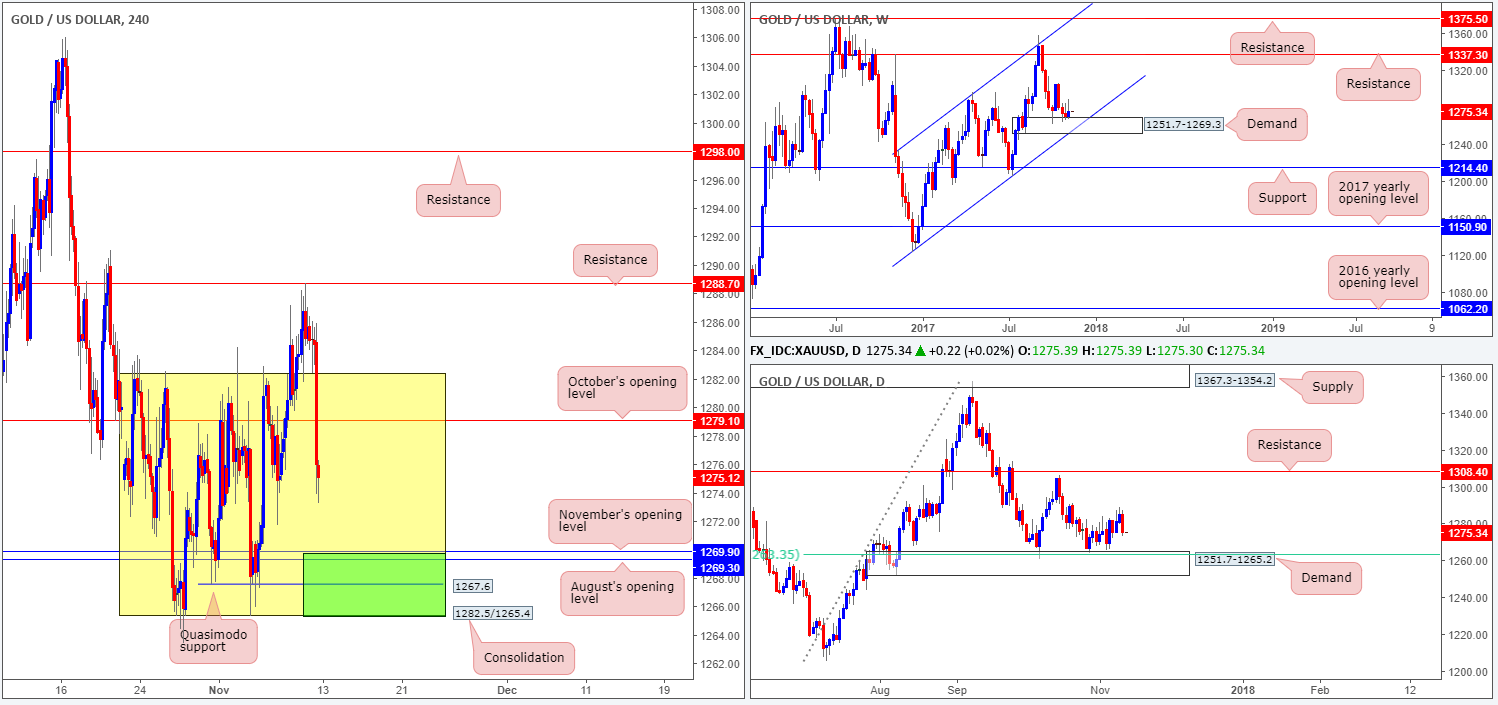
GOLD:
Weekly gain/loss: +0.46%
Weekly closing price: 1275.3
Over the course of last week’s segment, weekly bulls began making a stand around the top edge of a weekly demand area marked at 1251.7-1269.3. In fact, what also stands out from last week’s movement is the weekly inverted pin-bar candle, or sometimes referred to as an ‘inverted hammer’. Candlestick traders consider this formation to be a trade signal, especially when it forms around an area of interest.
Supporting the aforementioned weekly demand is a daily demand (housed within the lower limits of the weekly zone) at 1251.7-1265.2. Also of interest on the daily timeframe is the 61.8% Fib support at 1263.2 taken from the low 1205.0, seen plotted within the walls of the noted daily demand.
After shaking hands with a H4 resistance level at 1288.7 on Thursday, the week ended with the H4 candles driving back into the H4 consolidation zone fixed between 1282.5/1265.4. Additionally, we can see that the move cleared bids from October’s opening level at 1279.1 in the process.
Suggestions: The lower edge of the current H4 range at 1265.4, as well as the nearby H4 Quasimodo support at 1267.6 along with August and September’s opening levels seen just above at 1269.3/1269.9, as far as we can see, form a strong-looking buy zone (green zone). What’s more, let’s not forget that we have the weekly and daily demands mentioned above bolstering the underside of this green area!
To be on the safe side though, we would advise waiting for additional H4 candle confirmation, since there is a risk that the yellow metal may want to drive deeper into the current weekly demand to test the weekly channel support extended from the low 1122.8.
Levels to watch/live orders:
- Buys: 1265.4/1269.9 ([waiting for a reasonably sized H4 bullish candle to form – preferably a full or near-full-bodied candle – is advised] stop loss: ideally beyond the candle’s tail).
- Sells: Flat (stop loss: N/A).


