
EUR/USD:
Outlook unchanged.
Weekly gain/loss: +0.28%
Weekly close: 1.1232
Weekly perspective:
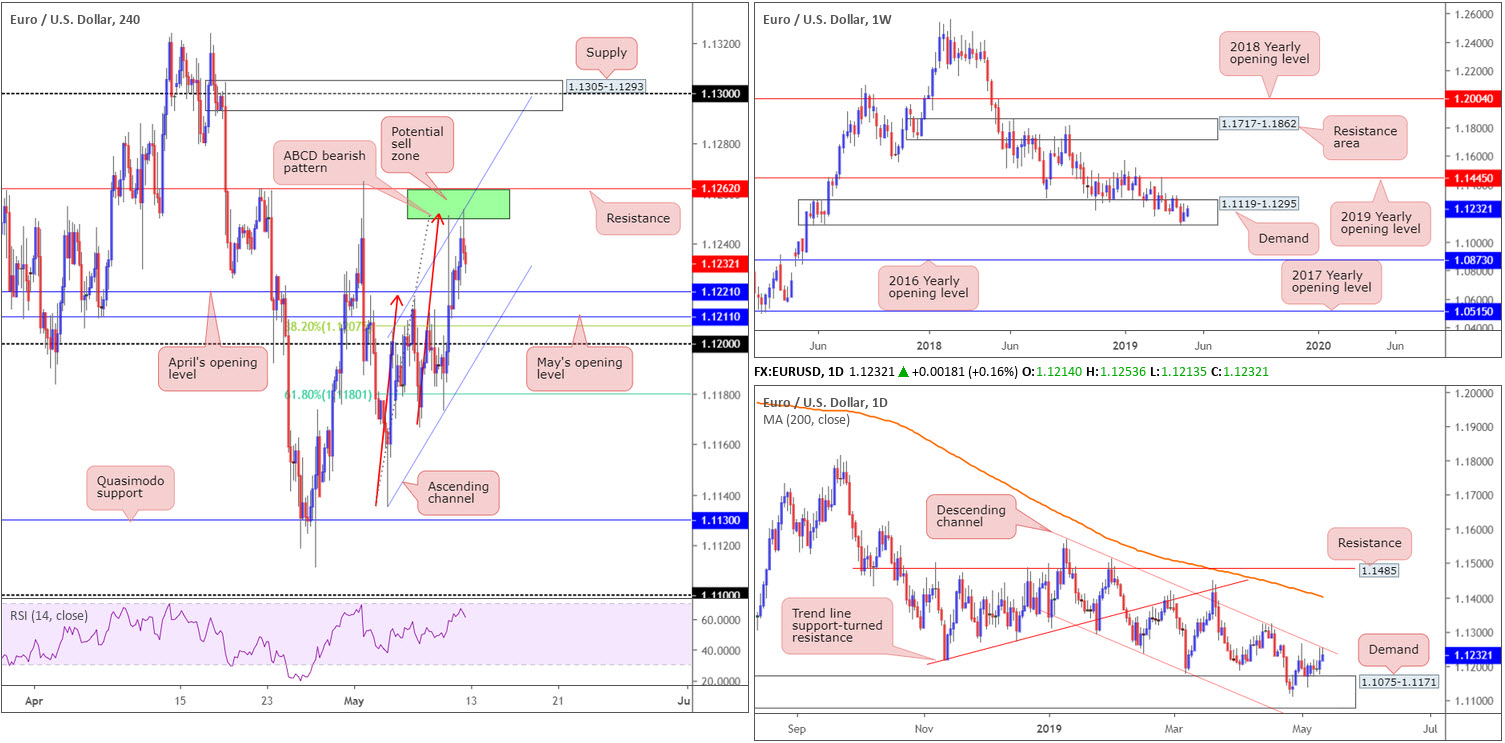
The EUR/USD enjoyed another successful week, recording its second consecutive weekly gain. As evident from the chart, price action remains warring for position within the parapets of a long-standing demand zone at 1.1119-1.1295, though do remain aware the long-term trend still firmly faces a southerly position. Continued buying out of these walls may call for a test of notable resistance plotted at 1.1445 (the 2019 yearly opening level) whereas a break lower has the 2016 yearly opening level at 1.0873 in sight.
Daily perspective:
The main concentration on the daily timeframe is channel resistance taken from the high 1.1569 and demand at 1.1075-1.1171 (fixed to the underside of the current weekly demand area). A move higher this week has the 1.1324 April 12 high to target, trailed closely by the 200-day SMA (orange). A rotation lower, however, could eventually challenge a particularly interesting area of demand coming in at 1.0860-1.0954 (not visible on the screen).
H4 perspective:
The Consumer Price Index for All Urban Consumers (CPI-U) increased 0.3% in April on a seasonally adjusted basis after rising 0.4% in March, the US Bureau of Labour Statistics reported Friday. In response, the US dollar, according to the US dollar index, fell sharply and consequently propelled the EUR/USD towards an area of resistance (green) at 1.1262/1.1251 (comprised of a resistance level at 1.1262, an ABCD measured move [red arrows] at 1.1251 and a channel resistance drawn from the high 1.1218).
Although weekly price remains sparring for position within demand at 1.1119-1.1295, the research team notes 1.1262/1.1251 boasts additional support by way of a daily channel resistance taken from the high 1.1569.
For folks who read previous reports you may recall the said H4 zone being listed as an area worthy of shorts. Traders who initially shorted this zone Thursday have likely been taken for breakeven, as price had yet to test the 38.2% Fibonacci support value (of legs A-D) at 1.1207 – considered the initial take-profit target – before returning to the area.
Areas of consideration:
With the H4 candles revisiting 1.1262/1.1251 for a second time Friday, and holding firm into the close, further selling from this point could be in store today/early week.
Traders who shorted Friday’s rebound have the 38.2% Fibonacci support value (of legs A-D) at 1.1207 to target, followed by the 61.8% Fibonacci support value at 1.1180. Structurally, nonetheless, traders are also urged to note possible support emerging from April’s opening level at 1.1221, May’s opening level at 1.1211, the round number 1.12 and also the top edge of daily demand at 1.1075-1.1171.
Today’s data points: Limited.
GBP/USD:
Outlook unchanged.
Weekly gain/loss: -1.30%
Weekly close: 1.3000
Weekly perspective:
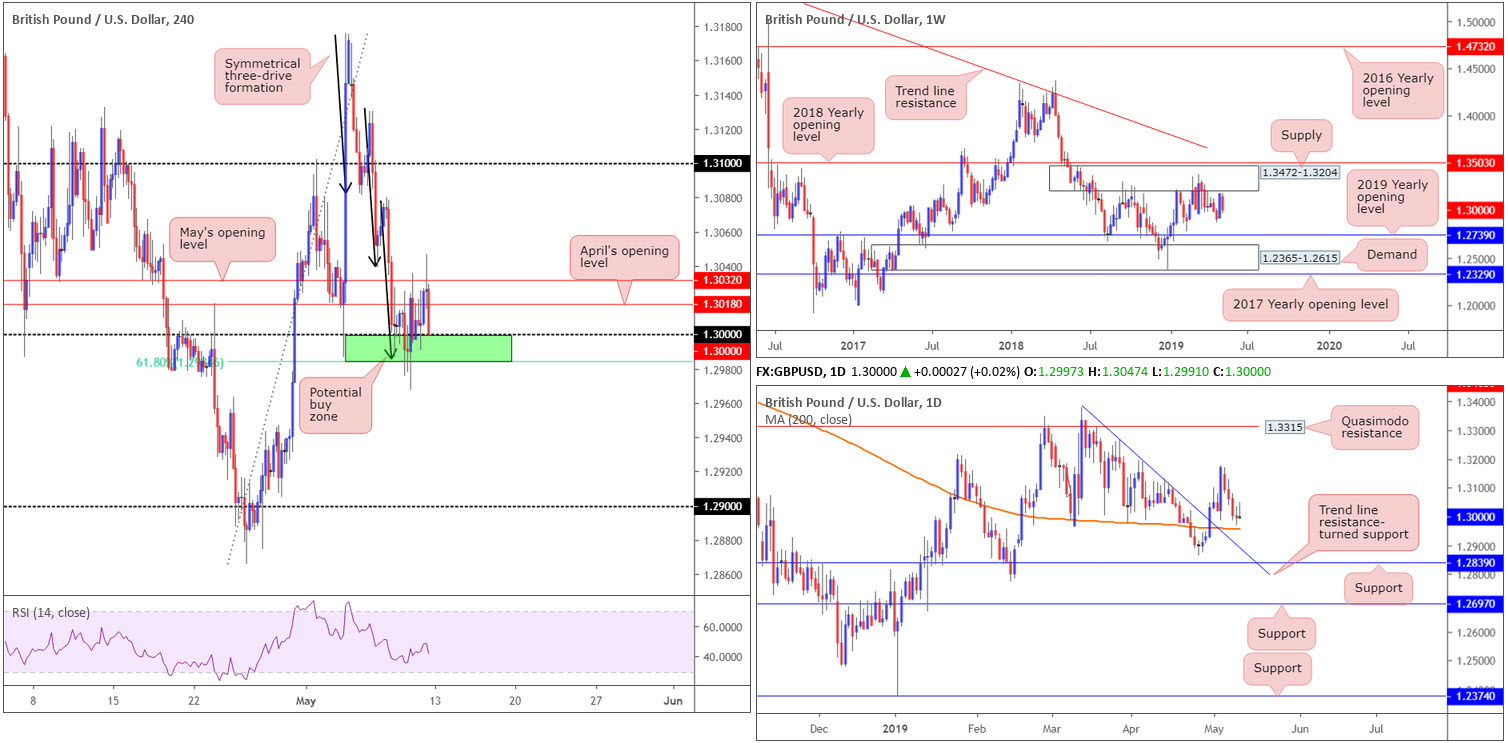
Leaving the underside of supply at 1.3472-1.3204 unchallenged, situated a few points south of the 2018 yearly opening level at 1.3503, the British pound came under pressure last week and sank more than 170 points.
Having observed the said supply zone hold price action lower on a number of occasions in the past, the recent pullback is unsurprising. Follow-through selling from this point could attempt an approach towards the 2019 yearly opening level at 1.2739, shadowed closely by a demand area at 1.2365-1.2615.
Daily perspective:
Closer analysis of price action on the daily timeframe shows the unit suspended just north of the 200-day SMA (orange), currently circulating around the 1.2954 region. Traders may also wish to acknowledge the merging trend line resistance-turned support (extended from the high 1.3380) and support level at 1.2839, in the event we overthrow the SMA this week.
H4 perspective:
A brief recap of price action on the H4 timeframe Friday shows the piece largely advanced amid London hours, mildly boosted by softer-than-expected US inflation numbers. This – coupled with Brexit uncertainty plaguing the market – weighed on price during US trade, pulling the H4 candles to 1.30 by the closing bell.
As highlighted in previous analysis, 1.30, by and of itself, is a widely watched figure, though you’ll notice it also draws in additional H4 support by way of (green) a nearby 61.8% Fibonacci support value at 1.2985 and a symmetrical three-drive bullish pattern (black arrows) that terminates around 1.2988. Despite a whipsaw to lows of 1.2967 and price failing to defeat May and April’s opening levels at 1.3032 and 1.3018, respectively, this area remains intact heading into a fresh week.
Areas of consideration:
Despite weekly flow screening signs of further selling and daily action poised to challenge its 200-day SMA, the H4 green zone pictured between 1.2985/1.3000 remains an area of interest for longs. Before pressing the buy button, traders may wish to hold fire and wait for a decisive H4 close above May’s opening level at 1.3032 to form. Entry can then be taken on the breakout candle’s close with a stop-loss order placed accordingly. This potentially clears the pathway as far north as the 1.31 neighbourhood on the H4 timeframe.
Today’s data points: Limited.
AUD/USD:
Weekly gain/loss: -0.31%
Weekly close: 0.6998
Weekly perspective:
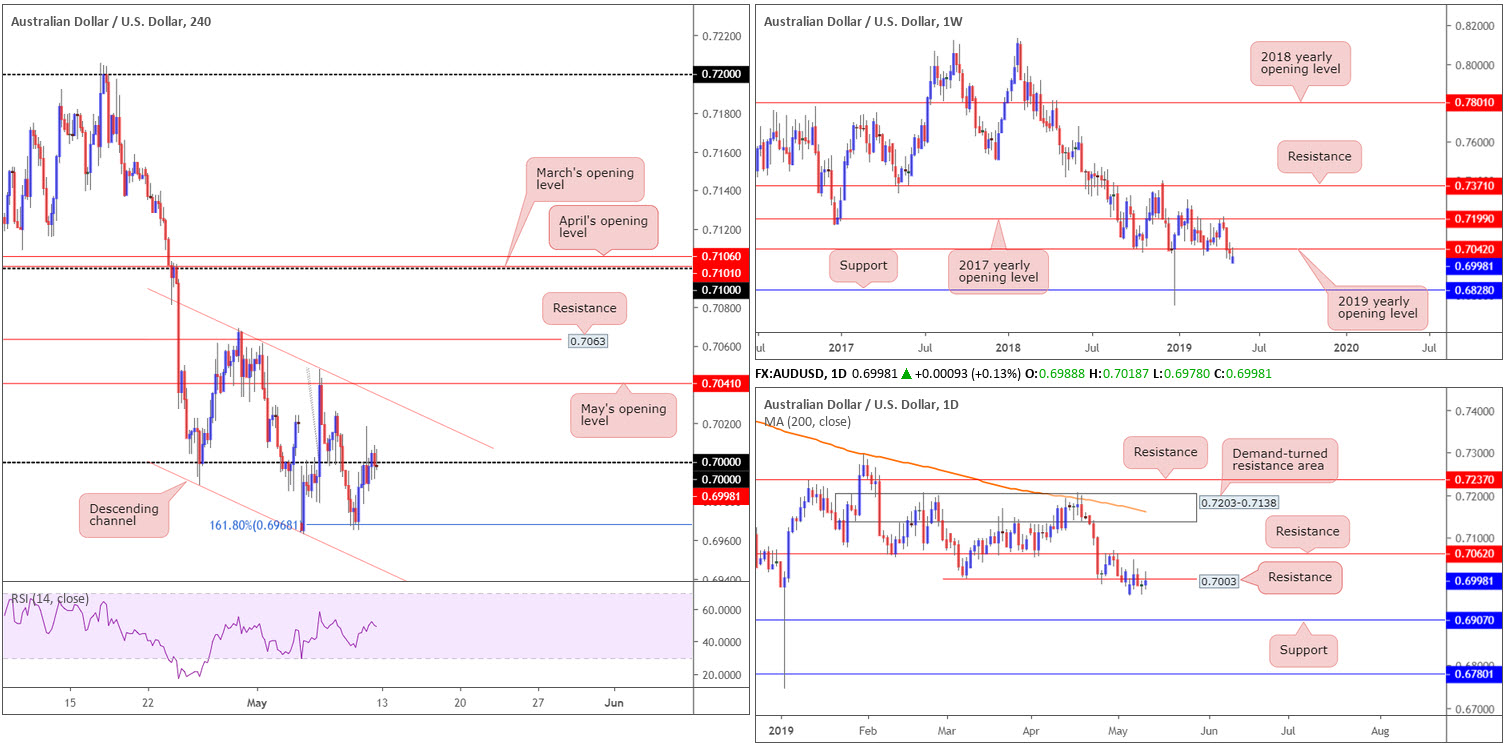
The Australian dollar weakened further against the US dollar over the course of last week, extending losses beneath the 2019 yearly opening level at 0.7042. Subject to sellers remaining in the driving seat below 0.7042, the pair is, according to our technical studies, starved of support until shaking hands with 0.6828.
Daily perspective:
Resistance coming in at 0.7003 on the daily timeframe remains in focus, with the possibility of further selling materialising in the direction of support pencilled in at 0.6907. Note 0.7003 is likely strengthened given weekly sellers are also possibly in the mix from 0.7042 (see above). Although it’d be a surprise to see buyers gain traction from here, traders are still urged to take note of resistance at 0.7062 on this timeframe.
H4 perspective:
Following a somewhat active Asian segment Friday, H4 price eased into a quiet phase around the 0.70 key figure for the remainder of the day. Early Asia witnessed the Reserve Bank of Australia stand pat on rates and reiterated trade tensions were a significant downside risk to the global outlook. Data dependency was the main takeaway.
Bolstered by an additional layer of resistance from 0.7003 on the daily timeframe, as well as pressure from weekly resistance overhead at 0.7042, the 0.70 handle on the H4 timeframe is likely to remain a resistance this week.
Areas of consideration:
On account of the technical reading, traders might wish to consider selling the underside of 0.70. A decisive H4 close formed beneath 0.70 that’s followed up with a retest in the shape of a H4 bearish candlestick formation (entry and risk can be adjusted according to this pattern’s structure) would be considered a high-probability setup, targeting the 161.8% Fibonacci ext. point at 0.6968 as an initial take-profit zone, and potentially reaching as far south as 0.69ish.
Today’s data points: Limited.
USD/JPY:
Weekly gain/loss: -1.03%
Weekly close: 109.94
Weekly perspective:
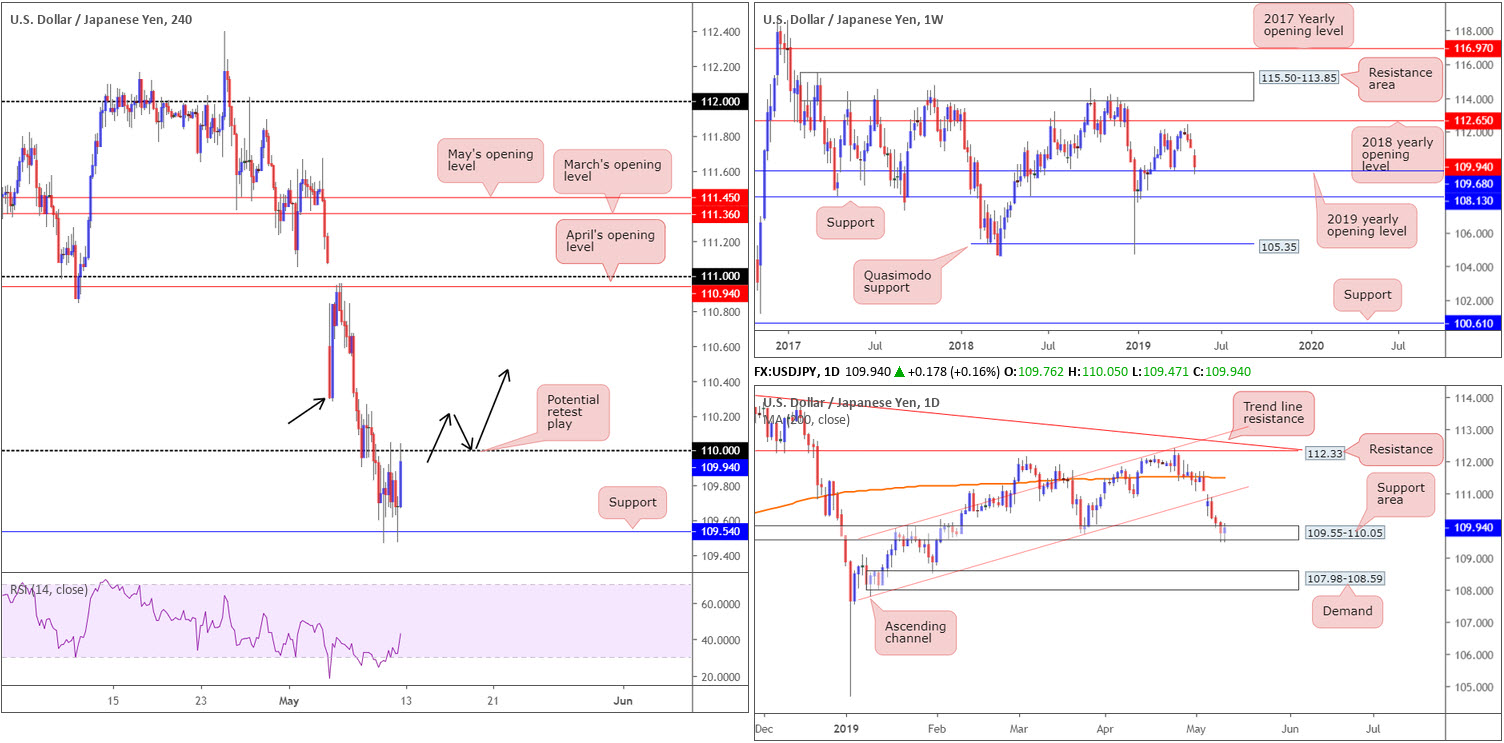
The US dollar sustained further losses against the Japanese yen in recent trading, shedding more than 100 points and drawing the market to its 2019 yearly opening level at 109.68: a potential support.
Yearly opening levels tend to offer high-probability support and resistance, therefore this may provide a durable podium in which to base longs from this week. Should momentum continue southbound, nonetheless, support coming in at 108.13 is eyed.
Daily perspective:
In union with weekly structure, the daily candles wrapped up the week crossing swords with a support area at 109.55-110.05. Provided the buyers maintain a defensive posture, the expectation on the daily timeframe is for an advance to the underside of channel support-turned resistance (taken from the low 107.77). Renewed selling, on the other hand, exhibits scope to drive as far south as demand coming in at 107.98-108.59.
H4 perspective:
The US dollar unlocked fresh ground vs. the Japanese yen into the closing stages of Friday, influenced by a last-minute advance in US equities. Follow-through buying is certainly a possibility this week, in light of where price action is located on the higher timeframes, potentially dethroning 110 to the upside.
The landscape beyond 110 is reasonably vast, with April’s opening level at 110.94 noted as the next obvious upside target, followed by 111. Although a decisive close above 110 would likely fuel buyers, traders may want to note potential resistance emerging nearby from 110.28: Monday’s low point (black arrow).
Areas of consideration:
In view of all three timeframes, the research team feels the pendulum is swinging in favour of the buyers at this time.
A H4 close formed above 110 is likely to be viewed as a strong bullish indicator, simply because of the higher-timeframe’s position. Following a H4 close higher, traders have the option of either buying the breakout candle (enter long at its close with a protective stop-loss order based beneath its lower shadow), or conservatively wait and see if a retest occurs (again entry can be found at the close of the rejecting candlestick with a protective stop-loss order fixed beneath the lower shadow).
Today’s data points: Limited.
USD/CAD:
Weekly gain/loss: -0.05%
Weekly close: 1.3413
Weekly perspective:
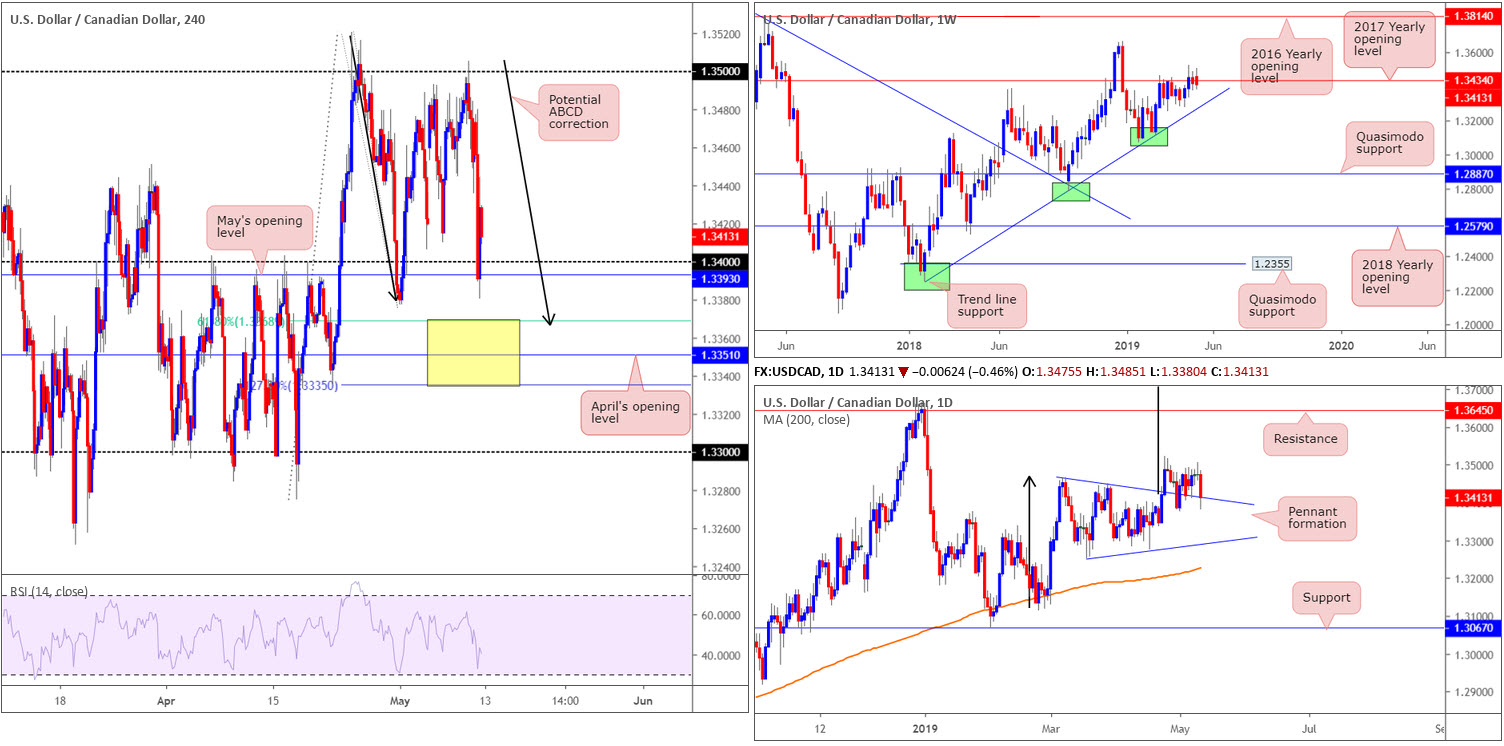
Although longer-term flows broke out to the upside of the 2017 yearly opening level at 1.3434, so far price action has failed to generate much follow-through momentum. In fact, last week’s movement ended by way of another inside candle (bearish) that closed marginally below 1.3434. This could signal further selling in this market, targeting trend line support taken from the low 1.2247. In the event the current candlestick signal fails and we push higher, a move in the direction of the 2018 yearly high of 1.3664 is a possibility.
Daily perspective:
A closer reading of price action shows the daily candles continue to feed off support drawn from the top edge of a pennant pattern (1.3467). Although the traditional price target (calculated by taking the distance from the beginning of the preceding move and adding it to the breakout price) remains on the chart at 1.3768 (black arrows), the next upside target from a structural standpoint falls in around resistance at 1.3645.
H4 perspective:
A combination of a mildly weaker-than-forecast US inflation reading (supporting the Federal Reserve’s projection of no further interest rates increases this year) and an upbeat job’s report out of Canada, directed the USD/CAD southbound. Losing more than 0.50% in the space of 30 minutes, the H4 candles challenged waters beneath the 1.34 handle and May’s opening level at 1.3393, likely tripping a truckload of stop-loss orders, both from traders attempting to fade the psychological mark and those trying to short the breakout.
Although the day ended above 1.34, which, as you can see, unites with the top edge of the daily pennant formation, another layer of support worth noting is between (yellow) at 1.3335/1.3368. Comprised of April’s opening level at 1.3351 as the centre line, a 61.8% Fibonacci support value at 1.3368 and a potential ABCD (black arrows) 127.2% Fibonacci ext. point at 1.3335, this zone offers reasonably robust local confluence.
Areas of consideration:
On account of our technical studies, 1.34 and May’s opening level; at 1.3393 is a barrier of support to watch today/early week, given its close connection with the top edge of the daily pennant pattern.
The yellow H4 zone highlighted above at 1.3335/1.3368 is also likely to offer a bounce, in view of its H4 confluence.
Irrespective of which movement takes shape, traders may want to consider waiting and seeing if the H4 candles chalk up a bullish candlestick signal (entry and risk can then be determined according to the pattern’s rules) before pulling the trigger. This is due to round numbers (1.34) being prone to fakeouts (stop runs), and the lower yellow zone mentioned above at 1.3335/1.3368 boasting limited higher-timeframe confluence.
Today’s data points: Limited.
USD/CHF:
Weekly gain/loss: -0.47%
Weekly close: 1.0116
Weekly perspective:
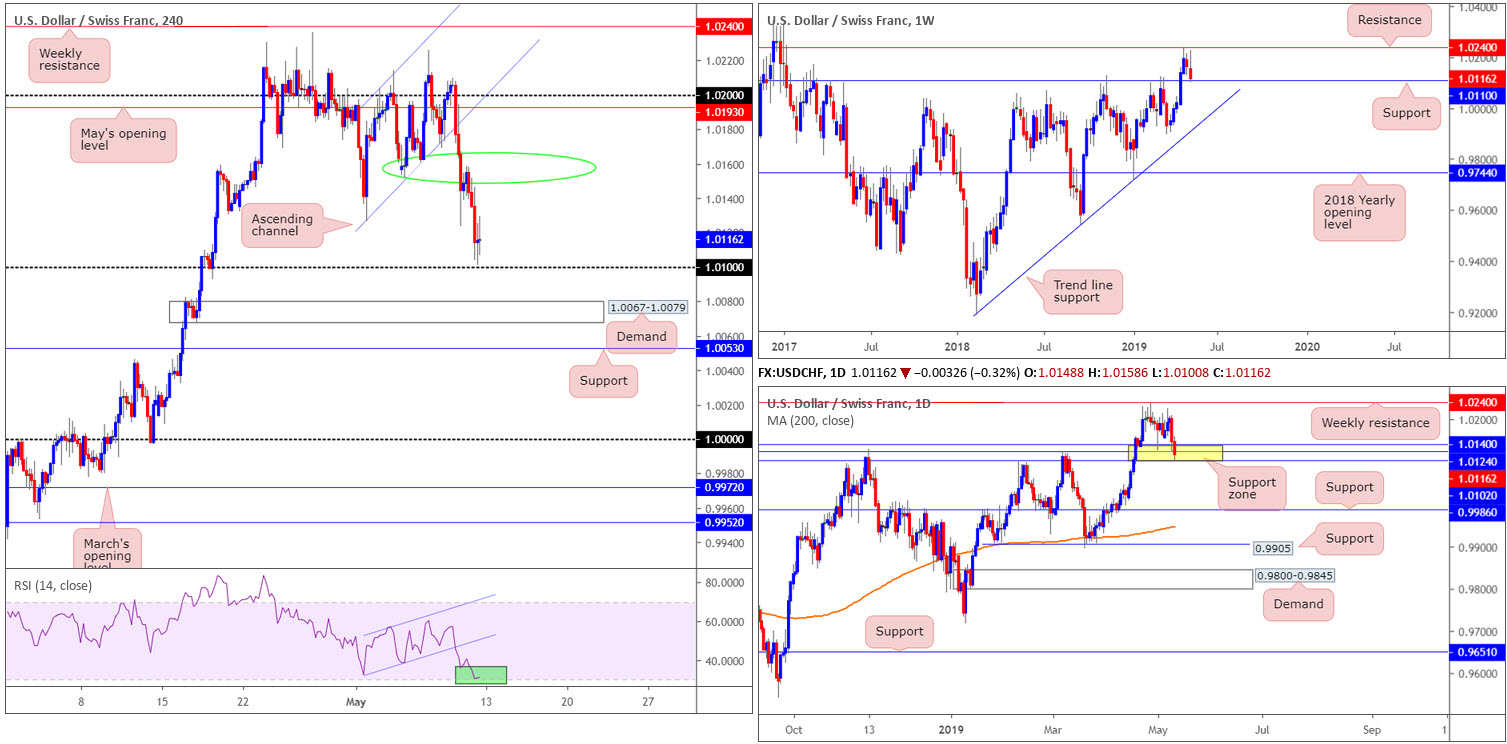
The buck’s retreat from the 2019 high 1.0236 set towards the end of May continued last week, consequently pencilling in a bearish engulfing candle (high/low range) and shaking hands with prominent support at 1.0110. For that reason, the order of the week may be to the upside, targeting resistance plotted at 1.0240. A failure of the aforementioned support, nonetheless, positions trend line support (etched from the low 0.9187) in the firing range.
Daily perspective:
In conjunction with our weekly reading, a support zone between 1.0102/1.0140 is in motion on the daily timeframe (yellow). Another important point worth adding is weekly support highlighted above at 1.0110 is seen housed within the walls of the said daily support area. A violation of the daily barrier, however, exhibits scope to press as far south as support coming in at 0.9986.
H4 perspective:
Demand for the safe-haven Swiss franc increased Friday, bulldozing the USD/CHF to its key figure 1.01, which, as you can see, held firm into the week’s close by way of two back-to-back Doji candles. A move higher from here has 1.0150 in sight (green circle), followed by May’s opening level at 1.0193, whereas beneath 1.01 we see nearby demand plotted at 1.0067-1.0079. It might also interest some traders to note the RSI indicator is currently rebounding from its oversold reading (green).
Areas of consideration:
While 1.01 is an incredibly attractive support on the H4 timeframe, there’s always a threat of a fakeout taking shape, particularly when fresh H4 demand resides close by at 1.0067-1.0079.
Although 1.01 houses strong higher-timeframe confluence, consider waiting for additional confirmation before pressing the buy button (entry and risk parameters can be determined according to the confirmation technique selected). This helps avoid falling victim to a whipsaw and provides entry and risk levels to work with.
Today’s data points: Limited.
Dow Jones Industrial Average:
Weekly gain/loss: -2.07%
Weekly close: 25942
Weekly perspective:
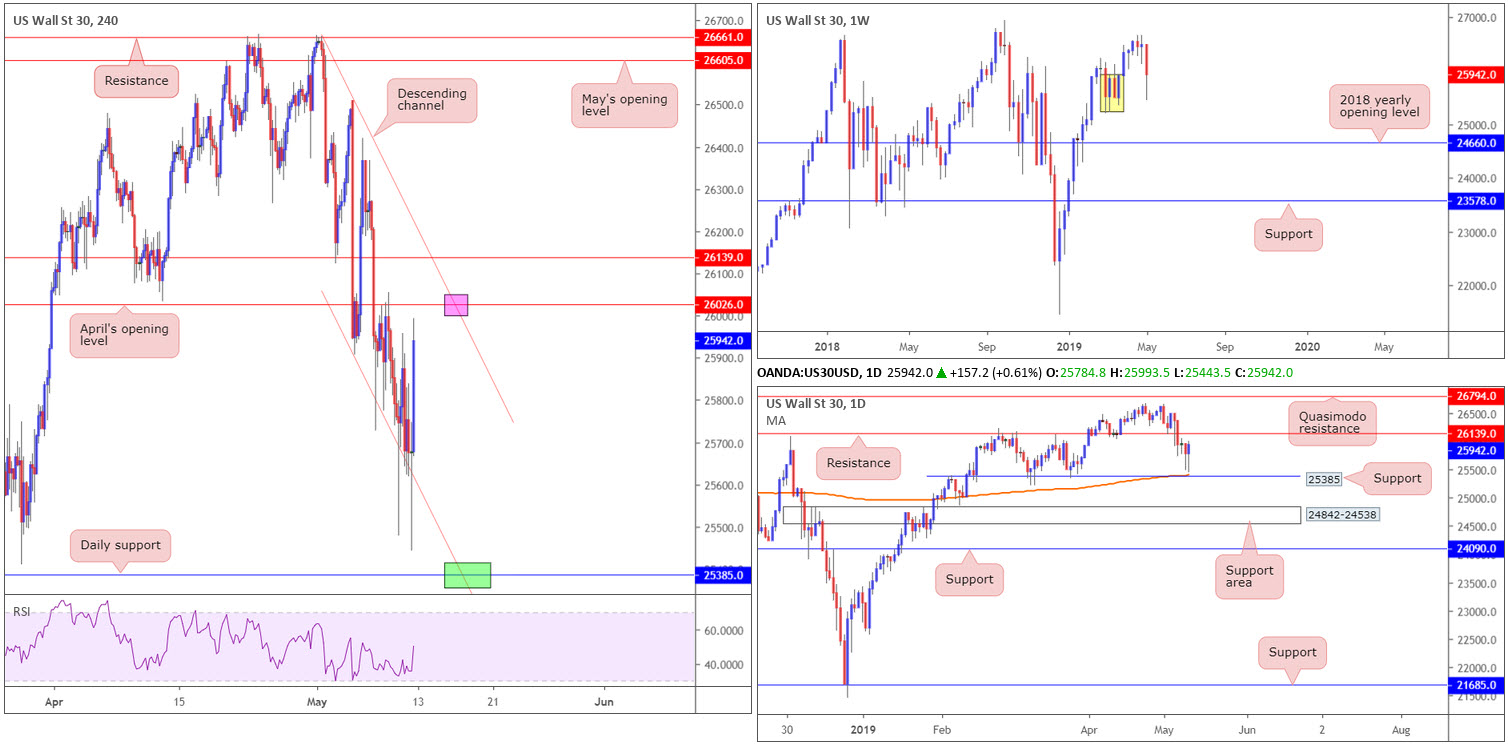
US equities went back to playing on the defensive over the course of last week, plummeting more than 500 points. Demand marked in yellow at 25217-25927 also elbowed its way into the spotlight, though is not considered an area of note on this timeframe owing to limited momentum produced from the base.
Beyond the current demand, the 2018 yearly opening level at 24660 is in view.
Daily perspective:
In the shape of two back-to-back hammer candlestick formations, price action is seen establishing ground ahead of clear-cut support at 25385, which happens to currently align with the 200-day SMA (orange). For folks considering entering long based off of the closing candlestick patterns should proceed with caution, as resistance at 26139 is plotted nearby.
H4 perspective:
US equities clawed back from early losses and moved higher Friday after Treasury Secretary Steven Mnuchin cast a positive light on trade talks with the Chinese delegation in Washington.
Leaving daily support mentioned above at 25385 unopposed, the Dow Jones Industrial Average turned higher and wrapped up the week within a descending channel formation (26659/25907), facing possible resistance at 26026: April’s opening level.
Areas of consideration:
The point daily support at 25385 (along with the 200-day SMA) and the H4 channel support join (green) is of interest this week for potential long opportunities. Note the level is also contained within the walls of the current weekly demand.
Another point of interest this week is the pink zone on the H4 timeframe: April’s opening level at 26026 and the merging H4 channel resistance. Traders are also urged to pencil in daily resistance at 26139 as a barrier for stop-loss placement.
Today’s data points: Limited.
XAU/USD (GOLD):
Outlook unchanged.
Weekly gain/loss: +0.52%
Weekly close: 1285.6
Weekly perspective:
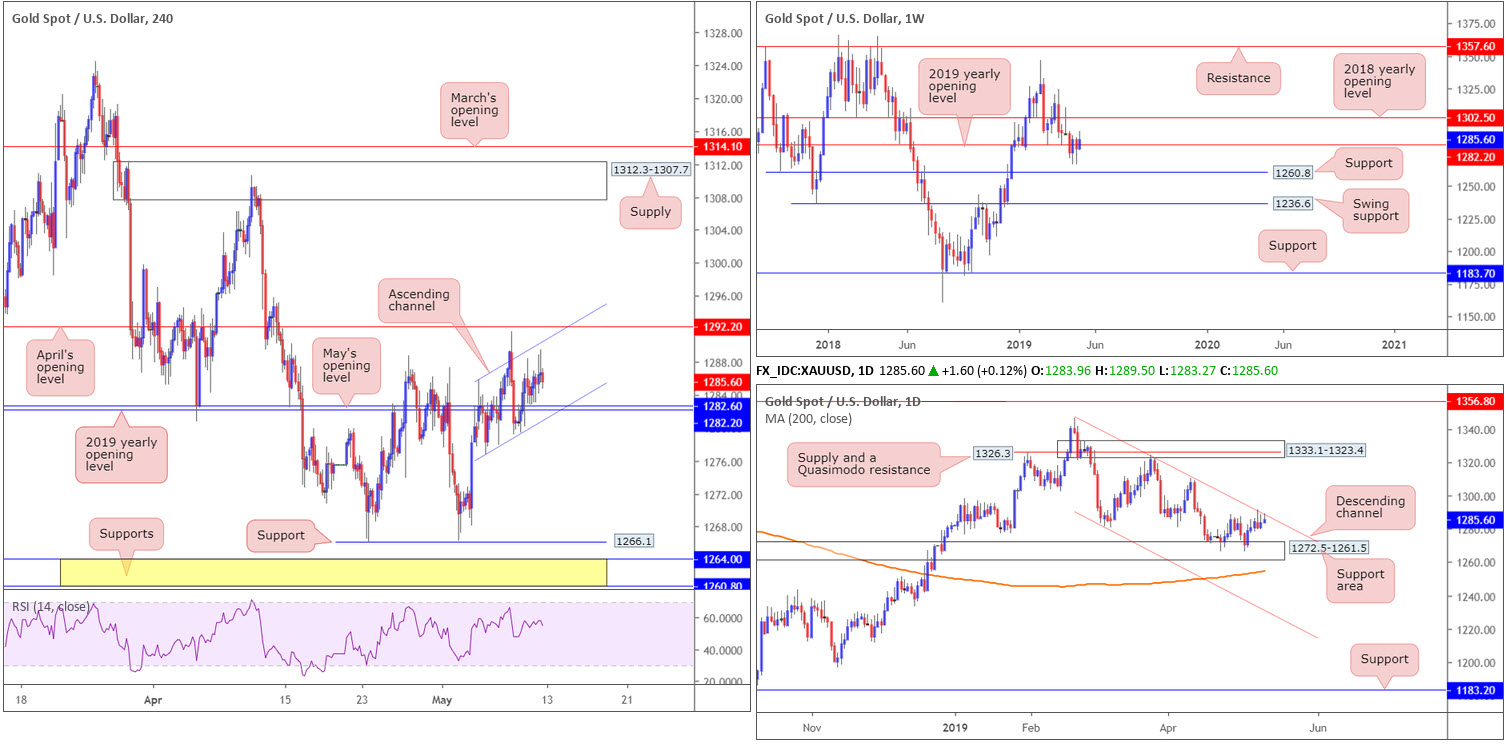
Since mid-April, the buyers and sellers have been warring for position near its 2019 yearly opening level at 1282.2. Further selling from this point has support coming in at 1260.8 to target, whereas a move above 1282.2 may call for an advance in the direction of the 2018 yearly opening level at 1302.5.
Daily perspective:
Daily flow, on the other hand, is testing channel resistance taken from the high 1346.7, with a nearby support area plotted at 1272.5-1261.5 positioned as the next downside target. Continued buying has the 1310.6 April 10 high to contend with, followed by a supply zone at 1333.1-1323.4. Another thing to keep in mind on this timeframe is the 200-day SMA hovering beneath the current support area at around 1254.8.
H4 perspective:
The price of gold, in $ terms, remained relatively quiet Friday, as US/China trade concerns continues to drive market action.
Bullion modestly advanced Friday, consequently retaining a marginal position above its 2019 yearly opening level at 1282.2, and also May’s opening level at 1282.6. The next upside target to be aware of on the H4 timeframe falls in around April’s opening level at 1292.2. Beyond here, traders’ crosshairs likely fall on supply drawn from 1312.3-1307.7. Below 1282.2, however, support is visible at 1266.1, followed by two more layers of support at 1260.8/1264.0 (yellow).
Areas of consideration:
Traders may have noticed the H4 candles have been compressing within an ascending channel since the beginning of last week (1276.7/1285.8). This formation can be used to confirm potential direction. A break beneath the channel signals the sellers have the upper hand on the daily timeframe and could push lower. However, do remain cognizant of the nearby daily support area which could hamper selling. A break of the H4 channel to the upside, and preferably April’s opening level, suggests further buying could be in store.
In regards to specific entry techniques, traders could simply look to trade a break/retest play once a direction is in view, targeting H4 supply at 1312.3-1307.7 for longs and the top edge of the daily support area at 1272.5 for shorts.
The accuracy, completeness and timeliness of the information contained on this site cannot be guaranteed. IC Markets does not warranty, guarantee or make any representations, or assume any liability with regard to financial results based on the use of the information in the site.
News, views, opinions, recommendations and other information obtained from sources outside of www.icmarkets.com.au, used in this site are believed to be reliable, but we cannot guarantee their accuracy or completeness. All such information is subject to change at any time without notice. IC Markets assumes no responsibility for the content of any linked site. The fact that such links may exist does not indicate approval or endorsement of any material contained on any linked site.
IC Markets is not liable for any harm caused by the transmission, through accessing the services or information on this site, of a computer virus, or other computer code or programming device that might be used to access, delete, damage, disable, disrupt or otherwise impede in any manner, the operation of the site or of any user’s software, hardware, data or property.


