
Key risk events today:
Japanese banks will be closed in observance of Coming-of-Age Day; China New Loans; UK GDP m/m; UK Manufacturing Production m/m; BoC Business Outlook Survey.
EUR/USD:
Weekly gain/loss: -0.38%
Weekly close: 1.1117
Weekly perspective:
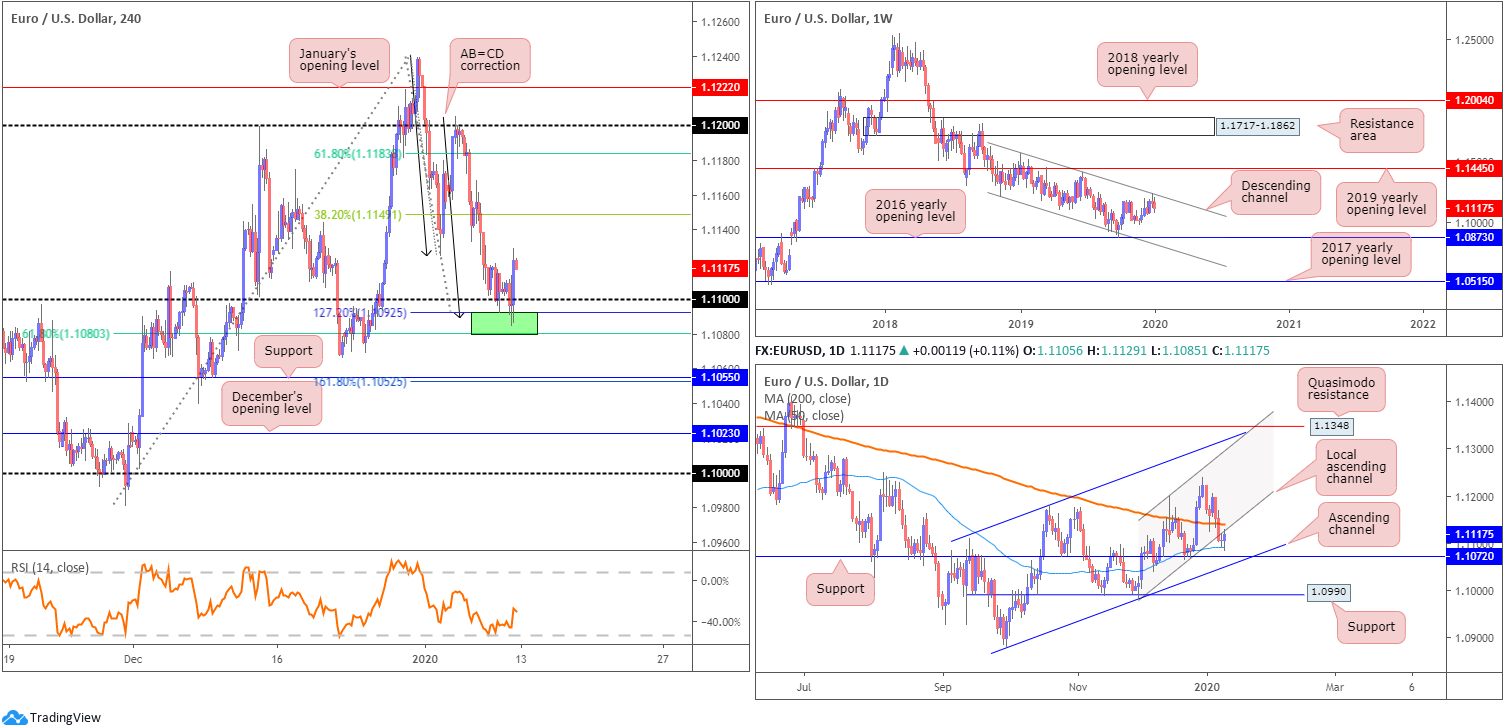
Technical research has weekly movement extending losses south of long-standing channel resistance, drawn from the high 1.1569. Visible downside objectives on this timeframe fall in at the 2016 yearly opening level at 1.0873 and channel support, taken from the low 1.1109. To the upside, assuming a break of the said channel resistance, price has the 2019 yearly opening level at 1.1445 to target.
In terms of the primary trend, price has been trading lower since topping in early 2018, at 1.2555.
Daily perspective:
Wednesday, in the shape of a 47-point downward move, overthrew not only the 200-day SMA (orange – 1.1139) but also a local channel support, taken from the low 1.0981. The nearby 50-day SMA (blue – 1.1090) entered the fold Friday, providing support by way of a bullish engulfing candle over Thursday’s doji indecision formation.
Going into the new week, traders have additional channel support, extended from the low 1.0879 and, at a push, support seen at 1.0990.
H4 perspective:
Total non-farm payroll employment rose by 145,000 in December, and unemployment was unchanged at 3.5%. Notable job gains occurred in retail trade and health care, while mining lost jobs. Also in December, average hourly earnings for all employees on private nonfarm payrolls rose by 3 cents to $28.32. Over the last 12 months, average hourly earnings have increased by 2.9%, the US Bureau of Labour Statistics reported Friday.
Lower-than-consensus employment and average hourly earnings immediately directed the US dollar index, or DXY, to lows of 97.38. Losses were swiftly pared, however, reaching highs of 97.56 before turning south once more and exploring lower ground into the close.
Traders who read Friday’s report may recall the following piece:
As of current price, buyers and sellers are squaring off a touch below the 1.11 handle on the H4 timeframe. As a result, a portion of sell stops beneath this psychological barrier have likely been tripped. Interestingly, though, the area between 1.1080/1.1092 (green), a 61.8% H4 Fibonacci retracement and a 127.2% AB=CD bullish correction, is likely to hamper downside. This, particularly for shorter-term traders, is an appealing reversal zone, given the liquidity generated from the filled sell stops. In addition to this, the setup boasts RSI (relative strength index) confirmation in the form of an oversold signal (pink).
The combination of stop-taking beneath 1.11, the H4 AB=CD reversal zone at 1.1080/1.1092, RSI confirmation and the 50-day SMA is likely sufficient to tempt buyers into the market today, at least for an intraday bounce higher. A simple H4 bullish candlestick signal that closes back above 1.11 may serve as an entry trigger.
Traditional AB=CD take-profit targets favour the 38.2%/61.8% Fibonacci retracements set from legs A-D, at 1.1149 and 1.1183. Traders, however, are urged to also pencil in the 1.1125 January 3rd low as possible resistance.
Areas of consideration:
Well done to any readers who managed to jump aboard longs north of 1.11. 1.1125 was hit in the closing stages of the week. This, along with weekly sellers pushing south from its descending channel and daily price retesting the underside of its broken channel support, could hamper upside and stop H4 price from reaching 1.1149/1.1183, though, of course, this is never guaranteed.
In the event we drive beneath 1.11 this week, daily support resides at 1.1072, closely trailed by H4 support at 1.1055/161.8% Fibonacci extension point at 1.1052. Therefore, even if we navigate lower ground there’s little room to manoeuvre regarding short positions, unless you drill down to the lower timeframes.
GBP/USD:
Weekly gain/loss: -0.10%
Weekly close: 1.3058
Weekly perspective:
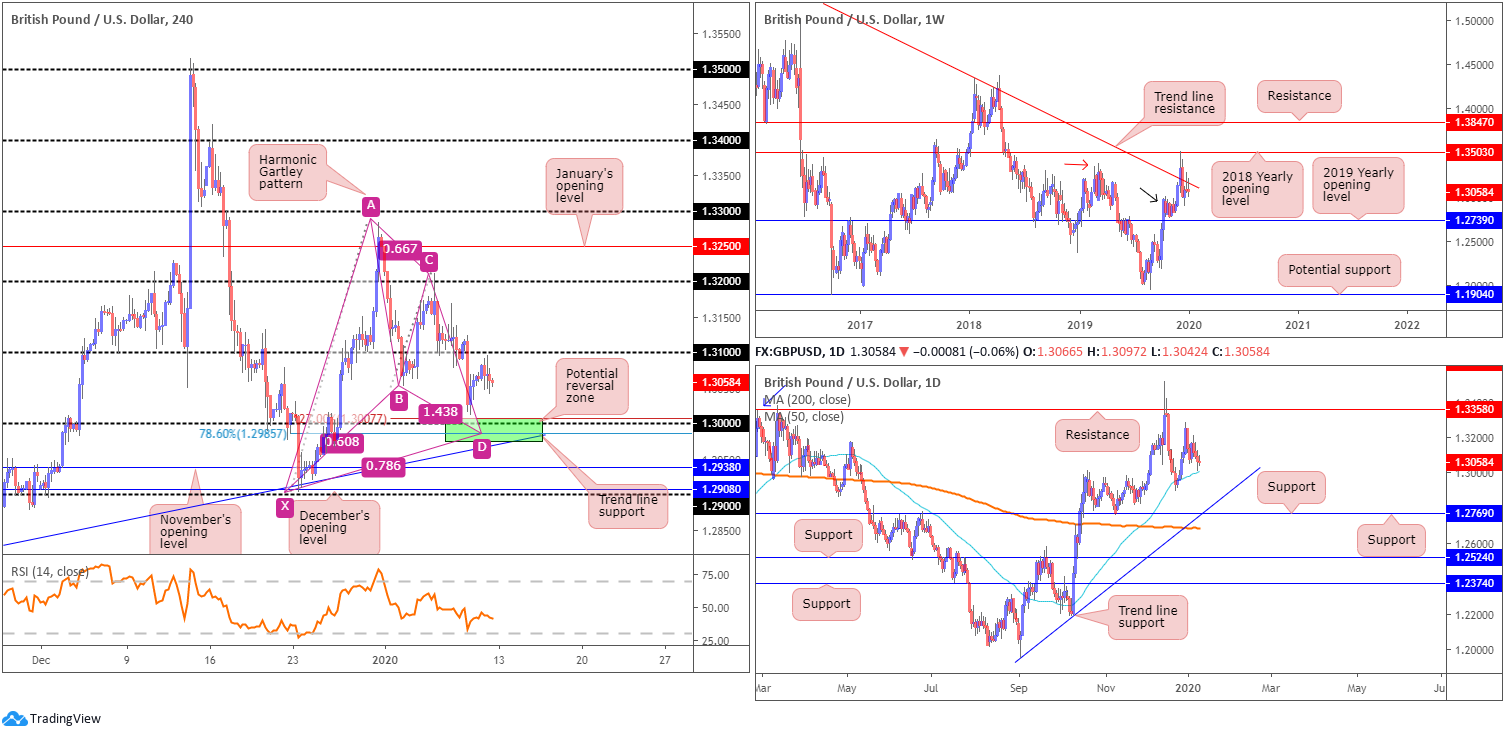
Sellers, by way of back-to-back shooting star bearish candlestick patterns, continued to strengthen their grip off long-standing trend line resistance last week, pencilled in from the high 1.5930. This follows a somewhat dominant whipsaw to the 2018 yearly opening level drawn from 1.3503 four weeks ago.
Buyers are attempting to defend nearby demand around the 1.2939 region (black arrow), seduced by the recent break of the notable high at 1.3380 (red arrow). The fact we’re holding the current trend line, though, implies we might see a push lower to the 2019 yearly opening level at 1.2739, consequently tripping sell stops from any traders long the aforementioned demand zone.
Daily perspective:
The 50-day SMA (blue – 1.3006) remains reasonably dominant support on the daily timeframe. Another layer of support that may eventually enter the fight, though, is 1.2769, which happens to merge closely with trend line support, pencilled in from the low 1.1958 and the 200-day SMA (orange – 1.2687). With respect to resistance, the only level of interest right now sits at the 1.3284 December 31st high and 1.3358, which capped upside since mid-June 2019.
H4 perspective:
Despite registering its fourth consecutive losing session Friday, GBP/USD entered a reasonably subdued state Friday, working south of the 1.31 handle.
As highlighted in Thursday’s technical briefing, the pair dethroned the 1.31 handle in strong fashion and bottomed a few points north of the key figure 1.30. Note (green) this level also forms together with a potential H4 harmonic Gartley pattern, boasting an AB=CD equivalent formation and a 78.6% XA retracement at 1.2985 as well as a 127.2% BC projection at 1.3007. Additionally, there’s H4 trend line support, extended from the low 1.2768.
Areas of consideration:
1.30 remains an obvious point of direction for many buyers in this market, considering its convergence with a H4 Gartley combination and trend line support, as well as the 50-day SMA aligning closely with the round number.
The Gartley pattern has an entry point around the 1.30ish region, preferably the 78.6% Fibonacci retracement at 1.2985, with stop-loss order placement set beneath the X point – the 1.29 handle. In terms of take-profit targets, traders generally favour the 38.2%/61.8% Fibonacci retracements of legs A-D – reduce risk to breakeven at 38.2% and take-profit at 61.8%. This, of course, can only be set once the pattern is complete, the 78.6% retracement and AB=CD equivalent has been hit.
AUD/USD:
Weekly gain/loss: -0.77%
Weekly close: 0.6899
Weekly perspective:
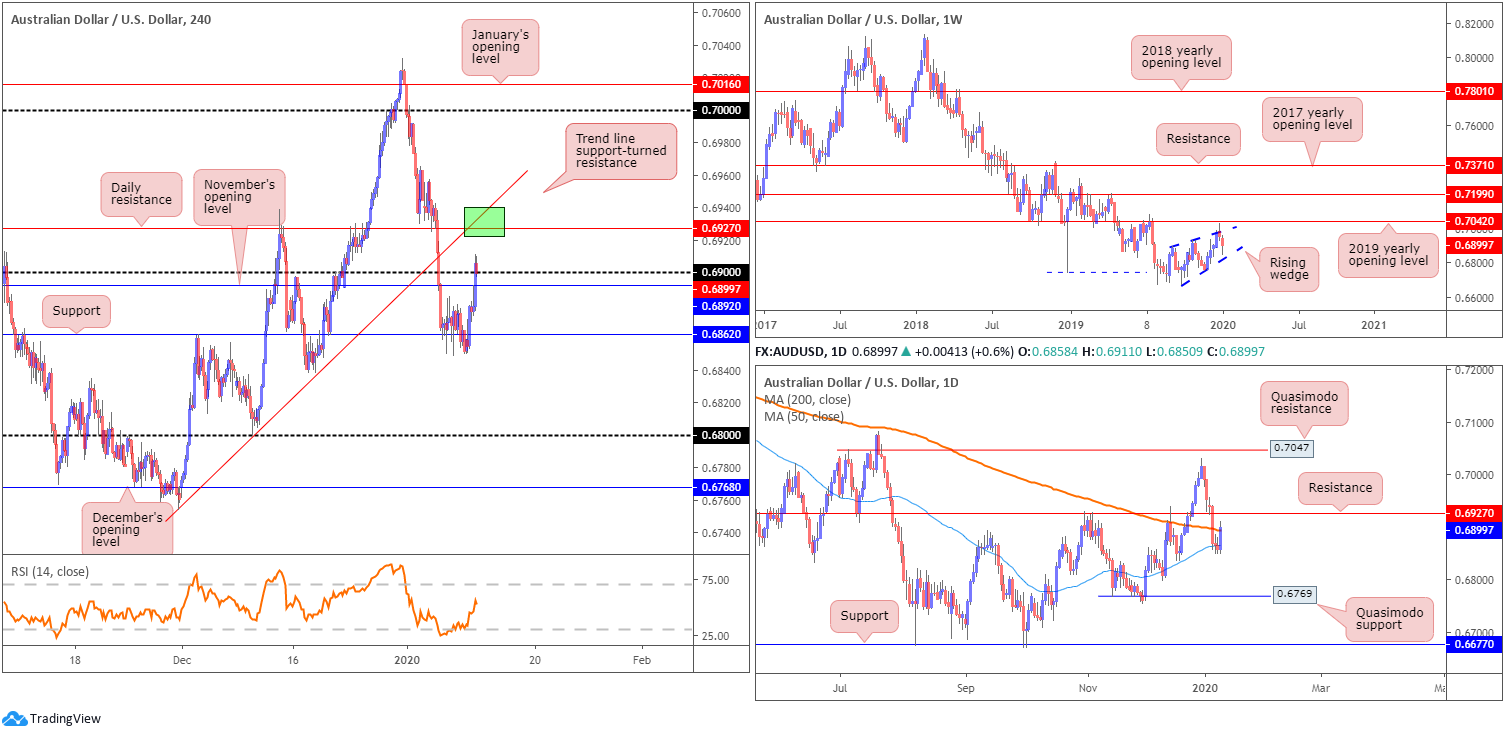
Since registering a bottom in late September at 0.6670, AUD/USD has been busy carving out what appears to be a rising wedge formation, typically considered a continuation pattern. Recent selling witnessed price decline back into the rising wedge, with a break lower possible given the primary downtrend in this market has faced a southerly bearing since early 2018.
Daily perspective:
Withstanding a number of downside attempts, the 50-day SMA (blue – 0.6864) remained supportive last week, driving price marginally through the 200-day SMA (orange – 0.6893). Resistance lies close by at 0.6927, with a break of this level exposing the 0.7031 December 31 high and Quasimodo resistance at 0.7047. Beyond the aforementioned 50-day SMA, however, active demand seems limited until reaching Quasimodo support coming in at 0.6769.
H4 perspective:
Early trade Friday prompted a wave of buying, reaching an intraday high of 0.6871. According to the Australian Bureau of Statistics, the seasonally adjusted estimate rose 0.9% in November 2019. This follows a rise of 0.1% in October 2019, and a rise of 0.2% in September 2019. Later in the session, AUD/USD continued higher, spiking to November’s opening level at 0.6892, following disappointing non-farm payrolls data. The session wrapped up around the 0.69 handle.
Daily resistance mentioned above at 0.6927, as can be seen from the H4 scale, also has trend line support-turned resistance positioned nearby, extended from the low 0.6754. Retaking November’s opening level from current price could lead to support at 0.6862 entering the fight this week.
Areas of consideration:
In a nutshell, chart studies suggest further selling on the weekly timeframe and potential selling off daily resistance at 0.6927. The daily level, alongside its closely connecting H4 trend line support-turned resistance is, therefore, likely an area sellers may be watching this week, targeting moves beyond the 0.69 handle.
Conservative traders may opt to wait for a H4 bearish candlestick signal to form prior to pulling the trigger; not only will this help identify seller intent, it’ll provide strict entry and risk levels to trade.
USD/JPY:
Weekly gain/loss: +1.22%
Weekly close: 109.44
Weekly perspective:
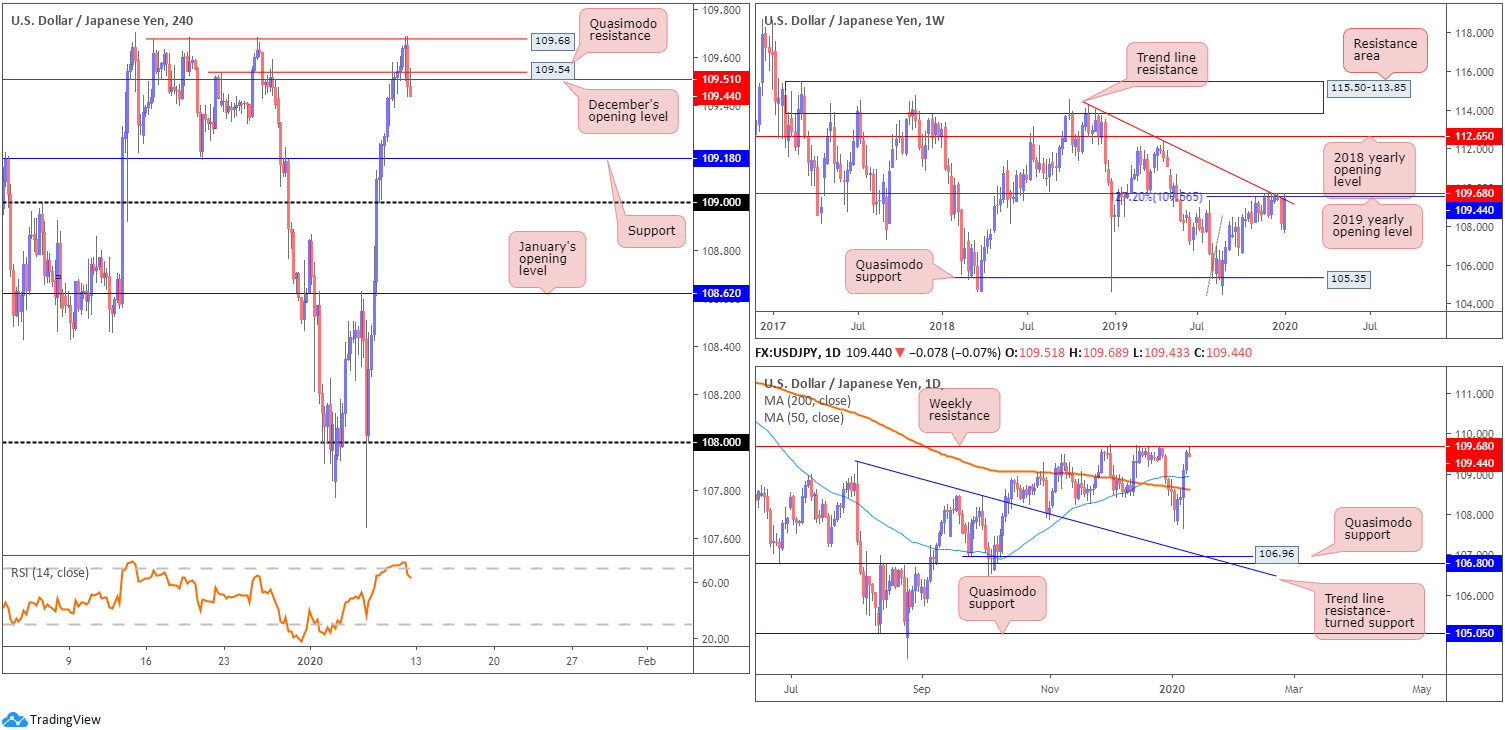
Renewed optimism stoked investor appetite last week, adding more than 130 points and paring the prior week’s losses. Technically, a collection of resistances are in motion, comprised of a 127.2% Fibonacci extension at 109.56 (taken from the low 104.44), the 2019 yearly opening level at 109.68 and trend line resistance, extended from the high 114.23.
A run above the said resistance could set the long-term stage for an approach to the 2018 yearly opening level at 112.65.
Daily perspective:
In conjunction with the weekly timeframe, resistance at 109.68 held Friday in the shape of a shooting star candlestick pattern, considered a bearish signal at peaks. In the event of a downturn occurring, the 200-day SMA (orange – 108.63) and the 50-day SMA (blue – 108.93) are in sight.
Note the 50-day SMA recently crossed above the 200-day SMA, signalling a possible bullish environment (sometimes referred to as a Golden Cross).
H4 perspective:
The impact of Friday’s downbeat non-farm payrolls data pressured USD/JPY lower, topping at familiar resistance (a triple-top pattern) around 109.68 (confirmed by an RSI overbought scenario) and reclaiming Quasimodo resistance at 109.54 and December’s opening level at 109.44.
Further downside today has support resting at 109.18 which boasts reasonably appealing history, with a break immediately highlighting the 109 handle.
Areas of consideration:
The collection of weekly resistances, along with a daily shooting star bearish candlestick formation, may entice sellers into the market today. With a protective stop-loss order tucked above Friday’s high at 109.69 (approximately 26 points), the first take-profit target can be seen at 109.18, offering the trader a 1:1 risk/reward ratio to work with.
USD/CAD:
Weekly gain/loss: +0.47%
Weekly close: 1.3049
Weekly perspective:
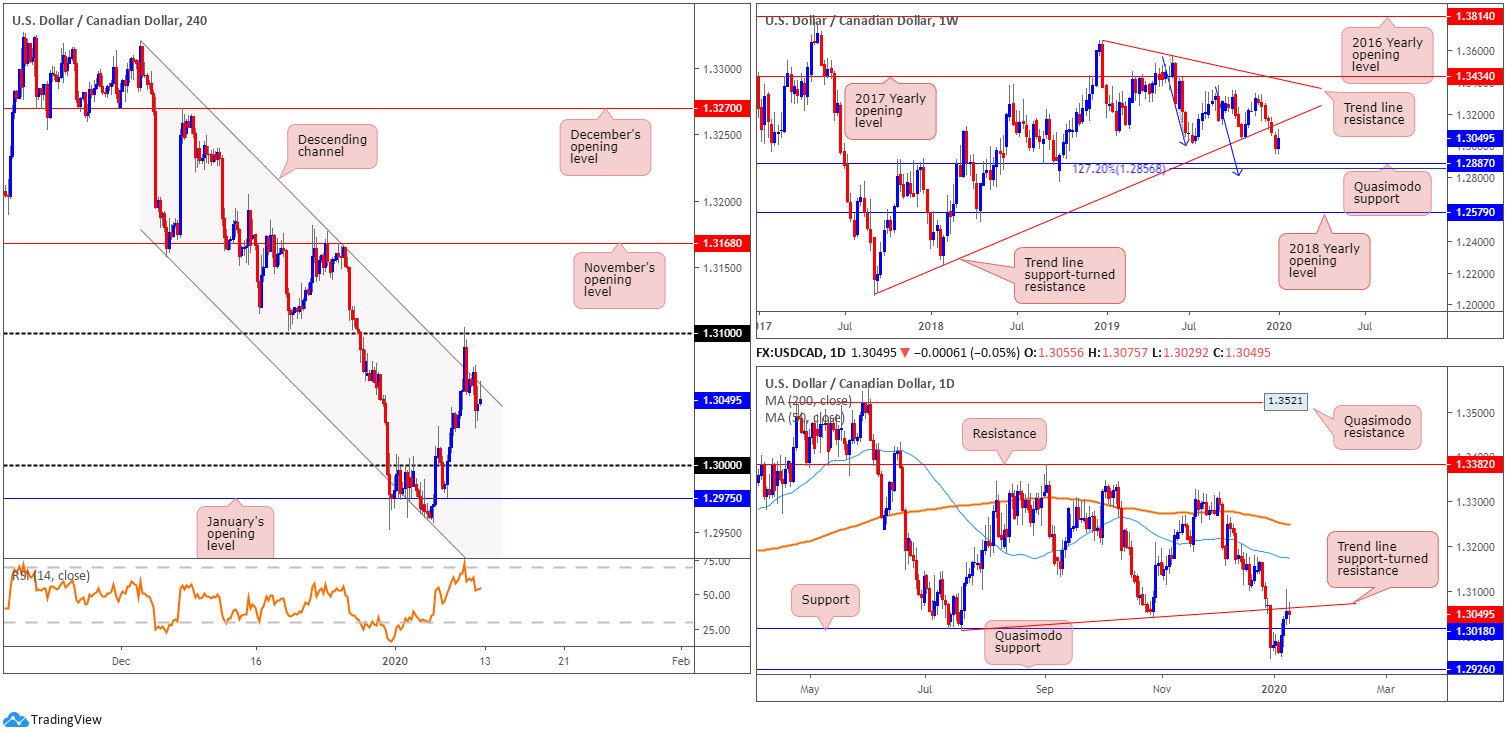
Despite the recent upturn, snapping a six-week long losing streak, USD/CAD continues to reflect a bearish position. After engulfing trend line support, taken from the low 1.2061, the pair exhibits scope to test Quasimodo support at 1.2887, positioned close by a 127.2% AB=CD bullish correction (blue arrows) at 1.2856. As such, 1.2856/1.2887 is likely a base active buyers reside.
The immediate trend has faced north since bottoming in September 2017; however, this move could also be considered a deep pullback in a larger downtrend from the 1.4689 peak in early January 2016.
Daily perspective:
Thursday had daily price form a reasonably strong selling wick off trend line support-turned resistance, taken from the low 1.3015. Friday remained south of the aforementioned trend line, though formed a doji indecision candle and snapped a three-day bullish phase.
Nearby support resides close by at 1.3018, with a break of this level exposing Quasimodo support at 1.2926.
H4 perspective:
- Employment increased by 35,000 (+0.2%) in December, and the unemployment rate fell 0.3 percentage points to 5.6%, according to a Statistics Canada report Friday. Both metrics reported stronger-than-expected figures.
- Total non-farm payroll employment rose by 145,000 in December (weaker than expected), and unemployment was unchanged at 3.5%, the US Bureau of Labour Statistics reported Friday. Also in December, average hourly earnings (weaker than expected) for all employees on private nonfarm payrolls rose by 3 cents to $28.32.
- Oil prices closed at 59.16, registering its third daily loss.
In the shape of two near-full-bodied candles, Thursday whipsawed through channel resistance, extended from the high 1.3320, and shook hands with the 1.31 handle. This – coupled with the H4 closing candle printing a shooting star pattern at the underside of the said channel, daily trend line resistance and weekly price indicating room to move lower – may see additional selling emerge today, eyeing key figure 1.30 as a possible target.
Areas of consideration:
Traders considering a short position at current price likely have Friday’s high at 1.3075 set as a potential base for stops. That’s approximately a 27-point stop, with more than 30 points to the first take-profit target at daily support drawn from 1.3018.
Governed by this, reducing risk to breakeven at 1.3018 and taking partial profit off the 1.30 key figure/January’s opening level at 1.2975 is a viable approach. The next point of support beyond here falls in at daily Quasimodo support drawn from 1.2926.
USD/CHF:
Weekly gain/loss: +0.02%
Weekly close: 0.9723
Weekly perspective:
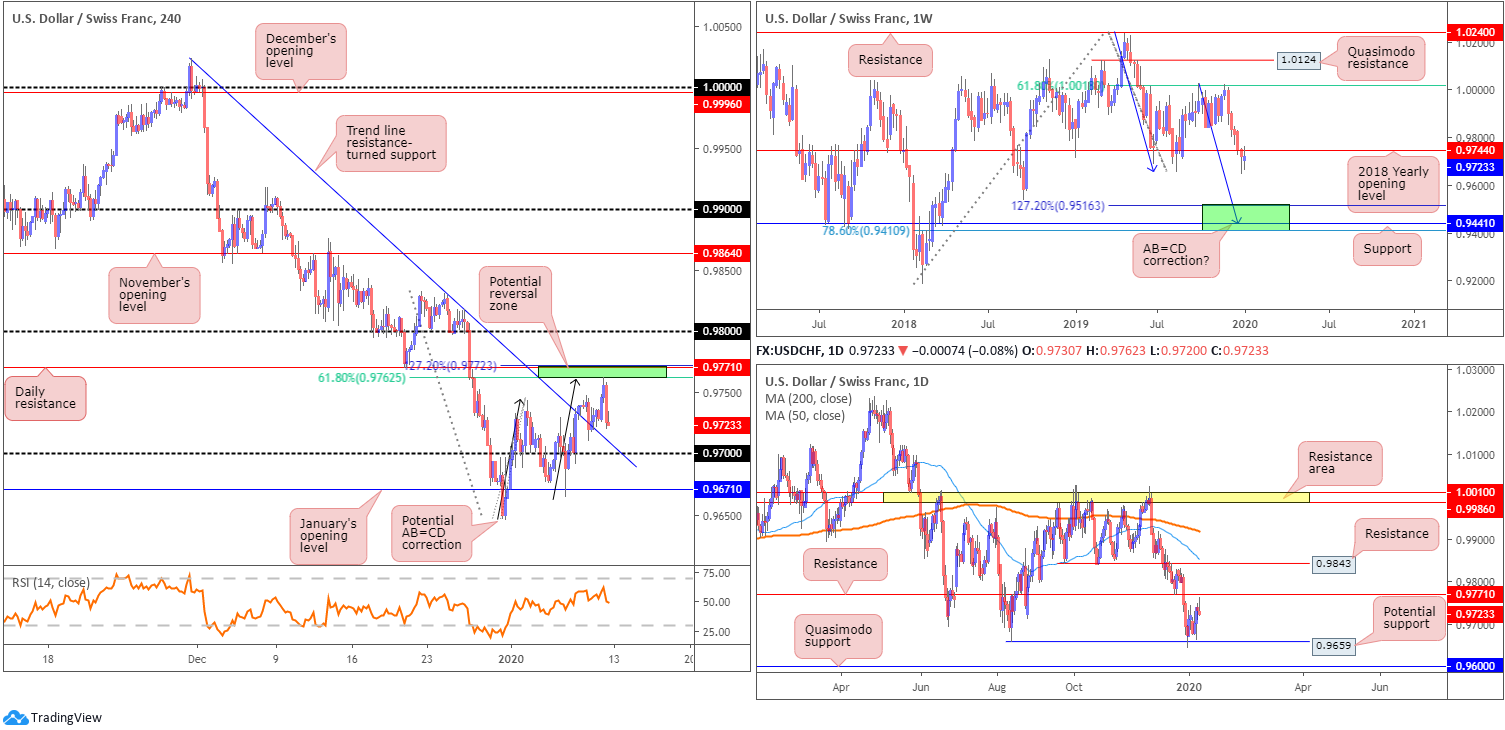
Since shaking hands with the underside of a 61.8% Fibonacci retracement ratio at 1.0018, the pair entered a strong five-week bearish phase and activated sell stops south of the 2018 yearly opening level at 0.9744.
Last week witnessed price action retest the underside of 0.9744 and modestly hold firm. In the event we continue navigating lower ground this week, the next downside target can be seen around the 0.9410/0.9516 region (comprised of a 78.6% Fibonacci retracement at 0.9410, support at 0.9441 and a 127.2% AB=CD bullish correction [black arrows] at 0.9516 – green).
Daily perspective:
Daily resistance at 0.9771 came within a few points of entering the fight last week, after a period of consolidation formed off 0.9659.
Areas of interest beyond the said zones can be found at resistance coming in from 0.9843 and a Quasimodo support at 0.9600. Both the 200-day SMA (orange – 0.9918) and 50-day SMA (blue – 0.9853) face a southerly bearing, with the 50-SMA drifting south of the 200-SMA.
H4 perspective:
For those who read recent analysis you may recall the following piece:
Further buying towards daily resistance at 0.9771 is possible. Note this level merges closely with a 127.2% H4 AB=CD bearish correction (black arrows) at 0.9772 and a 61.8% H4 Fibonacci resistance at 0.9762 (green). Also notable is the weekly timeframe: the 2018 yearly opening level at 0.9744 is currently in motion.
As evident from the chart, Friday struck the lower edge of 0.9772/0.9762 and turned lower, aided following the release of less-than-stellar US employment data.
Areas of consideration:
Traders short from 0.9772/0.9762 likely have trend line resistance-turned support, etched from the high 1.0023, set as the initial take-profit target, though some may have already reduced risk to breakeven. The 0.97 handle also represents an additional target, as does January’s opening level at 0.9671.
Dow Jones Industrial Average:
Weekly gain/loss: +0.62%
Weekly close: 28814
Weekly perspective:
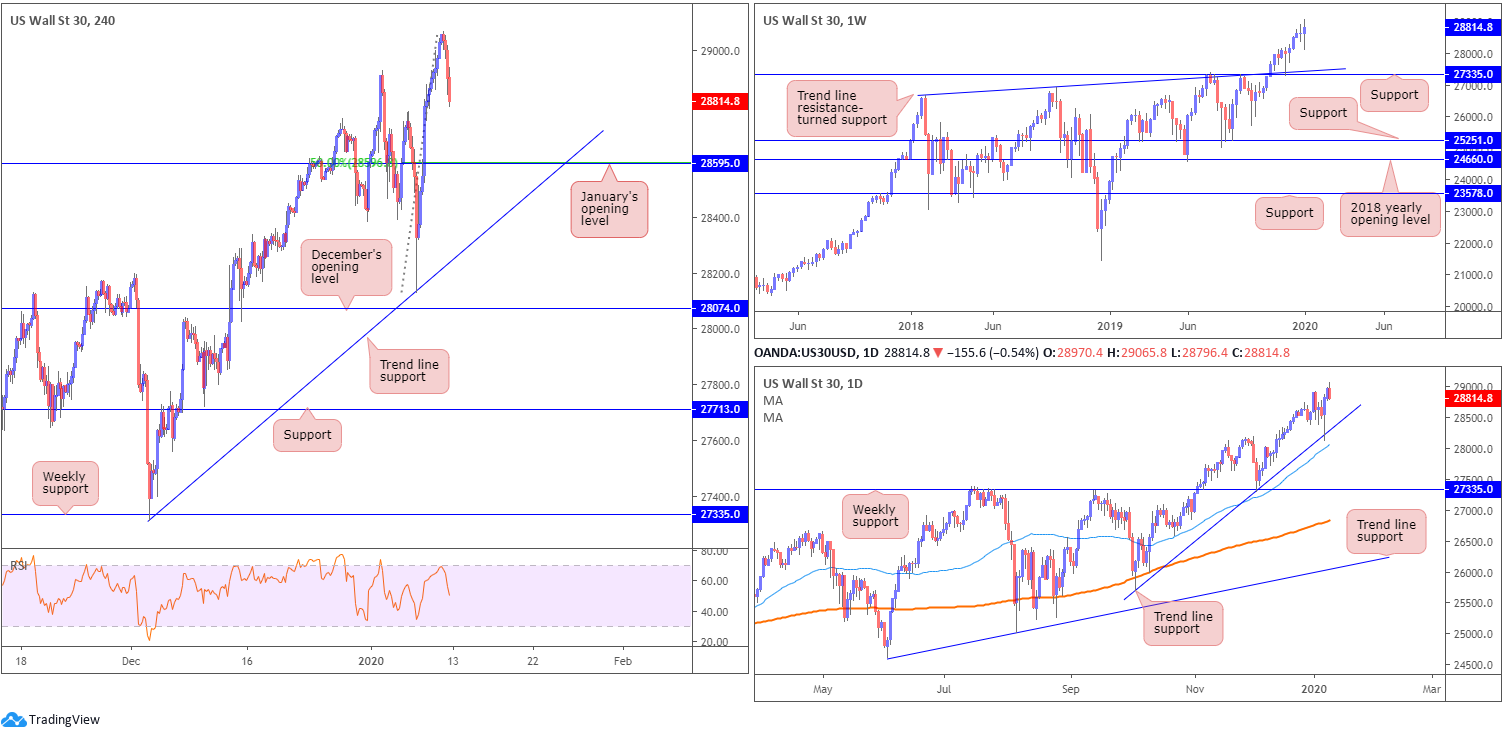
Following a weekly hammer candlestick pattern (considered a buy signal at troughs), formed six weeks back at the retest of support drawn from 27335, along with trend line support etched from the high 26670, the index continued to advance higher, testing fresh record peaks of 29065 last week.
Candlestick traders may also wish to note the week ended in the form of a bullish outside pattern, eclipsing three weeks’ worth of previous action.
Daily perspective:
Meanwhile, on the daily timeframe, trend line support, extended from the low 25710, entered the fray in recent movement, bolstered by additional support nearby from the 50-day SMA (blue – 28074).
H4 perspective:
US stocks declined Friday as buying levelled out after data showed slower-than-expected US jobs and wage growth in December. The Dow Jones Industrial Average declined 133.13 points, or 0.46%; the S&P 500 fell 9.35 points, or 0.29% and the tech-heavy Nasdaq 100 lost 22.99 points, or 0.26%.
Technical research has H4 price eyeing a possible retest at January’s opening level from 28595, which happens to align with a 50.0% retracement ratio. Another point of interest on the H4 scale, beneath the monthly level, is trend line support, extended from the low 27314.
Areas of consideration:
With the uptrend remaining strong, and daily price recently shaking hands with trend line support, January’s opening level from 28595 may serve as a platform for buyers seeking a buy-the-dip scenario this week.
Conservative traders wishing to add a little more confirmation to the mix may wait and see if a H4 bullish candlestick pattern forms before committing (confirmation techniques will, of course, be trader dependent). This helps recognise intent to take things higher and provides structured entry and risk levels to work with, making risk/reward calculations easier.
XAU/USD (GOLD):
Weekly gain/loss: +0.64%
Weekly close: 1562.0
Weekly perspective:
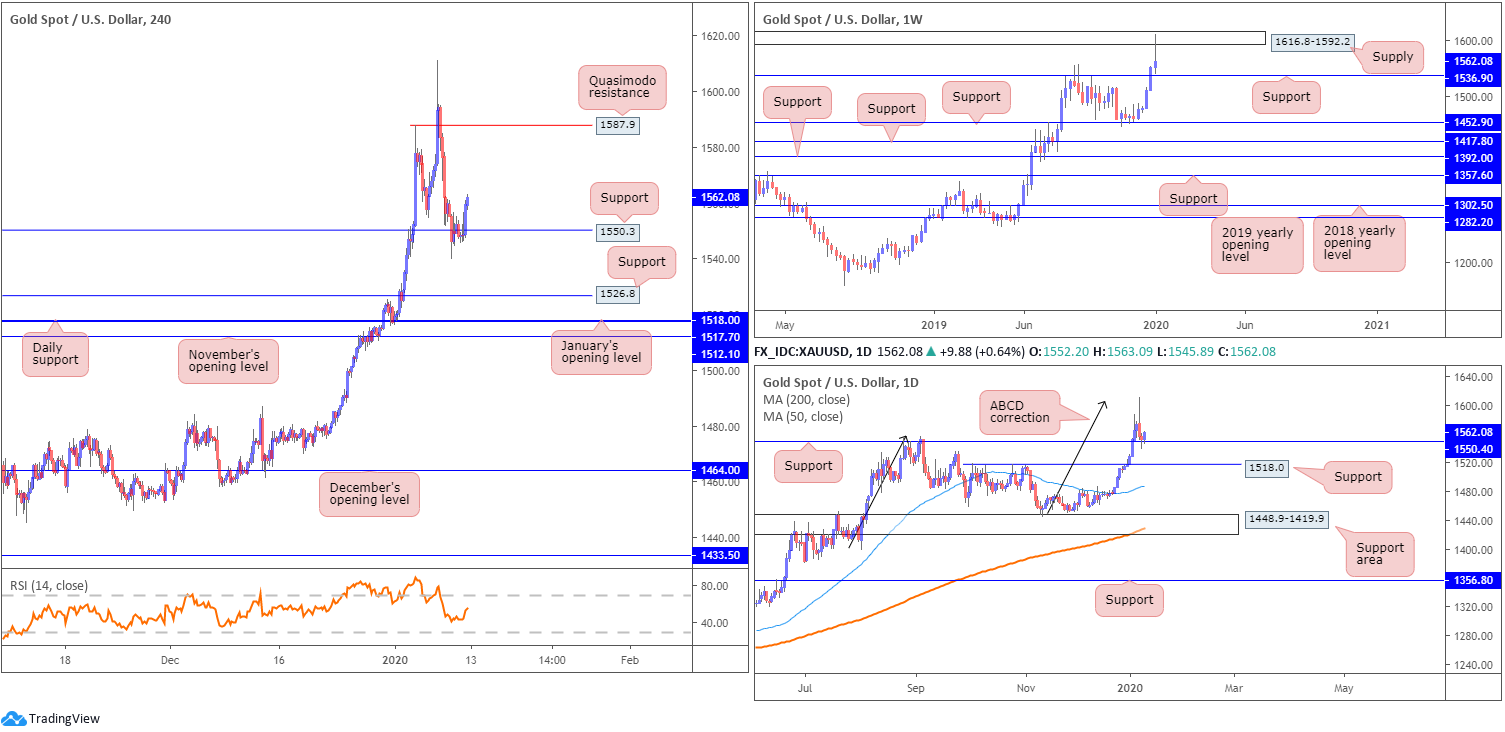
Supply at 1616.8-1592.2 entered the mix last week after gold rose to highs of 1611.3 amid risk aversion. Support is seen reasonably close by at 1536.9, though a break highlights additional layers of support at 1452.9, 1417.8, 1392.0 and 1357.6.
Daily perspective:
In similar fashion to the weekly timeframe, the daily chart has support in motion at 1550.4, with a violation exposing another coating of support nearby at 1518.0. What’s also interesting on the daily timeframe is the recently formed ABCD bearish correction (black arrows) at 1608.0. It might also be worth noting the 200/50-day SMAs point north (orange – 1428.6/blue – 1487.8), with the 50-SMA drifting north of the 200-SMA.
H4 perspective:
Friday’s intraday movement spiked higher following a contraction in US employment and average hourly earnings data for December. Support at 1550.3 (a prior Quasimodo resistance), despite price surpassing the level to lows of 1540.8 in the week, held firm into the close, clocking highs of 1563.0. Note this level converges with daily support at 1550.4, and positions itself slightly above weekly support at 1536.9. Also likely appealing from a buyer’s perspective is the sell stops triggered from beneath the 1554.8 January 7 low, which provides liquidity to buy into.
Areas of consideration:
While some traders were likely waiting on a bullish candlestick signal to form off 1550.3, unfortunately they likely missed the opportunity here as very little was seen. Others who entered at market and set protective stop-loss orders beneath weekly support at 1536.9 ended the week in mild gains, though the option of reducing risk to breakeven was certainly there as price reached close to a 1:1 risk/reward ratio.
As for upside targets, for traders who remain long, areas of resistance in sight fall in at 1587.9, a Quasimodo resistance, followed by the underside of weekly supply at 1592.2.
The accuracy, completeness and timeliness of the information contained on this site cannot be guaranteed. IC Markets does not warranty, guarantee or make any representations, or assume any liability regarding financial results based on the use of the information in the site.
News, views, opinions, recommendations and other information obtained from sources outside of www.icmarkets.com.au, used in this site are believed to be reliable, but we cannot guarantee their accuracy or completeness. All such information is subject to change at any time without notice. IC Markets assumes no responsibility for the content of any linked site.
The fact that such links may exist does not indicate approval or endorsement of any material contained on any linked site. IC Markets is not liable for any harm caused by the transmission, through accessing the services or information on this site, of a computer virus, or other computer code or programming device that might be used to access, delete, damage, disable, disrupt or otherwise impede in any manner, the operation of the site or of any user’s software, hardware, data or property.


